
Leveraging AI in your web apps to transform geospatial data
Last month, at the 2025 Esri Developer and Technology Summit I presented a speedgeeking session where I demoed how a simple text query can turn into dynamic map highlights using the Google Gemini natural language API and the ArcGIS Maps SDK for JavaScript. So, let’s explore exactly how I built that GIS web app — from prompt to map — in just a few steps and with minimal code.

Why Gemini + GIS?
I love finding fun ways to put together what I’m learning with what I already know. In this case, I wanted to let users type any question (“List the top 3 hottest countries,” “Show me countries with population > 100 million,” etc.) and instantly highlight the results on a world map. Gemini handles the natural-language parsing, while ArcGIS handles the spatial query and rendering.
1. Project Setup
1.1 Create your files
In VS Code, create a new folder and inside it create the following files:
- index.html
- scripts.js
- styles.css
1.2 HTML skeleton
Use the VSCode shortcut (! + Enter) to scaffold your HTML. Then, link your CSS and JS local files:
Gemini + ArcGIS Demo
Enter fullscreen mode
Exit fullscreen mode
1.3 Include ArcGIS JS SDK & Calcite
Add these inside before your styles.css and scripts.js:
Enter fullscreen mode
Exit fullscreen mode
1.4 ArcGIS API key
Still in , set your key:
var esriConfig = { apiKey: "YOUR_ARCGIS_KEY" };
Enter fullscreen mode
Exit fullscreen mode
2. Build the UI
2.1 Layout the map and controls
In the , create two columns—map on left, controls on right:
Submit
Enter fullscreen mode
Exit fullscreen mode
2.2 CSS for layout
Add minimal CSS in styles.css:
html, body, arcgis-map {
padding:0;
margin:0;
height:100%;
width:100%;
}
.main-container {
display:flex;
height:100%;
}
.left-column {
flex:1;
}
.right-column {
position:absolute;
top:10px;
right:10px;
background:rgba(255,255,255,0.9);
padding:1rem;
border-radius:4px;
max-width:250px;
}
#countryList {
margin:0.5rem 0;
padding-left:1rem;
}
Enter fullscreen mode
Exit fullscreen mode
3. Gemini Query Logic
Open scripts.js. First, store your Gemini key and feature layer URL:
const googleGeminiApiKey = "YOUR_GEMINI_KEY";
const featureLayerURL = "https://services.arcgis.com/P3ePLMYs2RVChkJx/arcgis/rest/services/World_Countries_(Generalized)/FeatureServer/0";
Enter fullscreen mode
Exit fullscreen mode
💡 Pro Tip: Put your keys in a separate config.js that’s git-ignored, then import them. That way you never accidentally commit secrets.
3.1 The fetchCountriesFromQuery function
This function:
Sends query (q) + instructions to Gemini
Splits the returned text by lines
Strips numbering, extracts country names & explanation
async function fetchCountriesFromQuery(q) {
const res = await fetch(
`https://generativelanguage.googleapis.com/v1beta/models/gemini-1.5-flash:generateContent?key=${googleGeminiApiKey}`, {
method:'POST',
headers:{ 'Content-Type':'application/json' },
body: JSON.stringify({
contents:[{ parts:[{
text: q +
" only list the country names in a numbered list, then on a new line start with 'Explanation:' and provide a one-sentence explanation."
}]}]
})
}
);
const data = await res.json();
const lines = data.candidates[0].content.parts[0].text.split('\n');
const countries = [], explanationLines = [];
for (let line of lines) {
const cleaned = line.replace(/^\d+\.?\s*/,'').trim();
if (/^Explanation:/i.test(cleaned)) explanationLines.push(cleaned.replace(/Explanation:\s*/i,''));
else if (/^[A-Za-z\s]+$/.test(cleaned) && cleaned) countries.push(cleaned);
}
return { countries, explanation: explanationLines[0] || "" };
}
Enter fullscreen mode
Exit fullscreen mode
4. Highlighting on the Map
4.1 Initialize map reference
Still in scripts.js, after page load:
const mapEl = document.getElementById('map');
let currentHighlightLayer = null;
Enter fullscreen mode
Exit fullscreen mode
4.2 The highlightCountries function
This function:
Removes any existing highlight layer
Builds a SQL WHERE clause from the country list
Queries the FeatureLayer
Creates a GraphicsLayer with red fills
async function highlightCountries(countries) {
if (currentHighlightLayer) mapEl.map.remove(currentHighlightLayer);
const where = `COUNTRY IN (${countries.map(c=>`'${c.replace(/'/g,"''")}'`).join(',')})`;
const [FeatureLayer, Graphic, GraphicsLayer] = await Promise.all([
$arcgis.import('esri/layers/FeatureLayer'),
$arcgis.import('esri/Graphic'),
$arcgis.import('esri/layers/GraphicsLayer')
]);
const fl = new FeatureLayer({ url: featureLayerURL, token: esriConfig.apiKey });
const result = await fl.queryFeatures({ where, outFields:['*'], returnGeometry:true });
const hlLayer = new GraphicsLayer();
result.features.forEach(f => {
hlLayer.add(new Graphic({
geometry: f.geometry,
symbol: { type:'simple-fill', color:[255,0,0,0.5], outline:{color:'red',width:2} }
}));
});
currentHighlightLayer = hlLayer;
mapEl.map.add(hlLayer);
}
Enter fullscreen mode
Exit fullscreen mode
5. Wire Up User Interaction
Attach an event listener to the Submit button:
const listEl = document.getElementById('countryList');
const explEl = document.getElementById('explanation');
document.getElementById('submitQuery').addEventListener('click', async () => {
const q = document.getElementById('userInput').value.trim();
if (!q) return;
listEl.innerHTML = explEl.textContent = "";
const { countries, explanation } = await fetchCountriesFromQuery(q);
// display list & explanation
listEl.innerHTML = countries.map(c=>`${c}`).join('');
explEl.textContent = explanation;
// highlight on map
await highlightCountries(countries);
});
Enter fullscreen mode
Exit fullscreen mode
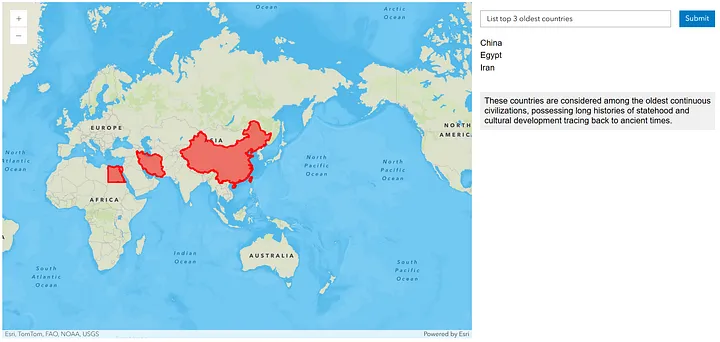
6. Test & Iterate
Open index.html in your browser.
Type a query like “Top 3 most populous countries”.
Click Submit.
Watch the list populate and the map highlight those countries.
💡 Pro Tip: Use your browser console to inspect countries and explanation arrays—this helps debug parsing logic.Feel free to tweak the prompt instructions, styling, or symbol colors. You’ve now built a fully interactive GIS web app driven by natural language!
Conclusion
In just about 100 lines of code, you’ve combined Gemini’s NLP power with ArcGIS’s mapping capabilities to transform user text into geospatial insights. This pattern — natural language → structured data → spatial visualization — unlocks countless possibilities for dynamic, user-driven maps.This article was written by Courtney Yatteau, a Developer Advocate at Esri. The opinions expressed in this article are solely Courtney’s and do not necessarily represent the views, strategies, or opinions of her employer. If you have any feedback, please feel free to like and/or comment. Additionally, if you have any questions or comments that you’d prefer to send privately, you can contact Courtney through LinkedIn, X, or Bluesky. If you’re considering a career switch, looking to get into tech, or curious about what it’s like to work at Esri, then please stay tuned for future posts! You can also check out Esri’s careers page or this video for more information.