TL;DR
Performance optimization often comes down to small, well-measured improvements. In this article, we take a concrete Angular use case — rendering thousands of live-updating components — and optimize it step by step. With each adjustment, we measure the impact using profiling tools like Lighthouse and DevTools, focusing not only on what to change, but why it works.
Introduction
I’ve been developing applications with Angular for around 13 years now. Some of these were very classical frontend applications where most of the complexity resided in the backend and performance optimizations had to be done there (SQL optimization, backend code profiling, cache management, infrastructure adjustments, architecture adjustments…). Others had much more complex characteristics on the frontend that needed deep optimisations to keep a good user experience.
This journey has given me a lot of opportunities to find typical bottlenecks, performance issues, and how to avoid them. Along the way, I’ve read a lot of articles on that topic, but it often felt like the same recycled stuff again and again, filled with pretty vague advice rather than concrete code examples, that would have highlighted what’s the issue, what would be the solution and provided profiling metrics to measure how effective the provided solution is.
The objective of this article is to provide a full example of code optimisation with Angular, in the specific case of a UI managing a lot of elements.
Don’t get me wrong, many of the tips here may sound familiar, but I’ll try to bring more context for each tip, as well as performance profiling analysis to help grasp what happens behind the scenes.
My rationale is the following : if you can understand the underlying reasons why you’re applying a fix or a pattern (instead of applying it blindly because you’ve read somewhere that it’s better for some reason), you’ll get better at finding problems early in your applications and coming up with the right solutions.
About the example application
The application used as an example here illustrates a situation I encountered a few years ago, simplified to the bare minimum for the sake of clarity. One of the specificities of this application is that it grew in a way that it ended up needing to display tens of thousands of independant components, all synchronized live across all users through WebSocket messages.
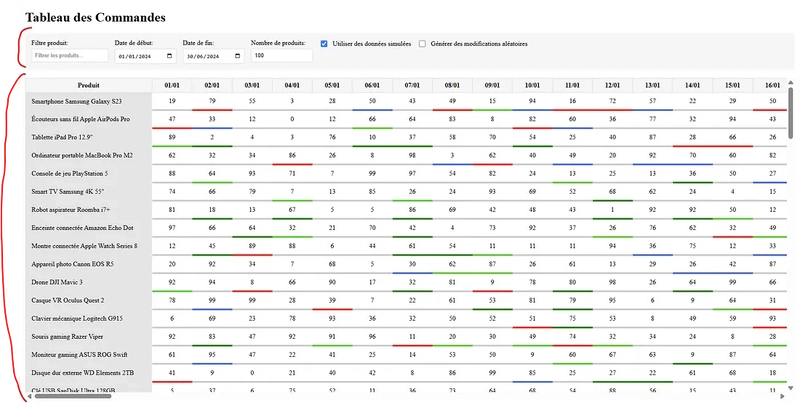
To illustrate this issue, we’ll start with a very simple application displaying a list of products, and for each of these products, a daily quantity and status for a given period. To simulate live modifications that should be received through WebSocket messages in the real application, random incrementations will be performed on order quantities and dispatched through an observable.
The objective is to end up with an application able to handle hundreds of products over multiple years (hundreds of columns for daily quantities) and to be able to display updates with close to no delay.
Base architecture
This test application provides 2 sections :
- a
settings sectionallowing to manage how many datapoints we want to manage, and to toggle random modifications simulation ; - a
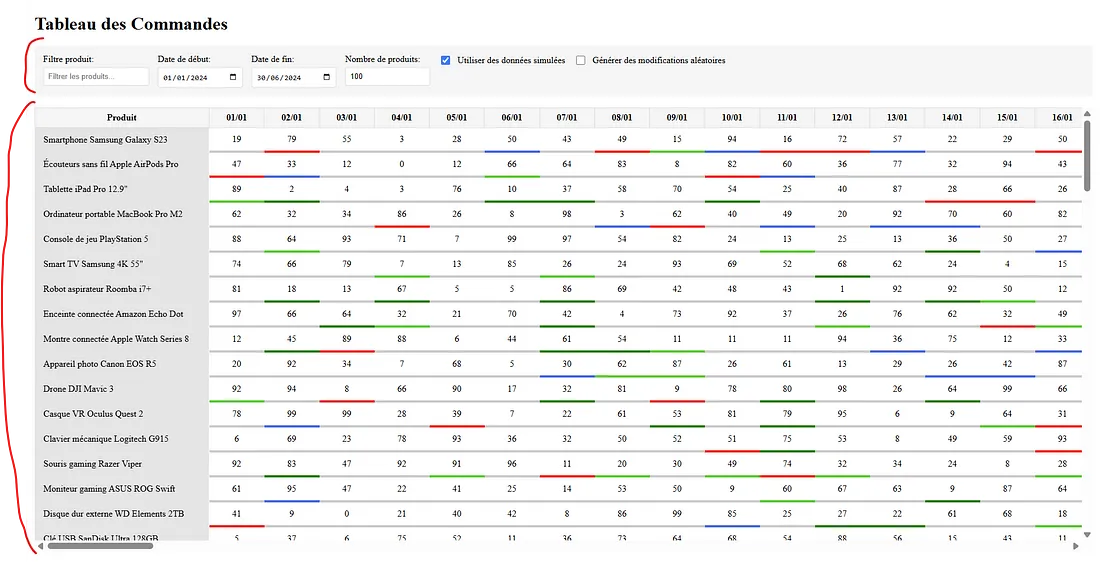
table displaying the datapoints(quantity, status) and highlighting the cells that were recently modified, to visually help seeing the modifications live in that sea of data. Here is the global directory structure we’re starting with :
Here is the global directory structure we’re starting with :
src/
├── app/
│   └── orders/
│       ├── components/
│       │   ├── order-table/             # The list of orders
│       │   └── preference-controls/     # The list of settings (date start, date end, number of lines...)
│       ├── models/                      # model files
│       ├── pipes/                       # pipes used across the orders module
│       └── services/                    # services for managing orders data, user preferences, cache...
├── index.html
├── main.ts
├── styles.scss
└── other typical Angular project files...
Part 1 — Display performance
Profiling and problems identification
The first thing to do is to profile the loading performance of the page. For that, we’re going to use Lighthouse :
- open your application in private mode and ensure no extension is activated as it can have significant impact on performance, especially on applications with a lot of DOM elements.
- open your Chrome debugger and got to the Lighthouse tab.
- for this test, we’re only interested in performances profiling, so you can uncheck the other categories.
- choose computer as the device and launch the analysis.
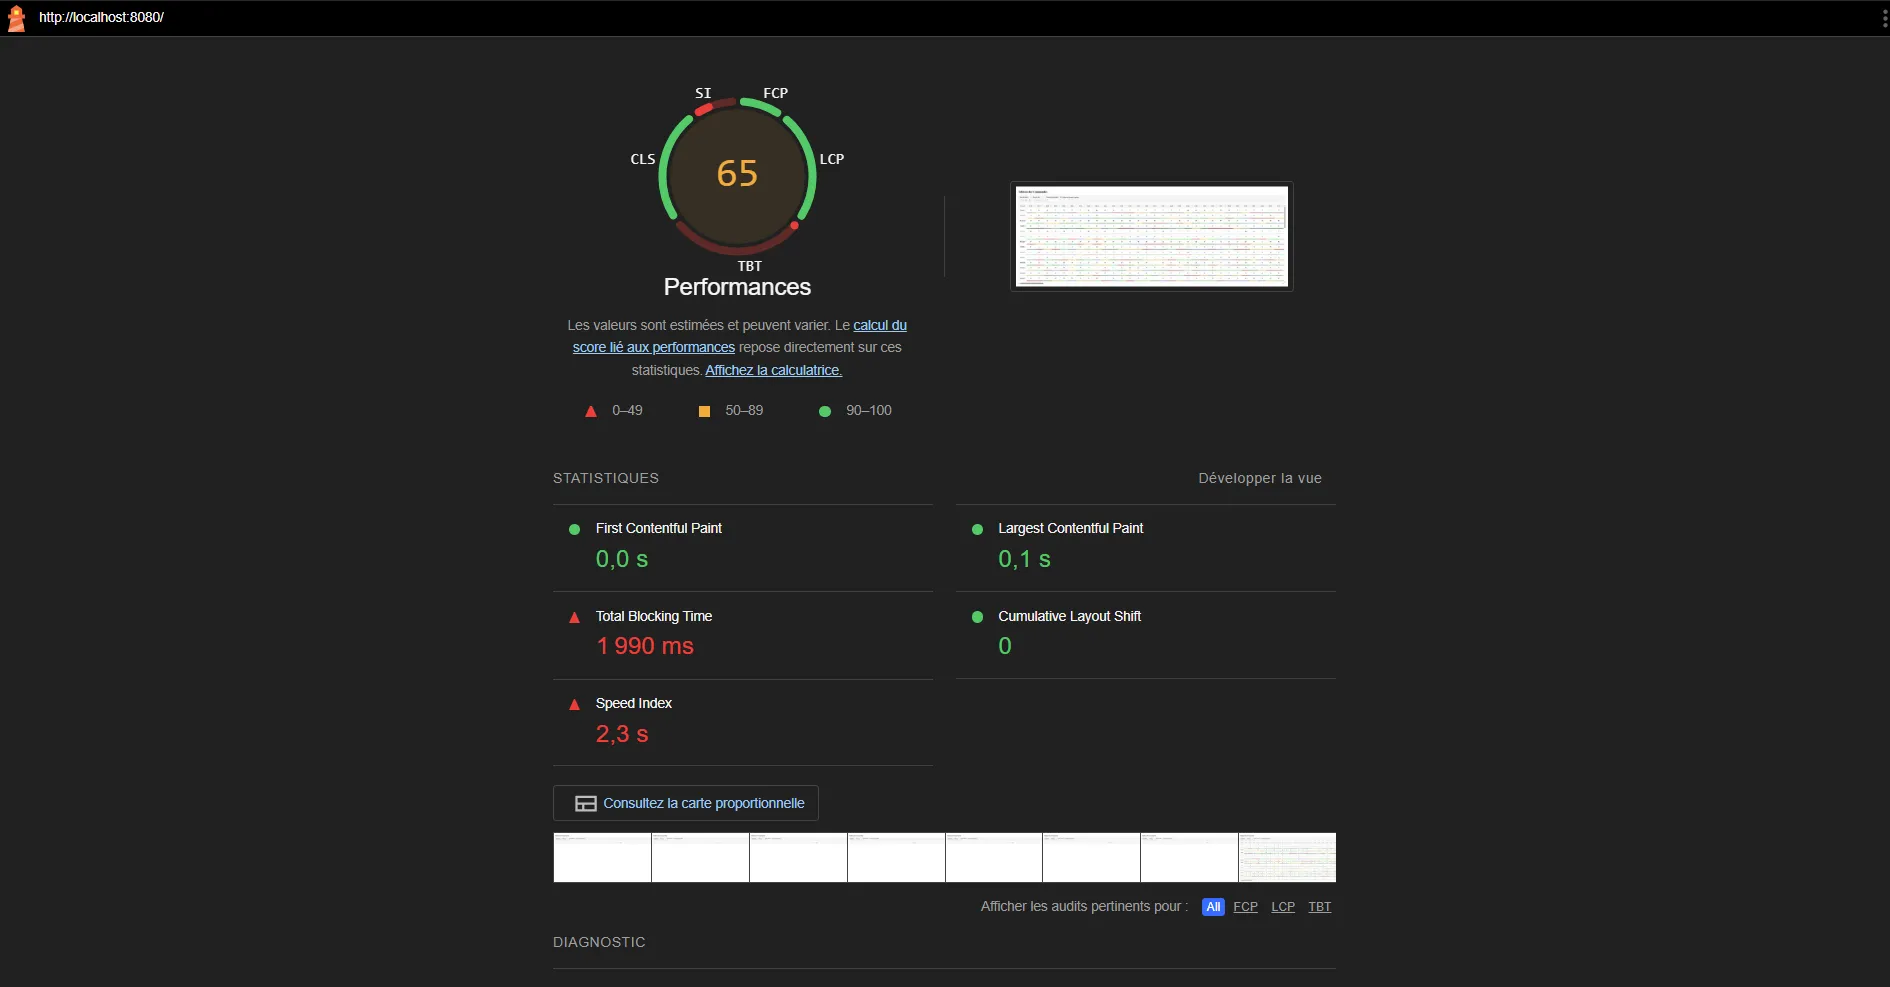
After a minute, here is what we get :
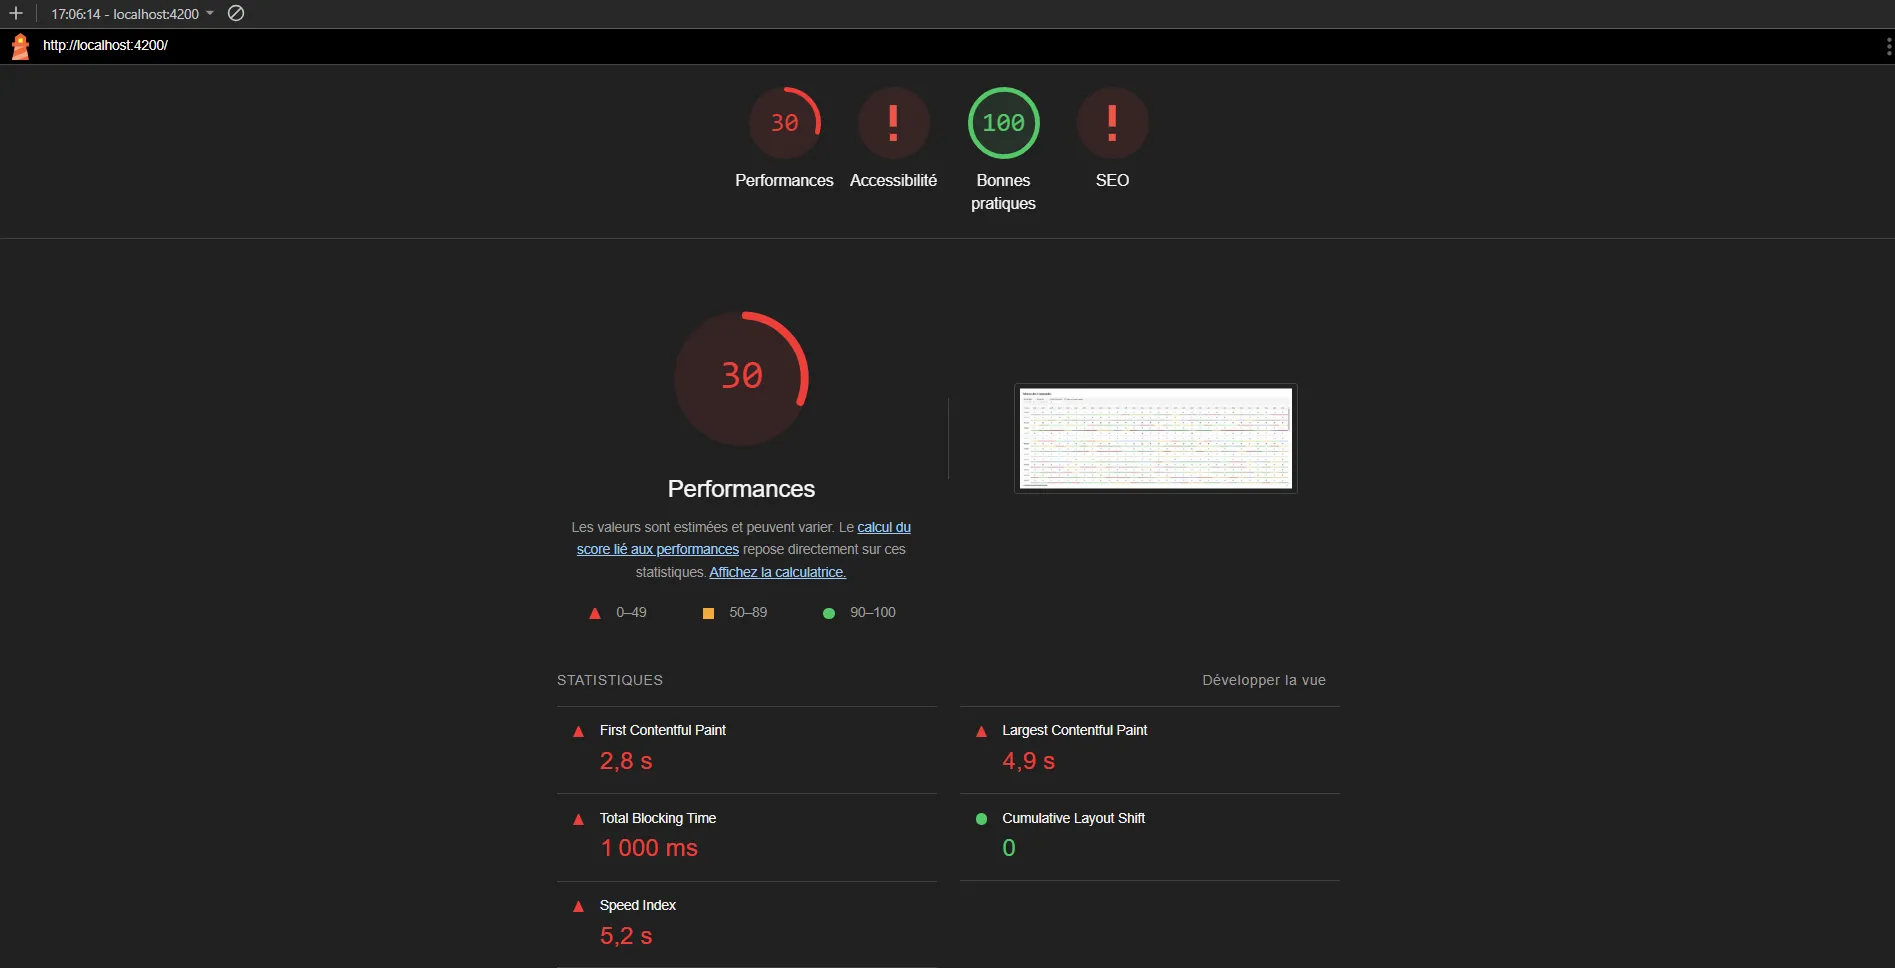
Just for displaying our data, with no other interaction, a first contentful paint at almost 3 seconds is far from good. There are multiple reasons for that, some of which are explicitly highligted by Lighthouse.
Main issues identification
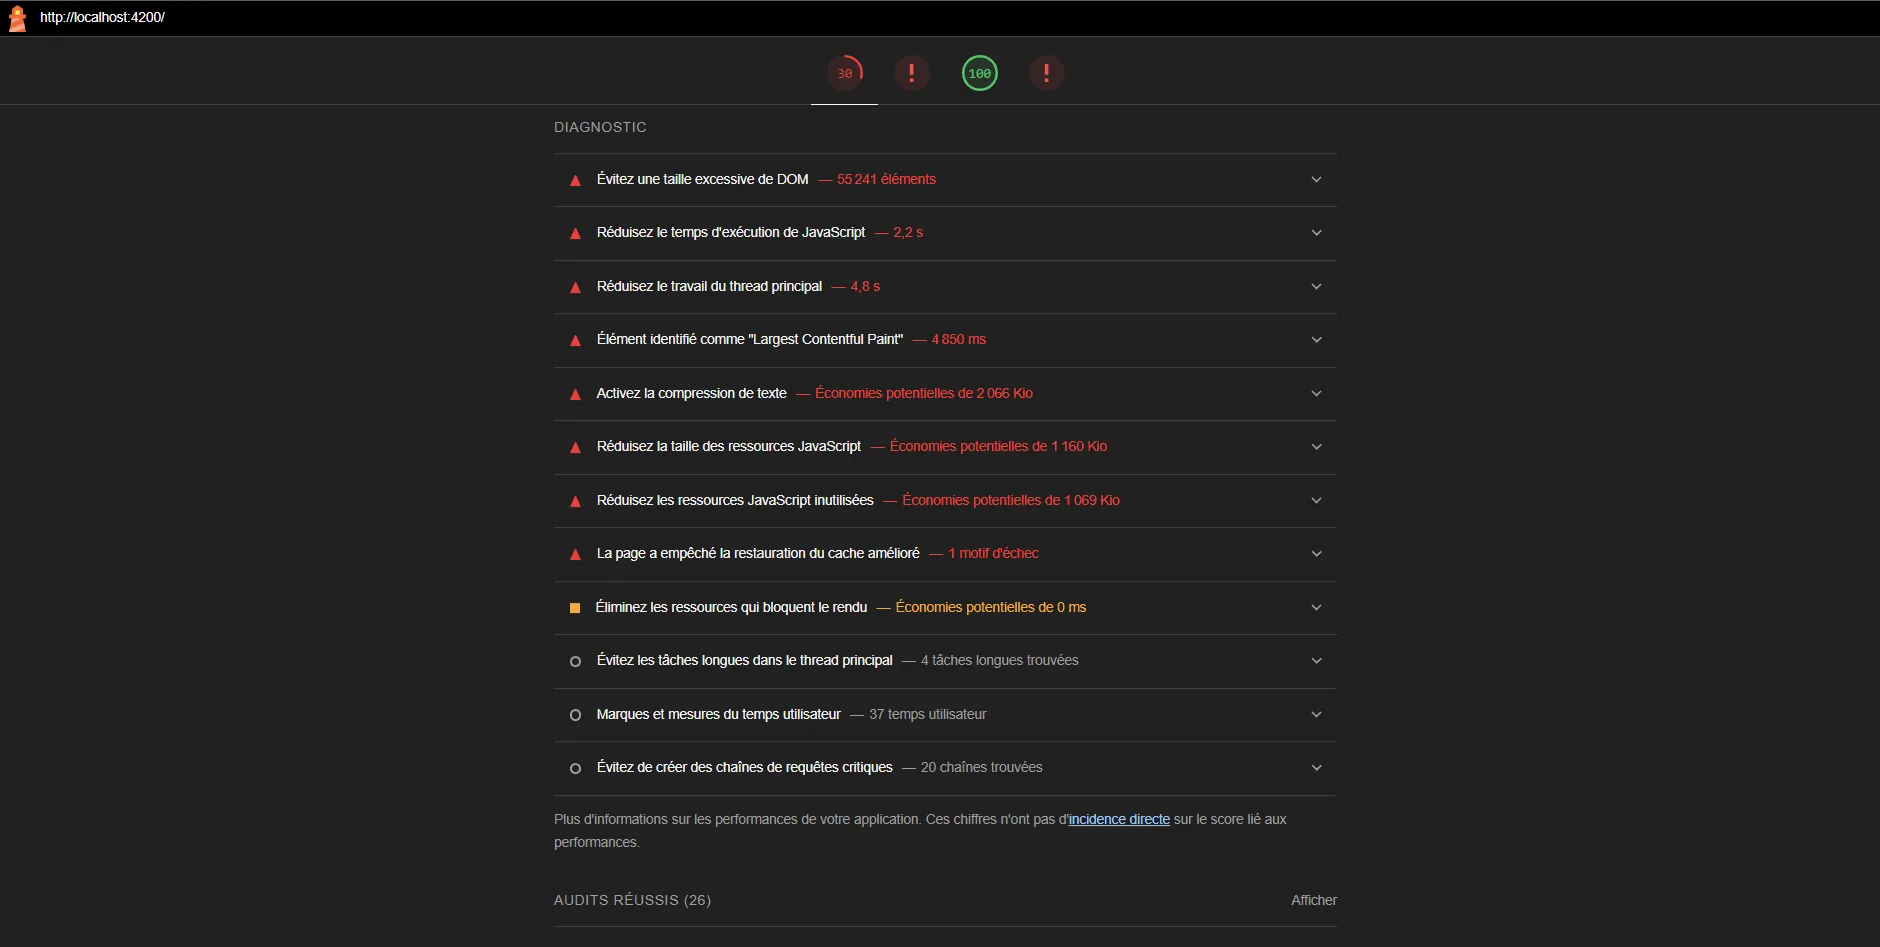
Let’s inspect main issues highlighted there.
🧱 Problem n°1 : Avoid an excessive DOM size
A large number of elements is one of the core characteristic of our demo application. We can improve things a bit on that side, but let’s keep that for a later stage.
⌛ Problem n°2 : Reduce JavaScript execution time
We’ll need to make a more detailed profile on script execution at page load, but for now, there isn’t very much logic implemented on our own apart from generating data and displaying it. Let’s keep that in mind for later.
🧠 Problem n° 3 : Reduce the main thread workload
There’s something we can do here for a quick win. A big part of the time spent when loading the page is spent generating the data. That’s not something that would typically happen in a real application as the data would come from a REST API in most cases, but it’s interesting for two reasons :
- it simulates / replaces the wait time you could have when requesting a heavy REST API
- it gives us an example of some heavy calculation code that blocks the main thread, and we’re going to fix that.
Fix 1 : reduce the main thread workload with a web worker
JavaScript is single threaded. It means that when you have to perform heavy calculation or heavy synchronous scripting in general, it’s going to monopolize the thread, thus making the interface unresponsive.
However, there’s a solution to execute these scripts outside of the main thread, in a Web Worker. “But wait, you just told me that JavaScript was single threaded”.
Well, this is where an important but subtle distinction comes in:
JavaScript is single-threaded, but the browser is not.
The JavaScript engine (such as V8 in Chrome, SpiderMonkey in Firefox, or JavaScriptCore in Safari) is responsible for executing your JavaScript code. This engine runs on a single thread, commonly referred to as the main thread.
However, this engine doesn’t live in isolation. It runs inside a larger environment — the browser — which exposes a set of features known as Web APIs. These APIs are not part of JavaScript itself (it’s not part of the ECMAScript specification), but are made available to it.
This distinction is essential: while JavaScript is single-threaded, the browser is not. Thanks to Web APIs such as setTimeout, fetch, WebSocket, and Worker, JavaScript can delegate tasks outside of the main thread and in parallel, without blocking the execution of the main program.
For instance:
- A fetch() request is handled by the browser’s networking layer
- A setTimeout() is scheduled by the timer system.
- And a Web Worker runs in an entirely separate thread, executing its own JavaScript logic and communicating with the main thread via messages.
If you would like to have a visual explanation of these concepts, I recommend to watch this video as Lydia made a fantastic job explaining it in a visual way :
Implementing the Web Worker is pretty easy, I’ll just follow the few steps below :
- create a new ts file : src/app/orders/workers/mock-data.worker.ts
- move the code responsible for creating the mock data into functions in that file
- add the following event listener at the beginning of the file :
addEventListener('message', ({ data }) => {
  // Your logic
  const preferences: OrderPreferences = data;
  const mockData = generateMockData(preferences);

  // Send the result to the main thread
  postMessage(mockData);
});- Replace the generation code in OrderService by the following :
private generateMockDataInWorker(preferences: OrderPreferences): void {
  if (!this.worker) {
    this.worker = new Worker(new URL('../workers/mock-data.worker.ts', import.meta.url), { type: 'module' });

    this.worker.onmessage = ({ data }) => {
      this.dataSubject.next(data);
    };
  }

  this.worker.postMessage(preferences);
}
If you wonder how that works, the bundler (Webpack, Vite, esbuild…) will automatically compile the worker Typescript file into a JavaScript file and import.meta.url will be replaced by the relative URL pointing to the file, making all this work like a charm.
Now, when the service loads, it instantiates a Web Worker who has its own execution environment and starts generating our data without using the main thread. The user interface is therefore still responsive (even if the table is empty until the data is generated), and only when it finishes its job, the worker will send the results to the service which will in turn send it to its consumers through a Subject (an observable).
Let’s run Lighthouse again, and here are the results :
It’s not perfect yet, but already a significant improvement. Here, we can see an instant first contentful paint, however, for some reason, Lighthouse didn’t give me completely consistent results when I ran it multiple times, as I’ve observed many different values ranging from 0s to 1.2s but it’s still way better than the initial 3s.
Fix 2 : add a layer of cache
Whenever a process is long, it’s interesting to think about the benefits of introducing a layer of cache. Of course, before considering cache you should first try to optimize every bit of your code responsible for long scripting time, but here, we’ll consider that this mock generation code is already optimal.
Right now we could improve the user experience by doing the following :
- whenever the data has been generated for a given set of preferences (ex: starting date 01/01/2025, ending date 31/12/2025, number of products 50), it shouldn’t be generated again when the user changes a parameter and comes back to these values. We should then store the result in a CacheService and use it to instantly have the data the next time.
- To avoid losing that data on refresh, it could be stored in localStorage or IndexedDB so that it’s still instantly available on reload. However, storing permanently all of the generations (for all the different values the user has tested) could end up in taking a ton of space, so with a real application, the best might be to only store the mock data for the current settings.
Let’s implement that and see if it improves the load times. I won’t show the detail of the CacheService code as it’s pretty boring stuff, especially the save and load to and from IndexedDB, but here is the general idea : the OrdersService now checks from the CacheService for a given set of preferences before asking the worker to generate data. If the CacheService has data, it’s returned immediately, removing completely the time it would have taken to generate it.
Let’s now run Lighthouse again.
The first contentful paint is now sitting at 0.3s once the cache is s**et up, we might be good enough to move on to the next point. However, Lighthouse still indicates that the main thread has too much stuff to do so let’s dig into it.
Fix 3 : reduce Angular’s weight
Up until now, the measurements we have made with Lighthouse aren’t quite representative of what would happen in production, even from the frontend side, because we’re using the local webserver. When you use ng serve, Angular uses the JIT (Just In Time) compiler whereas when you build your production files with ng build, the AOT (Ahead Of Time) compilation is activated.
The main difference is that in JIT mode, Angular sends the compiler to the client, and the templates are then compiled on the client side. In AOT mode, the templates are compiled ahead of time when you build. AOT mode removes the need to send the compiler (which is pretty heavy) and to perform template compiling client side, which would reduce the scripting in the main thread. You can activate the aot mode with ng serve just by launching it with : ng serve — configuration production
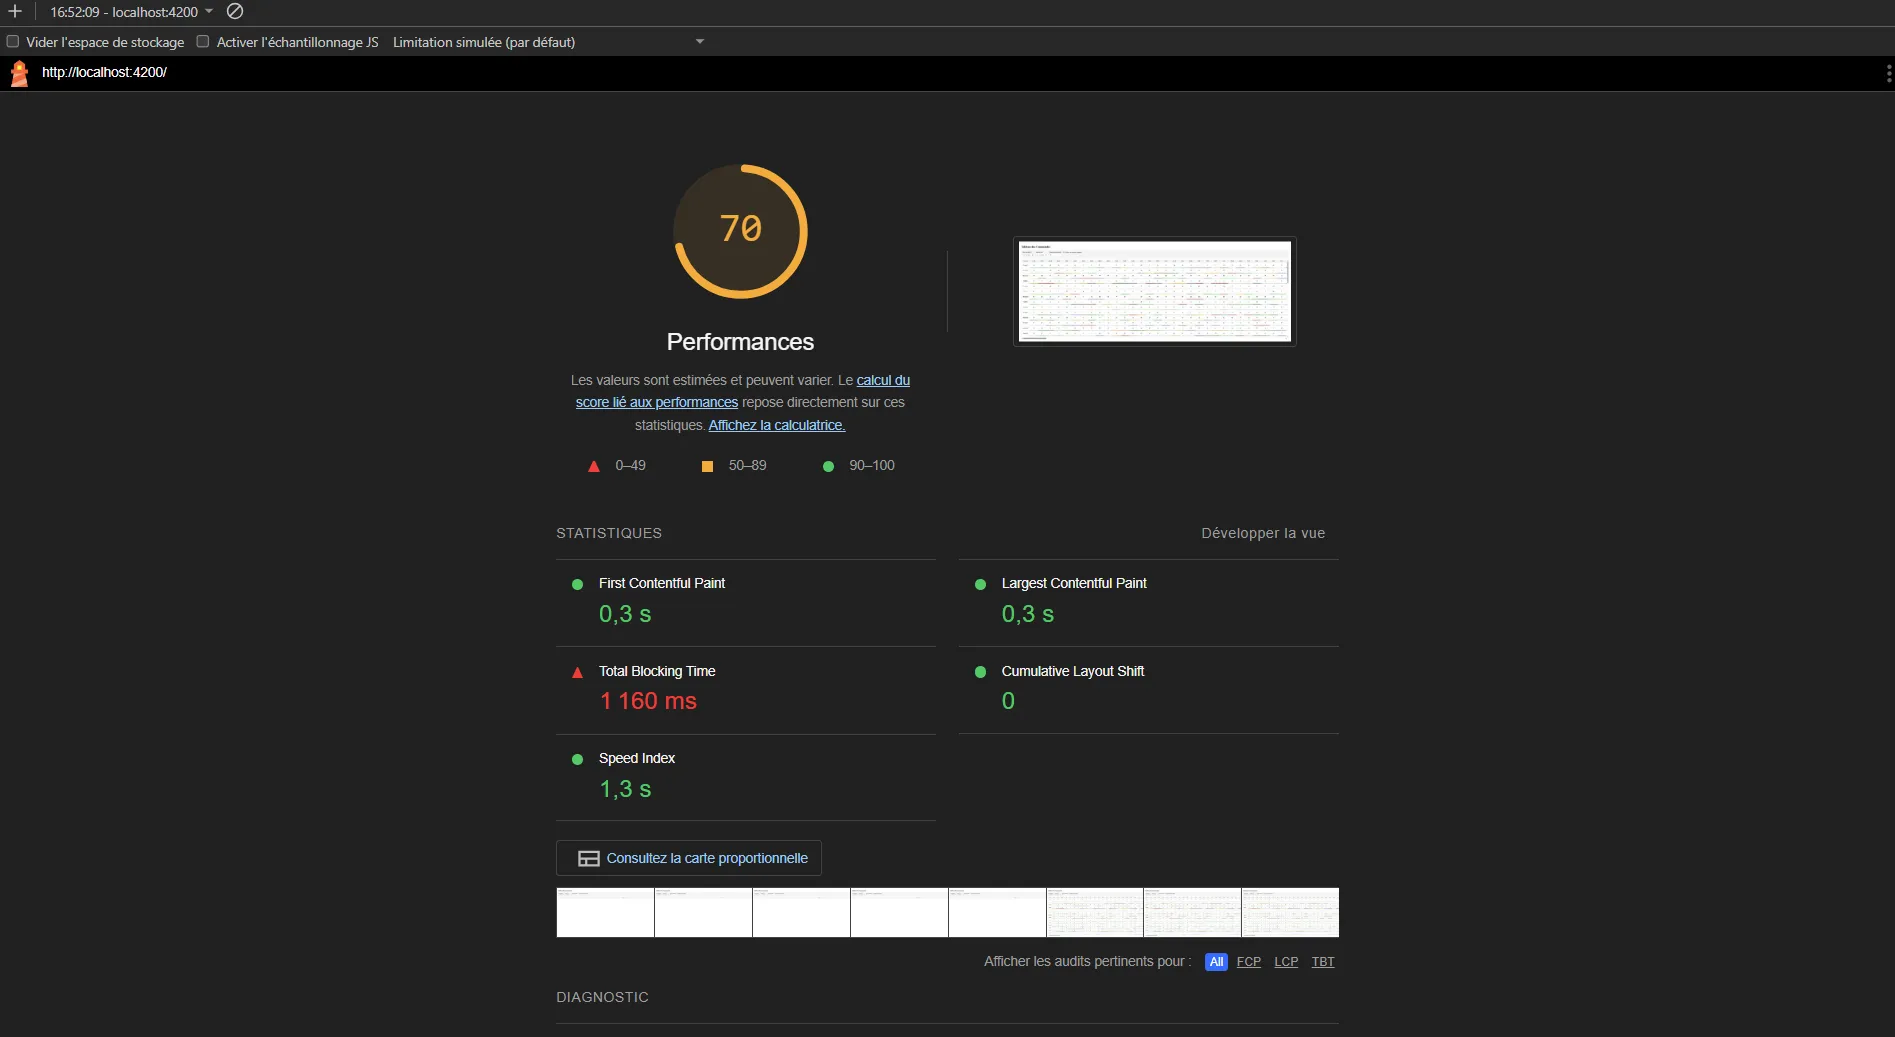
If I perform a new Lighthouse analysis, we can see the warning asking to reduce the main thread worload has vanished, and that the total blocking time has been reduced by 25% from 1160ms to 870ms.
Part 2 — Performance on updates
Now that we’ve improved the initial load time, let’s focus on how the app behaves when real-time updates occur. We’re going to make a few feature additions to that example application :
- Add a behaviour to increment a quantity when the user clicks a cell
- simulate websocket messages holding modifications to the data that needs to be rendered live. For the sake of simplicity, we’ll just simulate quantities updates (no creations or removals). I’ll also add a setting to toggle on / off that simulation depending on what we want to test.
This will allow us to see how the application behaves when modifications need to be displayed and how it can be optimized.
Let’s take a quick look at the incrementQuantity method:
incrementQuantity(product: Product, date: Date): void {
    const dateKey = date.toISOString();
    const currentOrder = product.ordersByDate[dateKey];

    if (currentOrder) {
      const updatedOrder = { ...currentOrder, quantity: (currentOrder.quantity || 0) + 1 };
      product.ordersByDate[dateKey] = updatedOrder;

      const currentData = this.dataSubject.value;
      if (currentData) {
        const productIndex = currentData.products.findIndex(p => p.id === product.id);
        if (productIndex !== -1) {
          currentData.products[productIndex] = {...product};
          this.dataSubject.next(currentData);
        }
      }
    }
  }
This code is pretty straightforward, however there are a few things to note, performance wise :
- The current order is read by its key as it’s much faster than if I had to run across the entire list to find it. As we tend to have a lot of dates, it’s better to access it like this, and the performance will remain the same whether you have 2 elements or 1 million.
- A new reference is set for the updated order instead of modifying the original object. It might be slightly less optimal in performance but I usually prefer doing that in general as it forces components with ** OnPush change detection strategy ** to update and it limits side effects if other code parts depend on the original object.
- The product index is found by iterating over the products and this might be a place to optimize a little, especially if there are a lot of products to handle. It requires to refactor the code so that products are a Map with the id as the key, and here I consider that I won’t have much products to iterate over, so I’ll choose to pass on that one for now.
Now let’s run it and perform a profiling to see what happens when I click a cell. The test is run over a 2 years period and with 100 products.
By the way, if you don’t know how to run a profiling, here’s how :
- Open your Chrome debugger
- Go to the Performances tab
- Click the record button and make the actions you want to profile
- Stop the recording and analyze the data.

The part we’re going to focus on is the 1.71s area during which the page had a bad reactivity. It corresponds to when I clicked a quantity, which provoked an incrementation, and in turn a refresh of the view. From the user standpoint, it gives a clunky interface feeling, because the number gets increased around 2s after you clicked, so you want to avoid that as much as possible.
For starters, let’s look at what happens granularly when the click happens, as this alone represents 612ms of scripting :

Let’s analyze what’s happening here :
- Angular is running change detection
- It refreshes the view which encapsulates the following tasks :
- Removes the tr that was clicked
- Creates a new tr element to replace it
- Creates new td elements for each of the columns
- Evaluates the template for each element
Here, Angular is smart enough to not rebuild the entire table but it still rebuilds the entire row.
A common mistake is appearing clear in that screenshot, which is the use of a function instead of a pipe. Each time change detection is run, a function is going to be reevaluated. In this case, it might not cause a tremendous amount of scripting, but in some cases, if you have a few calculations, some date manipulation, or anything that’s not completely basic, it could add up pretty quickly when there are a lot of nodes.
Instead, you should use a pipe, and if the function you’re extracting into a pipe is calculation heavy, you might also want to implement a memoization feature (cache) to avoid calculating an output multiple times for the same input.
However, in this case, creating a pipe is not gonna be necessary, as we’re going to extract the cell to its own component, and the color will be driven by one of its properties, removing the need to call that getStatusColor() from the template.
OnPush change detection
When Angular runs change detection (to know if it needs to rerender an element), it runs it on the whole application tree by default, which can be time consuming. To avoid that, you can use the OnPush change detection strategy on your components, which will tell Angular to run the change detection only for branches where Inputs have changed (and a few other cases such as when a new value is pushed to an Observable subscribed through the async pipe for example).
The problem is that, here, we have a big OrderTable component, and every subview inside of it (such as any tr or td iterated through *ngFor) isn’t configurable as a dedicated component would be, which means you can’t apply the OnPush strategy directly to these parts. That’s why we’re gonna break down OrderTableComponent into 3 smaller pieces :
- OrderTableComponent for the table
- ProductOrdersComponent for the lines
- OrderCellComponent for the cells
While we’re at it, let’s use the new @for syntax instead of the old *ngFor one :
- it’s easier to read and easier to write
- it forces you to define the field on which you want to track the changes (what would have needed to use
trackBybefore), therefore improving the rendering performances by allowing Angular to not rerender an element it not needed.
New syntax of the for loop as a replacement for *ngFor
@for (product of tableData?.products; track product.id) {

}
A very important detail to note, is that I chose to use the OnPush change detection strategy for all of these components, and for any performance sensitive application such as this one, this should be your default. And that’s precisely why I chose to split my OrdersTable component into smaller pieces, to be able to activate it on every individual piece of the table.
To activate it, you need to add the following configuration to your components :
changeDetection: ChangeDetectionStrategy.OnPushLet’s run the profiling again when clicking a quantity cell.
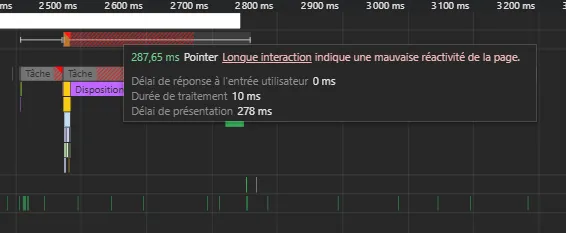
The 1.71s have been largely reduced to 287ms, with a scripting time directly related to the click reduced from 612ms to just 9ms! That’s a much better UX for the user.
However, if you activate the random modifications, which are set to introduce a random modification in the values every 50ms, you can see that it’s far from reaching that frequency of modification.
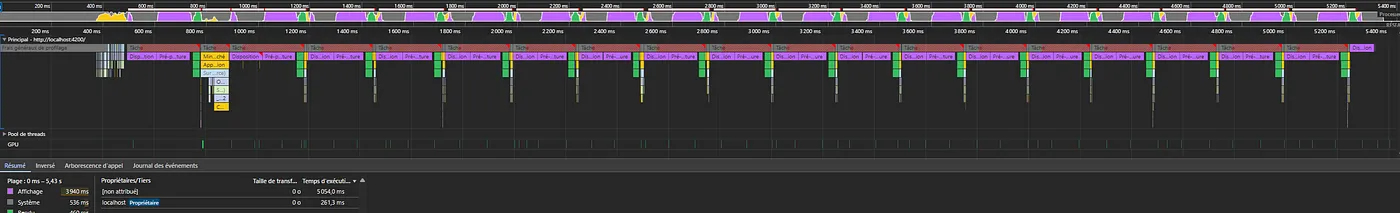
When there is a single product instead of 100, the profiling shows a much different picture
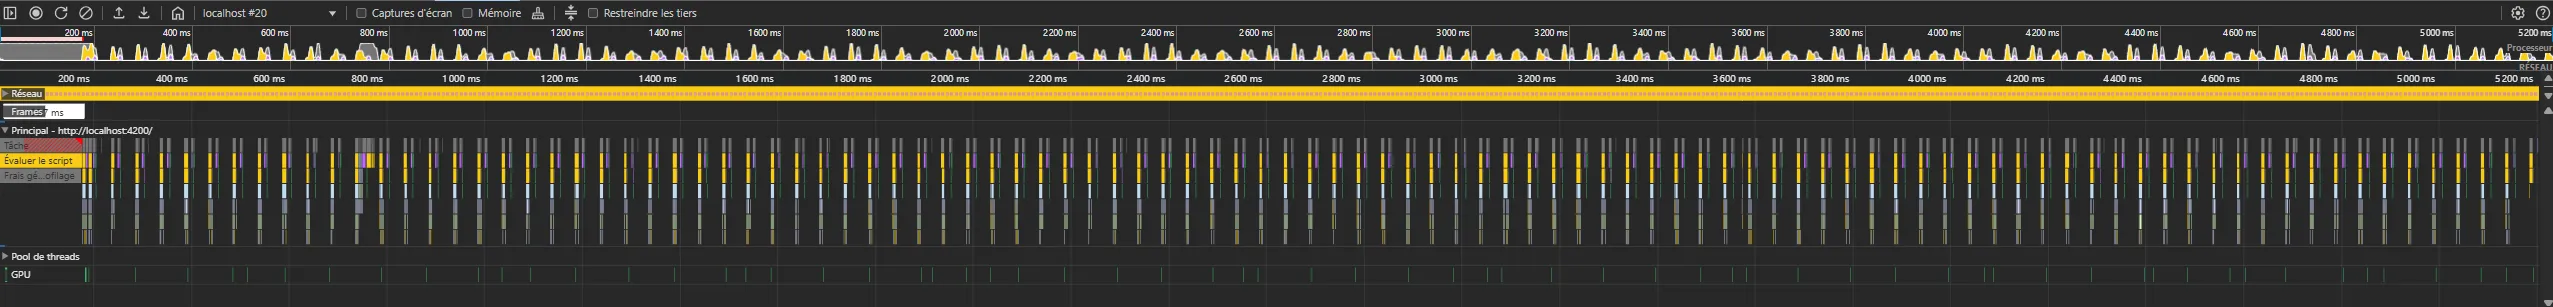
Most of that time is spent on the display side which is completely managed by the browser, meaning we can’t do much except reducing the number of HTML nodes to handle and simplify them to the max.
DOMNodes reduction
There are multiple ways to reduce the number of nodes :
- You can simply decide to add limitations to the data you can display as a feature : mandatory filters, maximum time range, pagination…
- You can implement some technical features that reduce the number of nodes in the DOM at any time such as VirtualScroll solutions
- You can refactor your code to use less HTML nodes, which, in extreme cases like this one could provide significant improvements.
Let’s start with the last one, as it will force us to go deep into the optimization process.
Since the DOM nodes is the number we’re looking to reduce, let’s set back the numbers of products to 100 and see how many we’ve got. For that matter, you can head to the Performance Monitor section in your debugger.
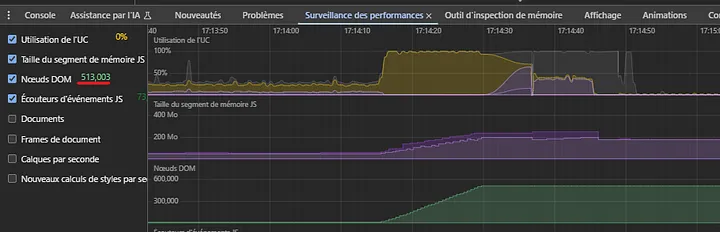
You can see here that we’ve got a monumental 513000 DOM nodes! No doubt it’s heavy to handle for your browser. To understand how we get to such a number, let’s break things down a bit :
- Most of the DOM nodes come from the body of the table
- There are 100 rows over a period of two years which is approximately 365 * 2 * 100 cells = 73000 cells
- Each quantity cell is made of 7 DOM nodes :
30- the td element in itself
- an app-order-cell-element
- a container div
- a quantity div
- a textNode inside the quantity div
- a status div
- an HTML comment added by Angular (you can’t get rid of this one)
If you add this up, 73000 * 7 = 511000 Add to that the few other DOM nodes of the application, and that matches the 513000 DOM nodes that you can see in the Performance monitor.
If we reduce the number of DOM nodes for each quantity cell, it could bring down the number of DOM nodes by hundred of thousands. Then here is what we’re gonna do :
- make the td the OrderCellComponent by changing the CSS selector to td[order]
- remove the container around quantity and status, and just use a CSS class that will change the td border bottom of the cell for the status
- remove the quantity div and directly include the quantity in the td
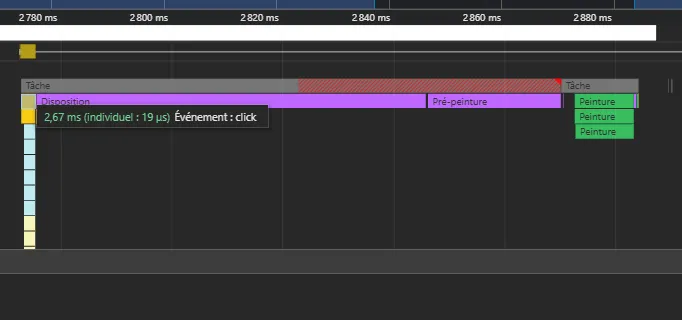
Let’s see how it impacts performances :
- We got down from 513000 DOM nodes to 221000, almost 300K less!
- the 200ms rendering has been reduced by half, under 100ms. Actually, when served in prod mode, clicking a quantity results in a 100ms total time, with only 2.67ms related to the scripting directly related to the click.
Now that the base performance looks pretty solid in harsh conditions, let’s add a filter feature and some real product names to see how it performs with a filter feature.
To keep the performances optimal, I’ve added a throttle time to the definition of the productFilter$ observable :
public productFilter$: Observable = this._filterSubject.pipe(
    throttleTime(300, asyncScheduler, {trailing: true}),
    distinctUntilChanged(),
    tap(filter => this.preferencesService.updateProductFilter(filter))
  );
Let’s use that filtering feature and profile it with the following scenario :
- Starting from the full list, I type “ap” in the filter field
- I toggle on the random modifications
- After a few seconds, I toggle it off
Here are the results :
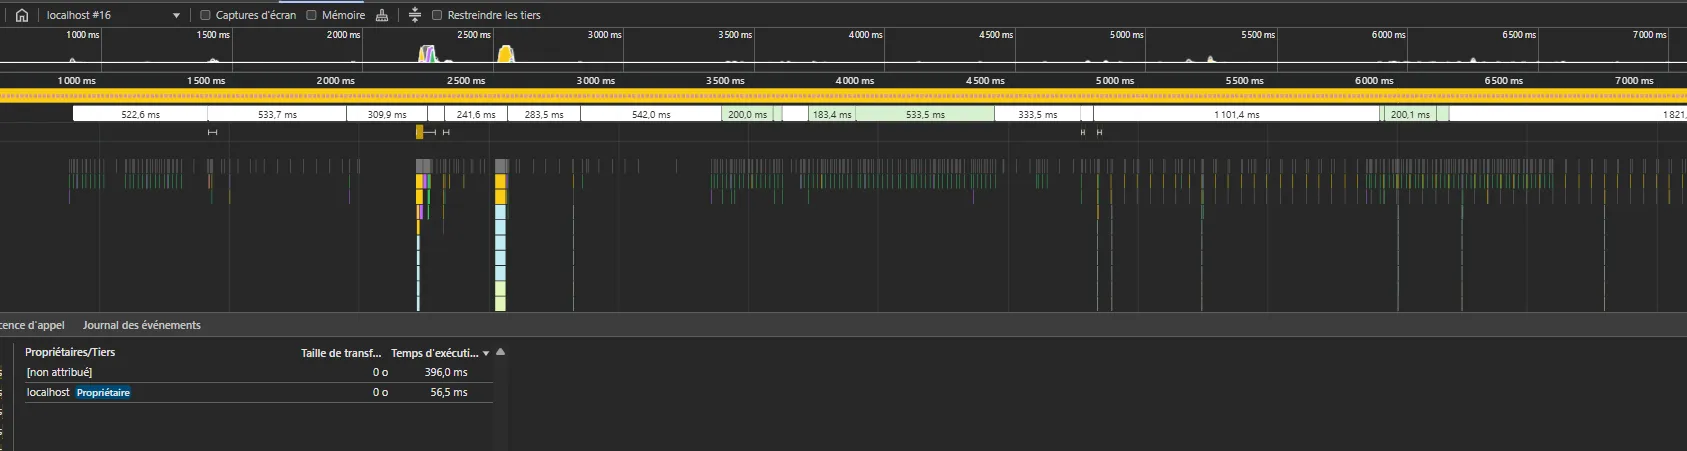
We can notice two things here :
- the filtering of the list is made under 40ms (not shown here, but recreating the whole tree after unfiltering took 500ms)
- the random modifications occurring every 50ms are almost instant : most of them are related to lines that are filtered, which requires no DOM manipulation, the other ones are handled in around 7ms.
Further improvements and general tips about performance optimization
Virtual Scroll
At this point, if you’re still seeing performance issues, it might be because there are still too many elements in the DOM. For example, if you’re not managing tens of thousands of elements but millions, it’s probably a good idea to think about implementing it.
After years of implementing such mechanisms, I tend to avoid it or at least to only use it in last resort. Why ? Because most of the time, the cost and complexity of implementing it isn’t worth the benefit. You can either use existing libraries such as PrimeNG Virtual Scroller, Angular CDK Virtual Scroll or even paying libraries such as ag-grid, but for that you’ll often have to completely rethink your code structure to bend it towards what the library expects (if you doubt about it, try to implement a two dimensional virtual scroll on the current example project, keeping the header and the first column sticky, with one of these libraries without changing the user interface and tell me in the comments how it went). Or you can implement your own virtual scroll mechanism at a low level and handle the DOM management yourself, and good luck in doing it right. Possible, but probably time consuming. In both case, it will incur a significant cost, which has to be balanced by a tremendous difference in performance and user experience.
That being said, if you have that much data to manage in a single view, it could be a good idea to question the underlying need and if your initial hypothesis about how to display it to the user is still valid. Many times, you’ll see that instead of spending countless hours solving very complex technical problems, you can just have a talk with your users and find a solution that best answer their core needs without even needing to solve any technical challenge in the end.
Avoid usual mistakes when debugging performance
Optimize in private mode with all extensions disabled, except for Angular Dev Tools if needed. How many times have I searched for memory issues or performance issues after realizing one hour later (if not more) that it came from an unexpected interaction with a browser’s extension. So don’t make the same mistake I did and save yourself a few hours of debugging for nothing 😉
Preoptimization is bad.
Don’t overoptimize preemptively.
While it might be satisfying as a performance freak to optimize everything by default, to grab any microsecond, it tends to add a non neglectable layer of complexity to your code. It could be harder to reason about and harder to maintain.
If your application manages a small amount of data and components, a normal human wouldn’t see the difference with or without the optimization as it would be fast anyway. It means that if you have preoptimized, the costs incurred by the time you spent doing it and the overhead time of maintenance in the future will just be a waste, just for your own satisfaction.
That’s why the better approach is to code your application in a natural way, by following what’s feel instinctive natural and simple. Then, only when it grows to a point where you start to notice a degradation in the user experience (potentially never), you should start investigating in where the bottlenecks are and how to solve them. That doesn’t mean you shouldn’t take the free optimizations though, if you cultivate good habits like using OnPush change detection by default or use the @for syntax instead of the *ngFor syntax, it doesn’t complexify your code and prevents issues on that side. Like the idiom say : *“make it work make it right make it fast”**, fast is the last step, and maybe your code is already fast enough before you need to make a conscious effort to improve it.
Random tips
NgZone.runOutsideAngular
If you make a heavy use of setTimeout or setInterval, you have to know that Angular, through zone.js has patched these methods so that they automatically trigger change detection. If you want to avoid that, you can run your setTimeout inside NgZone.runOutsideAngular and it won’t trigger change detection.
this.ngZone.runOutsideAngular(() => {
  setTimeout(() => {
    // whatever code that shouldn't need the view to be updated
  }, 1000);
});
That’s even more important in heavy applications (like the one we demonstrated here) where each change detection cycle can lead to a lot of CPU usage.
✅ Key takeaways for Angular performance
- Prefer OnPush change detection and break down large components when needed.
- Use @for with track for better rendering performance.
- Avoid function calls in templates — prefer pure pipes, memoized if needed.
- Move heavy calculations to Web Workers to free the main thread.
- Consider a cache layer (in-memory + IndexedDB) for expensive operations.
- Reduce DOM nodes — even 1 div per row matters when you have thousands!
- Don’t over-optimize prematurely — profile first, fix second.
- Use NgZone.runOutsideAngular() when triggering non-UI-affecting async logic.
- Keep profiling — measure before and after every change.
Conclusion
Optimizing Angular applications, especially under extreme conditions like ours, requires a mix of knowledge, observation, and pragmatism. While not every project needs this level of fine-tuning, knowing what to look for — and how to fix it — is a valuable skill.
I hope this step-by-step walkthrough helped demystify some performance traps and showed you that most performance gains come from a clear understanding of what’s going on behind the scenes.
If you’ve encountered similar performance bottlenecks or want to share other Angular tips, feel free to drop a comment — I’d love to continue the discussion.