TL;DR: This blog guides you in building interactive trading apps with Flutter, emphasizing its high performance, customizability, and cross-platform capabilities. Learn to define data models, implement DataGrid widgets, manage real-time updates, and use visual cues for a better user experience.
Building trading applications requires a robust and interactive DataGrid to display and manage large volumes of data effectively. Traders rely on a seamless and intuitive interface to make quick, informed decisions.
In this blog, we’ll dive into how to create interactive data grids for trading apps using Flutter, ensuring a blend of high performance and usability.
Why choose Flutter for developing trading apps?
Flutter has gained immense popularity for building trading applications due to its speed, flexibility, and cross-platform capabilities. Here are several key reasons why Flutter is an exceptional choice for developing trading apps:
- High performance: Flutter’s widget-based architecture ensures seamless performance, enabling smooth interactions even with data-intensive and complex data grids.
- Customizability: With Flutter, you can design highly customized components to cater to the specific needs of traders, such as real-time data updates and interactive charts.
- Cross-platform deployment: Flutter allows you to build once and deploy across both iOS and Android platforms, saving time and resources while maintaining a consistent user experience.
Let’s dive in and explore!
Building your app environment
Step 1: Define a model class and create its collection
First, design a model class. The stock class functions as a data model representing the attributes of a single stock. This class incorporates fields such as symbol, company name, price, change, changePercentage, volume, marketCap, bid and ask, and time. It serves as the basis for each stock entry shown in the DataGrid.
The RealTimeUpdateDataGridSource class extends from DataGridSource. It acts as the data provider for a DataGrid widget, allowing for real-time tracking of stock information.
Together, the Stock and RealTimeUpdateDataGridSource classes facilitate the creation and management of a real-time data grid filled with stock data. The stock class establishes the framework for each data row, while the RealTimeUpdateDataGridSource initializes the stock data and maps it to DataGridRow objects. The DataGrid widget displays these rows, rendering each stock’s details in a tabular format.
Refer to the following example code.
class Stock {
  Stock(
      this.symbol,
      this.companyName,
      this.price,
      this.change,
      this.changePercentage,
      this.volume,
      this.marketCap,
      this.bid,
      this.ask,
      this.time);

  String symbol;
  String companyName;
  double price;
  double change;
  double changePercentage;
  int volume;
  double marketCap;
  double bid;
  double ask;
  String time;
}

class RealTimeUpdateDataGridSource extends DataGridSource {
  RealTimeUpdateDataGridSource({required this.columns}) {
    _stocks = _fetchStocks();
    _buildDataGridRows();
  }

  List<Stock> _fetchStocks() {
    return [
      Stock(
          'AAPL',
          'Apple',
          157.25,
          -0.32,
          -0.20,
          1200350,
          2.5e12,
          157.20,
          157.30,
          '12:35:45'),
      Stock(
          'MSFT',
          'Microsoft',
          332.10,
          1.50,
          0.45,
          890250,
          2.7e11,
          332.00,
          332.15,
          '12:35:45'),
      Stock(
          'DIS',
          'Disney',
          140.75,
          -1.00,
          -0.71,
          750000,
          250e9,
          140.70,
          140.80,
          '12:35:45'),
    ];
  }

  void _buildDataGridRows() {
    _dataGridRows = _stocks.map<DataGridRow>((Stock stock) {
      return DataGridRow(cells: <DataGridCell>[
        DataGridCell<String>(columnName: 'symbol', value: stock.symbol),
        DataGridCell<String>(columnName: 'companyName', value: stock.companyName),
        DataGridCell<double>(columnName: 'price', value: stock.price),
        DataGridCell<double>(columnName: 'change', value: stock.change),
        DataGridCell<double>(columnName: 'changePercentage', value: stock.changePercentage),
        DataGridCell<int>(columnName: 'volume', value: stock.volume),
        DataGridCell<double>(columnName: 'marketCap', value: stock.marketCap),
        DataGridCell<double>(columnName: 'bid', value: stock.bid),
        DataGridCell<double>(columnName: 'ask', value: stock.ask),
        DataGridCell<String>(columnName: 'time', value: stock.time),
      ]);
    }).toList();
  }
}
Step 2: Create the SfDataGrid with a column
The SfDataGrid is a dynamic widget offered by Syncfusion® designed to create customizable and interactive data grids. It enables developers to present tabular data in an efficient and user-friendly way. The source property links the data grid to the data source.
The _ realTimeUpdateDataGridSource is a custom class (likely extending DataGridSource) responsible for providing the data displayed in the grid and managing real-time data updates, such as modifying rows as new data arrives.
The columns property defines the structure of the grid, specifying what data is displayed in each column and how it is presented. Columns consist of a list of GridColumn objects, with each GridColumn specifying a column name as a unique identifier for each column, which corresponds to a field in your data model, and a label as the header text displayed for the column.
Refer to the following code example.
Widget _buildDataGrid() {
  return Scaffold(
    appBar: AppBar(
      elevation: 0,
      title: Center(child: Text("Trader Grid")),
    ),
    body: SfDataGrid(
      source: _realTimeUpdateDataGridSource,
      columnWidthMode: ColumnWidthMode.fill,
      columns: columns,
    ),
  );
}

List<GridColumn> getColumns() {
  return <GridColumn>[
    GridColumn(
      columnName: 'symbol',
      label: Container(
        padding: EdgeInsets.all(8.0),
        alignment: Alignment.center,
        child: const Text('Symbol'),
      ),
    ),
    GridColumn(
      columnName: 'companyName',
      label: Container(
        padding: EdgeInsets.all(8.0),
        alignment: Alignment.center,
        child: const Text('Company Name'),
      ),
    ),
    GridColumn(
      columnName: 'price',
      label: Container(
        padding: EdgeInsets.all(8.0),
        alignment: Alignment.center,
        child: const Text('Price'),
      ),
    ),
    GridColumn(
      columnName: 'change',
      label: Container(
        padding: EdgeInsets.all(8.0),
        alignment: Alignment.center,
        child: const Text('Change'),
      ),
    ),
    GridColumn(
      columnName: 'changePercentage',
      label: Container(
        padding: EdgeInsets.all(8.0),
        alignment: Alignment.center,
        child: const Text('Change %'),
      ),
    ),
    GridColumn(
      columnName: 'volume',
      label: Container(
        padding: EdgeInsets.all(8.0),
        alignment: Alignment.center,
        child: const Text('Volume'),
      ),
    ),
    GridColumn(
      columnName: 'marketCap',
      label: Container(
        padding: EdgeInsets.all(8.0),
        alignment: Alignment.center,
        child: const Text('Market Cap'),
      ),
    ),
    GridColumn(
      columnName: 'bid',
      label: Container(
        padding: EdgeInsets.all(8.0),
        alignment: Alignment.center,
        child: const Text('Bid'),
      ),
    ),
    GridColumn(
      columnName: 'ask',
      label: Container(
        padding: EdgeInsets.all(8.0),
        alignment: Alignment.center,
        child: const Text('Ask'),
      ),
    ),
    GridColumn(
      columnName: 'time',
      label: Container(
        padding: EdgeInsets.all(8.0),
        alignment: Alignment.center,
        child: const Text('Time'),
      ),
    ),
  ];
}
Step 3: Update data at regular intervals
A periodic timer is established to initiate updates every 800 milliseconds. It invokes the timerTick method with each tick. The timer activates the timerTick method and subsequently calls the _updateStockData() method to refresh the stock data.
The updateDataRow function is responsible for updating individual rows within the DataGrid. It modifies the DataGridCell value in _dataGridRows for a particular column. By dynamically altering the cell values for rows and columns, the DataGrid presents up-to-date stock data in real time.
Refer to the following code example.
@override
void initState() {
  super.initState();
  columns = getColumns();
  _realTimeUpdateDataGridSource =
      RealTimeUpdateDataGridSource(columns: columns);
  _timer = Timer.periodic(const Duration(milliseconds: 800), (Timer args) {
    _realTimeUpdateDataGridSource.timerTick(args);
  });
}

void timerTick(Timer args) {
  _updateStockData();
}

void _updateStockData() {
  // Update the DataGrid rows with formatted values.
  void updateDataRow(int recNo, int colIndex) {
    String columnName = columns[colIndex].columnName;
    final columnMap = {
      'symbol': _stocks[recNo].symbol,
      'companyName': _stocks[recNo].companyName,
      'price': _stocks[recNo].price,
      'change': _stocks[recNo].change,
      'changePercentage': _stocks[recNo].changePercentage,
      'volume': _stocks[recNo].volume,
      'marketCap': _stocks[recNo].marketCap,
      'bid': _stocks[recNo].bid,
      'ask': _stocks[recNo].ask,
      'time': _stocks[recNo].time,
    };
    _dataGridRows[recNo].getCells()[colIndex] = DataGridCell<dynamic>(
        columnName: columnName, value: columnMap[columnName]);
  }
}
Step 4: Implement text color changes for value updates
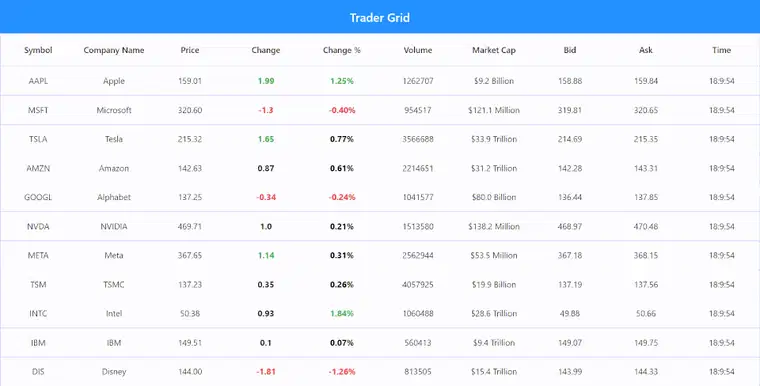
The _buildChangePercentageCell widget is designed to display a value with dynamic text styling that varies according to the value, thus improving visual clarity for positive, negative, or neutral percentages. It adjusts the text color based on the conditions of the value. This enhances the user experience by offering an intuitive, color-coded visual indicator for changes in values, making it easier to quickly identify positive or negative trends in the data.
Refer to the following code example.
Widget _buildChangePercentageCell(double value) {
  return Container(
    padding: EdgeInsets.all(8.0),
    alignment: Alignment.center,
    child: Text(
      '${value.toStringAsFixed(2)}%',
      style: TextStyle(
        color: value < 0
            ? Colors.red
            : value >= 0 && value <= 1
                ? Colors.black
                : Colors.green,
        fontWeight: FontWeight.bold,
      ),
    ),
  );
}
Refer to the following image.

GitHub reference
For more details, refer to the GitHub demo.
Conclusion
Thanks for reading! In this blog, we’ve seen how to create interactive Data Grids for trading apps in Flutter. We hope you find the outlined steps helpful in achieving similar results.
If you’re an existing customer, you can download the latest version of Essential Studio® from the License and Downloads page. For those new to Syncfusion®, try our 30-day free trial to explore all our features.
If you have questions, contact us through our support forum, support portal, or feedback portal. As always, we are happy to assist you!
Related Blogs
- Create a Student–Tutor Booking App with Flutter Calendar – A Step-by-Step Guide
- Flutter Developers, Meet AI: Smart, Fast PDF Form Filling
- Visualizing Global Coal Consumption Trends with Our Flutter Stacked Area Chart
- What’s New in 2025 Volume 1: Flutter
This article was originally published at Syncfusion.com.