
If you have a real-time dashboard in your application or plan on building one, you can improve it with LLMs. There are a ton of ways to add AI features to your real-time dashboards, but here, I'm going to focus on filtering.
You know what a dashboard filter is: the little pills, checkboxes, and dropdowns you can click to filter the results. A proper real-time dashboard will update to show filtered results almost immediately.
But let's say you have a lot of filter dimensions. Sidebars and filter drawers get clunky in this case. Better to just have a single text input. Pass the input to an LLM, and have it generate the filters, like this:
Here's how you build that, step-by-step:
Context, data, and prerequisites
Before I dive into the implementation, let's set the context. We are going to build a dashboard filter component that:
- Uses an LLM to parse a free-text user input and apply filters to a real-time dashboard
- Refreshes the dashboard very quickly
- Filters performantly even when the underlying dataset becomes very large
- Can handle large sets of dimensions with high cardinality
For this tutorial, I'm riffing on this open source LLM Performance Tracker template by Tinybird, which includes a natural language filter feature (see the video above).
The underlying data for this dashboard has the following schema:
DESCRIPTION >
    'Store LLM events with usage metrics, costs, and metadata'

SCHEMA >
    `timestamp` DateTime `json:$.start_time`,
    `organization` String `json:$.proxy_metadata.organization` DEFAULT '',
    `project` String `json:$.proxy_metadata.project` DEFAULT '',
    `environment` String `json:$.proxy_metadata.environment` DEFAULT '',
    `user` String `json:$.user` DEFAULT 'unknown',
    `chat_id` String `json:$.proxy_metadata.chat_id` DEFAULT '',
    `message_id` String `json:$.message_id`,
    `model` LowCardinality(String) `json:$.model` DEFAULT 'unknown',
    `prompt_tokens` UInt16 `json:$.response.usage.prompt_tokens` DEFAULT 0,
    `completion_tokens` UInt16 `json:$.response.usage.completion_tokens` DEFAULT 0,
    `total_tokens` UInt16 `json:$.response.usage.total_tokens` DEFAULT 0,
    `response_time` Float32 `json:$.standard_logging_object_response_time` DEFAULT 0,
    `duration` Float32 `json:$.duration` DEFAULT 0,
    `cost` Float32 `json:$.cost` DEFAULT 0,
    `exception` String `json:$.exception` DEFAULT '',
    `traceback` String `json:$.traceback` DEFAULT '',
    `response_status` LowCardinality(String) `json:$.standard_logging_object_status` DEFAULT 'unknown',
    `messages` Array(Map(String, String)) `json:$.messages[:]` DEFAULT [],
    `response_choices` Array(String) `json:$.response.choices[:]` DEFAULT [],
    `proxy_metadata` String `json:$.proxy_metadata` DEFAULT '',
    `provider` LowCardinality(String) `json:$.provider` DEFAULT 'unknown',
    `llm_api_duration_ms` Float32 `json:$.llm_api_duration_ms` DEFAULT 0,
    `end_time` DateTime `json:$.end_time`,
    `id` String `json:$.id` DEFAULT '',
    `stream` Bool `json:$.stream` DEFAULT false,
    `call_type` LowCardinality(String) `json:$.call_type` DEFAULT 'unknown',
    `api_key` String `json:$.api_key` DEFAULT '',
    `log_event_type` LowCardinality(String) `json:$.log_event_type` DEFAULT 'unknown',
    `cache_hit` Bool `json:$.cache_hit` DEFAULT false,
    `response` String `json:$.response` DEFAULT '',
    `response_id` String `json:$.response.id`,
    `response_object` String `json:$.response.object` DEFAULT 'unknown',
    `embedding` Array(Float32) `json:$.embedding[:]` DEFAULT []

ENGINE "MergeTree"
ENGINE_PARTITION_KEY "toYYYYMM(timestamp)"
ENGINE_SORTING_KEY "timestamp, organization, project, environment, user, chat_id"
ENGINE_PRIMARY_KEY "timestamp, organization, project"
You can see it's storing a bunch of performance and metadata for LLM call events. As of the time I wrote this, the live demo of the app had X rows of data (and counting).
The demo app allows you to select values for the following filter dimensions:
- model
- provider
- organization
- project
- environment
When you click a specific model, for example, the dashboard will update to only show metrics for that model.
Prerequisites
I'm going to assume that you already have a dashboard you want to filter, so you can apply these steps generally to your use case. If you want to create a quick data project to follow along, use these commands to bootstrap something quick with Tinybird:
curl -L tinybird.co | sh
tb login
tb local start
tb create --prompt "Create a datasource called llm_events to store time series events from LLM calls. Include columns for model, provider, organization, project, environment, and user, as well as other metrics related to LLM calls like cost, duration, prompt tokens, completion tokens, etc. Also create an API endpoint to show costs over time filterable by model, provider, organization, project, environment, user, and time range"
tb deploy
tb mock llm_events --rows 100000
That will deploy a basic Tinybird datasource and API endpoint on your local machine with 100,000 rows of data for testing.
Now, let's see how to replace "click-to-filter" with "prompt-to-filter"...
Step 1. Review your API
I'm assuming that you have an API route for your real-time dashboard that can accept various parameters to request filtered data to visualize in the dashboard. Something like this:
https://api.tinybird.co/v0/pipes/llm_usage.json?model=gpt-3.5-turbo&environment=production&start_date=2025-01-01&end_date=2025-03-31In Tinybird, for example, any SQL pipe you build is automatically deployed as a REST endpoint with optional query parameters.
My Tinybird API definition looks like this:
TOKEN "read_pipes" READ

NODE endpoint
SQL >
    %
    {% if defined(column_name) and column_name not in ['model', 'provider', 'organization', 'project', 'environment', 'user'] %}
        {{ error('column_name (String) query param must be one of the following: model, provider, organization, project, environment, user') }}
    {% end %}
    SELECT
        toDate(timestamp) as date,
        {% if defined(column_name) %}
            toString({{column(column_name, 'model')}}) as category,
        {% end %}
        count() as total_requests,
        countIf(exception != '') as total_errors,
        sum(total_tokens) as total_tokens,
        sum(completion_tokens) as total_completion_tokens,
        sum(prompt_tokens) as total_prompt_tokens,
        sum(cost) as total_cost,
        avg(duration) as avg_duration,
        avg(response_time) as avg_response_time
    FROM llm_events
    WHERE 1
        {% if defined(organization) and organization != [''] %}
        AND organization IN {{Array(organization)}}
        {% end %}
        {% if defined(project) and project != [''] %}
        AND project IN {{Array(project)}}
        {% end %}
        {% if defined(environment) and environment != [''] %}
        AND environment IN {{Array(environment)}}
        {% end %}
        {% if defined(provider) and provider != [''] %}
        AND provider IN {{Array(provider)}}
        {% end %}
        {% if defined(user) and user != [''] %}
        AND user IN {{Array(user)}}
        {% end %}
        {% if defined(model) and model != [''] %}
        AND model IN {{Array(model)}}
        {% end %}
        {% if defined(start_date) %}
        AND timestamp >= {{DateTime(start_date)}}
        {% else %}
        AND timestamp >= now() - interval 7 day
        {% end %}
        {% if defined(end_date) %}
        AND timestamp < {{DateTime(end_date)}}
        {% else %}
        AND timestamp < now()
        {% end %}
    GROUP BY
    {% if defined(column_name) %}
    category,
    {% end %}
    date
    order by total_cost desc

TYPE endpoint
A quick summary of this API:
- It uses Tinybird's pipe syntax, defining a single SQL node to select from the
llm_eventstable. - It returns time series aggregations, grouped by
dateandcategory, of various LLM call metrics such as errors, total tokens, completion tokens, duration, and cost. - It accepts a
columnparameter that defines the grouping category (e.g., model, provider, etc.) - It accepts many filter parameters (e.g.
organization,project,model) which are conditionally applied in theWHEREclause if they are passed. - These parameters are defined using Tinybird's templating language.
So I can pass a value for any of these filter parameters, and Tinybird will query the database for data that matches those filters and return the response as a JSON payload that I can use to hydrate my chart.
In the past, I'd create a UI component in my dashboard to allow a user to select those filters. Here, we're using AI.
Step 2. Create an LLM filter API route
To start building your natural language filter, you need a POST route handler to accept the user prompt and return structured filter parameters.
The API route should implement the following logic:
- Accept a JSON payload with
promptand (optionally)apiKeyfields (if you want the user to supply their own AI API key) - Fetches the available dimensions for filtering
- Define a system prompt to guide the LLM in creating structure parameters for the response
- Queries an LLM client with the API key, system prompt, and user prompt
- Returns the LLM response (which should be a structured filter object as JSON)
- Error handling, of course
If you want to see a full implementation of such an API route, just look at this. If you want step-by-step guidance, follow along.
Step 3. Define the system prompt
Perhaps the most important part of this is creating a good system prompt for the LLM. The goal is to have an LLM client that will accept user input and consistently output structured query parameters to pass to your dashboard API.
Here's a simple but effective system prompt example:
const systemPromptText = "You are a filter parser for an analytics dashboard. \
Convert natural language into filter key-value pairs. \
Available dimensions: model, provider, organization, project, environment \
Return only valid values from the provided dimensions, fix typos when necessary.";
You could further extend this system prompt by passing available dimensions and example values. To make this work, you can query the underlying data. A Tinybird API works well for this:
NODE llm_dimensions_node
SQL >
%
  SELECT
      groupUniqArray(organization) as organizations,
      groupUniqArray(project) as project,
      groupUniqArray(environment) as environment,
      groupUniqArray(model) as model,
      groupUniqArray(provider) as provider
  FROM
  (
      SELECT organization, project, environment, model, provider
      FROM llm_events
      WHERE timestamp > now() - interval '1 month'
  )

TYPE endpoint
This queries the underlying dataset (latest month of data) and returns an array of possible values for each of the five filter dimensions defined in the API.
This API can be used to show the LLM what is available.
You could create a little utility to fetch the dimensions and unique values:
export const fetchAvailableDimensions = async (token: string | null, apiUrl: string | null) => {
    const url = `${apiUrl}/v0/pipes/llm_dimensions.json`;
    const response = await fetch(url, {
      headers: {
        Authorization: `Bearer ${token}`,
      },
    });

    const data = await response.json();
    return data;
};
And then call that to define the system prompt dynamically:
const systemPromptText = `You are a filter parser for an analytics dashboard.
Convert natural language into filter key-value pairs.
Available dimensions: ${Object.keys(availableDimensions?.data?.[0] || {}).join(', ')}.
Common values: ${JSON.stringify(availableDimensions?.data?.[0] || {}, null, 2)}.
Return only valid values from the provided dimensions, fix typos when necessary.`;
Step 4. Create the LLM client
Once you've defined a good system prompt, it's as simple as creating an LLM client in the API route and passing the system prompt + prompt.
For example:
import OpenAI from 'openai';

// Create standard OpenAI client
const openai = new OpenAI({ apiKey: apiKey });

const result = await generateObject({
  model: async ({ messages }) => {
    const response = await openai.chat.completions.create({
      model: 'gpt-3.5-turbo',
      messages: messages,
      temperature: 0.1, // Lower temperature for more deterministic outputs when parsing
    });

    return {
      id: response.id,
      choices: [{
        index: 0,
        message: response.choices[0].message,
        finish_reason: response.choices[0].finish_reason
      }]
    };
  },
  schema: filterSchema,
  prompt,
  systemPrompt: systemPromptText,
});
Step 5. Capture and pass the user prompt
I'm not going to share how to build a UI input component to capture the user prompt. It's 2025, and any LLM can 1-shot that component for you.
But the idea here is that your API route should accept the prompt input when the user submits the input.
For example, here's a basic way to call the LLM filter API route (/search) within a function triggered by an Enter key event handler:
const handleSearch = async (e: React.KeyboardEvent) => {
  if (e.key === 'Enter') {
    const input = e.currentTarget.value;
    try {
      const response = await fetch('/api/search', {
        method: 'POST',
        headers: {
          'Content-Type': 'application/json',
          'x-custom-tinybird-token': token || '',
          'x-custom-tinybird-api-url': apiUrl || '',
        },
        body: JSON.stringify({ prompt: input, apiKey: openaiKey }),
      });

      if (!response.ok) {
        const errorData = await response.json().catch(() => ({}));
        throw new Error(errorData.message || `API error: ${response.status}`);
      }
    } catch (error) {
          console.error('Search error:', error);
          alert('Failed to process your search. Please try again.');
    }
  }
}
Step 6. Update the filters based on the API response
After you've passed your user input to the LLM and gotten a response from the API route, you just need to fetch your dashboard API with the new set of filter parameters.
For example, taking the response from the above handleSearch function:
const filters = await response.json();

// import { useSearchParams, useRouter } from 'next/navigation';
const params = new URLSearchParams(searchParams.toString());

// Process each filter from the AI response
Object.entries(filters).forEach(([key, value]) => {
  if (!value) return; // Skip empty values
  params.set(key, value as string);
});

// Update the URL with new filters
const newUrl = `?${params.toString()}`;
router.push(newUrl);
In this case, we add the new filter params to the URL of the dashboard and use the useSearchParams hook in the chart components, updating each chart with the applied search params.
Step 7. Test it
So far, we have:
- Created an API route that accepts a user input, passes it to an LLM with a system prompt, and returns a structured filter JSON
- Added a user input component that passes the prompt to the API route
- Updated the filter parameters in the URL search params based on the API response
So, looking back at the data model, let's imagine we used the following text input:
show only openai calls in productionThe search API should return something like this:
{
    "provider": "openai",
    "environment": "production"
}
Which would update the URL of the dashboard to:
https://llm-tracker.tinybird.live?provider=openai&environment=production...Which would trigger a new fetch of the Tinybird API for our time series chart:
https://api.tinybird.co/v0/pipes/llm_usage.json?provider=openai&environment=production...Giving us an API response that looks something like this:
{
        ...,

    "data":
    [
        {
            "date": "2025-03-13",
            "category": "gpt-4",
            "total_requests": 15,
            "total_errors": 7,
            "total_tokens": 12073,
            "total_completion_tokens": 7854,
            "total_prompt_tokens": 4219,
            "total_cost": 0.5978100039064884,
            "avg_duration": 2.8267999927202863,
            "avg_response_time": 0.06600000113248825
        },
        …
    ],

    "rows": 62,
    "statistics":
    {
        "elapsed": 0.007343623,
        "rows_read": 5104,
        "bytes_read": 302264
    }
}
Which we can use to hydrate the chart. Boom.
Performance
A real-time dashboard should filter quickly. With a typical click-to-filter approach, we don't need to worry about the LLM response. In fact, if you look at the statistics from the Tinybird API response above, you can see the filtered query took just 7 ms, querying about 5000 rows.
Of course, as events grow into the millions or billions, we might expect some performance degradation there, but there are plenty of strategies in Tinybird to maintain sub-second query response times even as data becomes massive. This is the benefit of using Tinybird.
As far as the LLM response, you can query the underlying Tinybird table to see how long the LLM takes to respond, on average:
SELECT avg(duration)
FROM llm_events
WHERE user_id = {{String(your_user_id)}}
By the way, the LLM Performance Tracker template on which I based this tutorial actually includes a filter selection to analyze your own LLM calls within the dashboard, which we can use to see this in action:
In my case, the LLM typically took under a second to respond. Taking a look at the network waterfall, I could see the actual response time of the /search API route, for example:
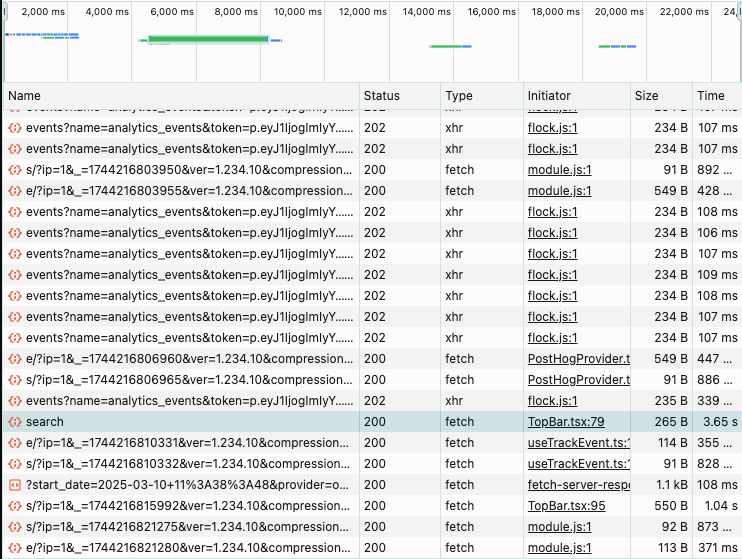
In this particular case, the response was under 4 seconds. To be honest, that's not ideal for a real-time dashboard, but it's something that can be difficult to control when using a remote LLM.
To further improve the performance, you could consider something like WebLLM to run the LLM in the browser to perform this simple task. Cutting down on network times could improve performance significantly.
Conclusion
The way we search and visualize data is changing a lot thanks to AI. There are a lot of AI features you can add to your application, and a simple one I've shown here is natural language filtering of real-time analytics dashboards.
If you'd like to see a complete example implementation of natural language filtering, check out the LLM Performance Tracker by Tinybird. It's an open source template to monitor LLM usage, and it includes (as I have shown here) a feature to enable natural language filtering on LLM call data.
You can use it as a reference for your own natural language filtering project, or fork it to deploy your own LLM tracker, or just use the hosted public version if you want to track LLM usage in your application.
For example:
# install the tinybird CLI
curl https://tinybird.co | sh

# select or create a new workspace
tb login

# deploy the template
tb --cloud deploy --template https://github.com/tinybirdco/llm-performance-tracker/tree/main/tinybird

# copy the token to the clipboard
tb --cloud token copy read_pipes && TINYBIRD_TOKEN=$(pbpaste)

# use the hosted dashboard with your data
open https://llm-tracker.tinybird.live\?token\=$TINYBIRD_TOKEN
Alternatively, check out Dub.co, an open source shortlink platform. They have a nice "Ask AI" that you can use for reference. Here's the repo.
