Imagine walking into a trading floor that runs itself. Analysts don’t sleep, they never get tired, and they learn from their mistakes. Sounds sci-fi? Not anymore.
In this post, we’ll build a RAG-powered, self-improving AI trading department using:
- gemini-2.0-flash for intelligent reasoning in our Agents
- LangGraph for orchestrating multi-agent workflows
- RAG (Retrieval-Augmented Generation) for continuous self-refinement
It’s fun, modular, and actually gets smarter with each trading day.
💻 Full Code Available: Check it out on Kaggle
🔁 What Does "Self-Improving" Mean?
Let agents reflect on their past decisions and evolve their logic using memory and retrieval.
Here’s the loop:
- Each day, agents analyze the market and make predictions.
- Their reasoning and decisions are stored.
- The next day, a coach agent reviews their past predictions and results.
- RAG retrieves key insights from previous decisions to guide current ones.
- A manager agent aggregates everyone’s output into a final plan.
The system writes its own playbook, learns from wins and losses, and evolves every single day.
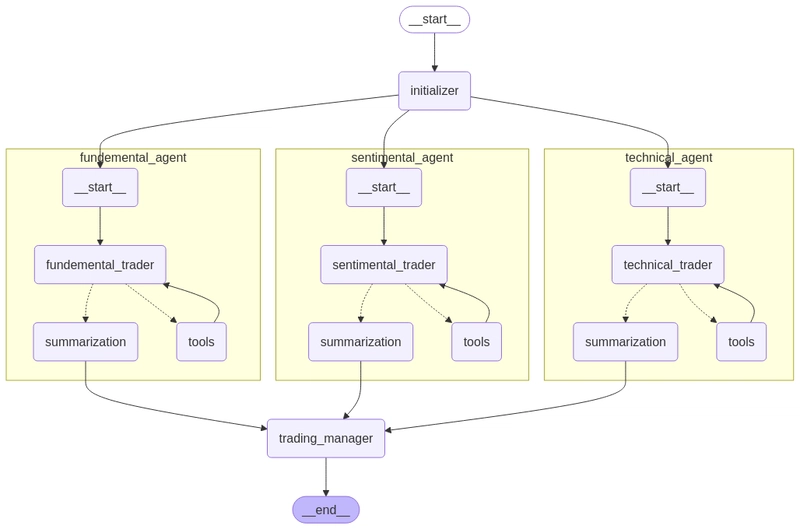
🌐 Architecture Overview

Agents Breakdown:
- 🧮 Fundamental Analyst – Evaluates financial metrics and macro context
- 📉 Technical Analyst – Uses indicators like RSI, MACD to predict trends
- 💬 Sentiment Analyst – Gathers news and social sentiment data
- 👁️ Initiator – Kicks off the day, feeds prior lessons into the agents
- 🧠 Manager – Integrates all decisions into a coherent strategy
Each agent runs independently, but all leverage shared memory through RAG.
🧠 Setting Up Memory: The RAG Knowledge Base
Agents need memory. So we use ChromaDB to store and retrieve insights as the agents learn.
# create a knowledge base for retrieval
def create_knowledge_base(df: pd.DataFrame):

    embedding_function = SentenceTransformerEmbeddingFunction(model_name="all-MiniLM-L6-v2")

    documents = df["tip"].astype(str).tolist()
    ids = [str(i) for i in range(len(documents))]
    metadatas = [{"audiance": aud} for aud in df["audiance"]]

    chroma_client = chromadb.PersistentClient(path="./chromadb")

    # Safely remove existing collection
    if "knowledge_base" in chroma_client.list_collections():
        chroma_client.delete_collection("knowledge_base")

    collection = chroma_client.create_collection(
        name="knowledge_base",
        embedding_function=embedding_function
    )

    collection.add(documents=documents, metadatas=metadatas, ids=ids)
    return collection
Each tip is tagged by which agent it’s for.
On the next run, agents retrieve their relevant lessons via RAG.
You can define a helper function like:
# query the knowledge base
def query_knowledge_base(query: str, knowledge_base, audiance: str = None, top_n: int = 10):
    where_filter = {"audiance": audiance} if audiance else None
    results = knowledge_base.query(query_texts=[query], n_results=top_n, where=where_filter)
    return results["documents"][0]
🤖 Analyst Agents: The Intelligence Units
Each analyst is a LangGraph subgraph with this flow:
- Pull domain-specific data (fundamentals, tech indicators, or sentiment)
- Query the RAG memory for insights
- Prompt an LLM for reasoning and predictions
- Return:
- Observation
- Chain-of-Logic
- Decision
🧮 Fundamental Analyst
Analyzes stock based on financial data, options sentiment, and macro conditions.
# fundemental agent Graph

### options data
def options_insights(state: Annotated[dict, InjectedState]) -> Dict:
    """
    Retrieves the nearest available options chain data for the ticker you want,
    calculates various implied volatility (IV) statistics and open interest ratios, then returns them as a dictionary.

    This function is **not historical**: it fetches the **current day's** options data and:
      1. Finds the at-the-money (ATM) strike (closest to the stock's last closing price).
      2. Computes average implied volatility across **all** calls and puts.
      3. Calculates the implied volatility for:
         - ATM calls and puts.
         - An out-of-the-money (OTM) put (just below the ATM strike).
         - An out-of-the-money (OTM) call (just above the ATM strike).
      4. Derives "put skew" and "call skew" — the percentage difference between OTM vs. ATM IV.
      5. Extracts total open interest (calls vs. puts) and computes:
         - Open Interest Ratio (OIR) = (Call OI) / (Put OI)
         - Put/Call Ratio (PCR) = (Put OI) / (Call OI)

    Parameters
    ----------
    NO PARAMETERS

    Returns
    -------
    Dict
        A dictionary containing:
        - 'ticker': The actual yfinance.Ticker object.
        - 'atm_strike': The at-the-money strike price used for calculations.
        - 'otm_put_strike': The out-of-the-money put strike below the ATM strike.
        - 'otm_call_strike': The out-of-the-money call strike above the ATM strike.
        - 'otm_put_implied_volatility': Implied vol of the OTM put (rounded).
        - 'otm_call_implied_volatility': Implied vol of the OTM call (rounded).
        - 'put_skew': Percentage difference between OTM put IV and ATM put IV.
        - 'call_skew': Percentage difference between OTM call IV and ATM call IV.
        - 'average_implied_volatility': Mean implied volatility of all calls/puts.
        - 'call_open_interest': Summed open interest of all call contracts.
        - 'put_open_interest': Summed open interest of all put contracts.
        - 'open_interest_ratio': (Call OI) / (Put OI).
        - 'put_call_ratio': (Put OI) / (Call OI).

    """

    ticker = yf.Ticker(state['ticker'])

    # Pick expiration closest to the current date
    options = ticker.option_chain(ticker.options[0])  # Closest available

    # Stock's last closing price
    stock_price = ticker.history(period="1d")['Close'].iloc[-1]

    # Extract implied volatilities
    call_iv = options.calls['impliedVolatility'].dropna()
    put_iv = options.puts['impliedVolatility'].dropna()

    # Average IV across all calls/puts
    average_iv = np.mean(np.concatenate([call_iv, put_iv]))

    # Find at-the-money (ATM) strike
    atm_strike = options.calls['strike'].iloc[
        (options.calls['strike'] - stock_price).abs().argsort()[:1]
    ].values[0]

    # IV for ATM calls and puts
    atm_call_iv = options.calls[options.calls['strike'] == atm_strike]['impliedVolatility'].values[0]
    atm_put_iv = options.puts[options.puts['strike'] == atm_strike]['impliedVolatility'].values[0]

    # OTM put/call strikes
    otm_put_strike = options.puts['strike'][options.puts['strike'] < atm_strike].max()
    otm_call_strike = options.calls['strike'][options.calls['strike'] > atm_strike].min()

    # OTM put/call implied volatility
    otm_put_iv = options.puts[options.puts['strike'] == otm_put_strike]['impliedVolatility'].values[0]
    otm_call_iv = options.calls[options.calls['strike'] == otm_call_strike]['impliedVolatility'].values[0]

    # Skew calculations
    put_skew = ((otm_put_iv - atm_put_iv) / atm_put_iv) * 100
    call_skew = ((otm_call_iv - atm_call_iv) / atm_call_iv) * 100

    # Open interest
    call_oi = options.calls['openInterest'].sum()
    put_oi = options.puts['openInterest'].sum()

    # Ratios
    oi_ratio = call_oi / put_oi if put_oi > 0 else np.nan
    pcr = put_oi / call_oi if call_oi > 0 else np.nan

    return {
        "ticker": ticker,
        "atm_strike": float(atm_strike),
        "otm_put_strike": float(otm_put_strike),
        "otm_call_strike": float(otm_call_strike),
        "otm_put_implied_volatility": round(float(otm_put_iv), 4),
        "otm_call_implied_volatility": round(float(otm_call_iv), 4),
        "put_skew": round(float(put_skew), 2),
        "call_skew": round(float(call_skew), 2),
        "average_implied_volatility": round(float(average_iv), 4),
        "call_open_interest": int(call_oi),
        "put_open_interest": int(put_oi),
        "open_interest_ratio": round(float(oi_ratio), 2) if oi_ratio is not None else None,
        "put_call_ratio": round(float(pcr), 2) if pcr is not None else None
    }

### fundemental data
def get_daily_fundamentals(state: Annotated[dict, InjectedState], n_days: int = 5) -> List:
    """
    Fetches daily price-based fundamental metrics for the stock you want over the last `n_days`.

    This function focuses on fundamentals that can change day-to-day due to stock price fluctuations.
    Specifically, it computes the following columns:

    1. Date          : The calendar date of each trading day.
    2. Close         : The daily closing price.
    3. MarketCap     : Market Capitalization = (Close * sharesOutstanding).
    4. PE            : Price-to-Earnings (Trailing) = (Close / trailingEps).
    5. PS            : Price-to-Sales (Trailing) = (MarketCap / totalRevenue).
    6. PB            : Price-to-Book (Trailing) = (Close / bookValue).
    7. DividendYield : Trailing annual dividend yield as a percentage.

    Parameters:
    - n_days (int): How many calendar days of daily data to retrieve (default is 5).

    Returns:
    - pd.DataFrame: A pandas DataFrame with columns:
        ["Date", "Close", "MarketCap", "PE", "PS", "PB", "DividendYield"]
      containing daily fundamental metrics for the given ticker.
    """
    ticker = yf.Ticker(state['ticker'])

    info = ticker.info
    trailing_eps = info.get("trailingEps", None)
    # Use totalRevenue here:
    trailing_revenue = info.get("totalRevenue", None)  # Instead of 'revenue'
    trailing_div = info.get("trailingAnnualDividendRate", 0.0)
    book_value_per_share = info.get("bookValue", None)
    shares_outstanding = info.get("sharesOutstanding", None)

    # Price history for last n_days
    df_price = ticker.history(period=f"{n_days}d")
    if df_price.empty:
        raise ValueError(f"No price data found for {state['ticker']} in last {n_days} days.")

    fundamentals_df = pd.DataFrame()
    fundamentals_df["Date"] = df_price.index.date
    fundamentals_df["Close"] = df_price["Close"].values

    market_caps, pes, pss, pbs, div_yields = [], [], [], [], []

    for idx, row in df_price.iterrows():
        close_price = row["Close"]

        # Market Cap
        mc = close_price * shares_outstanding if shares_outstanding else None

        # P/E
        pe = (close_price / trailing_eps) if (trailing_eps and trailing_eps != 0) else None

        # P/S = MarketCap / totalRevenue
        ps = None
        if mc and trailing_revenue and trailing_revenue != 0:
            ps = mc / trailing_revenue

        # P/B
        pb = (close_price / book_value_per_share) if (book_value_per_share and book_value_per_share != 0) else None

        # Dividend Yield (%)
        div_yield = ((trailing_div / close_price) * 100.0) if close_price else None

        market_caps.append(mc)
        pes.append(pe)
        pss.append(ps)
        pbs.append(pb)
        div_yields.append(div_yield)

    fundamentals_df["MarketCap"] = market_caps
    fundamentals_df["price_to_earnings"] = pes
    fundamentals_df["price_to_sales"] = pss
    fundamentals_df["price_to_book_value"] = pbs
    fundamentals_df["DividendYield"] = div_yields
    data = fundamentals_df.reset_index(drop=True).round(3)
    result = data.to_dict(orient='records')
    return result

### sector specific metrics with historc data
def get_market_and_sector_insights(state: Annotated[dict, InjectedState], n_days: int = 5) -> List:
    """
    Fetch daily performance data for:
      1) The ticker_symbol you want
      2) Its sector ETF (e.g. 'XLK' for Tech)
      3) A set of known competitors (from COMPETITOR_MAP)
      4) A broad market index (e.g. 'SPY')

    Parameters
    ----------
    n_days : int
        The number of calendar days of daily data to fetch (default=5).

    """
    # Map each sector to a typical Sector ETF (can be expanded/updated).
    SECTOR_ETF_MAP = {
        "Technology": "XLK",
        "Consumer Cyclical": "XLY",
        "Healthcare": "XLV",
        "Financial Services": "XLF",
        "Communication Services": "XLC",
        # ... etc. fallback to SPY if unknown
    }

    # Simple competitor sets for demonstration
    COMPETITOR_MAP = {
        "AAPL": ["MSFT", "GOOG", "AMZN"],  # Apple -> Some big tech peers
        "MSFT": ["AAPL", "GOOG", "AMZN"],
        "TSLA": ["GM", "F"],
        # etc.
    }

    # Broad market index for final comparison (e.g. S&P 500)
    MARKET_INDEX = "SPY"

    # 1) Identify the company's sector & gather basic info
    ticker_obj = yf.Ticker(state['ticker'])
    info = ticker_obj.info or {}
    sector = info.get("sector", None)
    shares_out = info.get("sharesOutstanding", 0)

    # 2) Determine which Sector ETF to use
    if sector in SECTOR_ETF_MAP:
        sector_etf_symbol = SECTOR_ETF_MAP[sector]
    else:
        sector_etf_symbol = MARKET_INDEX  # fallback if unknown sector

    # 3) Identify competitor symbols, if any
    competitor_symbols = COMPETITOR_MAP.get(state['ticker'], [])

    # 4) We'll build up a list of data rows, then convert to a DataFrame.
    data_rows: List[Dict[str, Any]] = []

    # Helper function to fetch daily data from yfinance
    def fetch_daily(symbol: str, entity_type: str, days: int = 7, compute_mcap: bool = False):
        t = yf.Ticker(symbol)
        t_info = t.info or {}
        so = t_info.get("sharesOutstanding", 0)
        df_hist = t.history(period=f"{days}d")
        if df_hist.empty:
            return []

        rows = []
        for dt, row in df_hist.iterrows():
            close_px = float(row["Close"])
            mcap = None
            # If we want to compute market cap for stock or competitor
            if compute_mcap and so:
                mcap = close_px * so
            rows.append({
                "Date": str(dt.date()),
                "Symbol": symbol,
                "EntityType": entity_type,
                "Close": close_px,
                "MarketCap": mcap
            })

        return rows

    # Fetch daily data for the main stock
    stock_rows = fetch_daily(state['ticker'], "stock", n_days, compute_mcap=True)
    data_rows.extend(stock_rows)

    # Fetch daily data for the sector ETF
    sector_rows = fetch_daily(sector_etf_symbol, "sector_etf", n_days, compute_mcap=False)
    data_rows.extend(sector_rows)

    # Fetch daily data for each competitor
    for comp_sym in competitor_symbols:
        comp_rows = fetch_daily(comp_sym, "competitor", n_days, compute_mcap=True)
        data_rows.extend(comp_rows)

    # Finally, fetch daily data for the broad market index
    market_rows = fetch_daily(MARKET_INDEX, "market_index", n_days, compute_mcap=False)
    data_rows.extend(market_rows)

    # 5) Convert to a DataFrame
    df = pd.DataFrame(data_rows)

    # Create dynamic column names for each (Symbol, Metric) combo
    pivot_close = df.pivot(index="Date", columns="Symbol", values="Close").add_suffix("_Close")
    pivot_mcap = df.pivot(index="Date", columns="Symbol", values="MarketCap").add_suffix("_MarketCap")

    # Combine them side-by-side
    df_wide = pd.concat([pivot_close, pivot_mcap], axis=1).sort_index(axis=1)
    # (Optional) Sort by Date -> Symbol
    data = df_wide.sort_values(by=["Date"], ignore_index=True).round(3)
    result = data.to_dict(orient='records')
    return result


fundemental_tools = [get_market_and_sector_insights, get_daily_fundamentals, options_insights]
# Initialize the LLM agent
fundemental_llm = ChatGoogleGenerativeAI(
    model="gemini-2.0-flash"
)
fundemental_llm_with_tools = fundemental_llm.bind_tools(fundemental_tools)
# System message
fundemental_msg = (
    'system',"""
    You are a Fundemental Trader.
    your Job is to Predict the Trend for the upcoming Trading day and given Ticker:
    1 - analyze the market based on Market and sector movements
    2 - analyze the companies fundemental metrics.
    3 - analyze the options data and implied volatility to get a sens of what are the predictions of the market.
    4 - make observations first sololey based on each factor.
    5 - Try to have a historic look.
    6 - you can call the tools with different parameters to validate your previous observations.
    7 - suggest if the trend is going to be upward or downward or neutral with a probability.
    Also, mention which date and Ticker you are predicting for.
    """
    )

def fundemental_trader(state: TradingState, name="OIA_fundemental"):
    """LLM agent that analyzes price data and makes a trading decision."""
    introduction_message = HumanMessage(content=f"My name is {name}.")
    # Tips Query
    query = "tips for historical data, rsi, macd, bollinger bands, moving averages, and williams_r"
    top_tips = query_knowledge_base(query, state['knowledge_base'], audiance="fundemental_trader", top_n=5)

    joined_tips = "\n".join([f"{idx}. {tip}" for idx, tip in enumerate(top_tips, 1)])
    top_tips = (f"Here are the top retrieved tips:\n\n{joined_tips}")

    return {"messages": [
        introduction_message,
        fundemental_llm_with_tools.invoke([fundemental_msg] + [top_tips] + [f'\nTicker:{state["ticker"]}']+ state["messages"])
        ]}

# Build the agentic graph
# nodes
fundemental_graph = StateGraph(TradingState)
fundemental_graph.add_node("fundemental_trader", fundemental_trader)
fundemental_graph.add_node("summarization", summarization)
fundemental_graph.add_node("tools", ToolNode(fundemental_tools))
# edges
fundemental_graph.add_edge(START, "fundemental_trader")
fundemental_graph.add_conditional_edges("fundemental_trader", tools_or_summarization_condition)  # Custom tool/summarization logic
fundemental_graph.add_edge("tools", "fundemental_trader")  # Return to trader after tool execution
fundemental_graph.add_edge("summarization", END)  # Summarization is the last step before ending

fundemental_trader_subgraph = fundemental_graph.compile()


# Show
display(Image(fundemental_trader_subgraph.get_graph(xray=True).draw_mermaid_png()))
Decision output: “Stock XYZ is undervalued. Expect upward move.”
📉 Technical Analyst
Runs technical indicators (RSI, MACD, etc.) and reasons using an LLM.
# the technical graph

# the tools
def get_ohlcv_data(state: Annotated[dict, InjectedState]) -> list:
    """Fetch Historical price(OHLCV) data for a specific ticker from the begining of 2025 until yesterday."""
    data = state['price_data']
    return [row for row in data if row["Date"] >= pd.Timestamp('2025-01-01 00:00:00')]

def compute_rsi(state: Annotated[dict, InjectedState], window: int = 14) -> list:
    """
    Computes the Relative Strength Index (RSI) as a momentum indicator.

    :param window: Lookback period for RSI calculation.
    :param state: Injected state containing price data.
    :return: List of dictionaries with 'Date' and 'RSI' values.
    """

    data = pd.DataFrame(state['price_data']).copy()
    # Compute RSI and round it
    data['rsi'] = ta.momentum.RSIIndicator(close=data["Close"], window=window).rsi().round(2)
    data = data[['Date', 'rsi']]
    data['Date'] = pd.to_datetime(data['Date'])
    result = data.to_dict(orient='records')
    # Filter for data from 2025 onwards
    filtered_result = [row for row in result if row["Date"] >= pd.Timestamp('2025-01-01 00:00:00')]

    return filtered_result

def compute_stochastic(state: Annotated[dict, InjectedState], window: int = 10, smooth_window: int = 3) -> list:
    """
    Computes the Stochastic Oscillator as a momentum indicator.

    :param window: Period for %K calculation.
    :param smooth_window: Smoothing for %D.
    :return: List of dictionaries with 'Date', 'stoch_k', 'stoch_d'.
    """
    data = pd.DataFrame(state['price_data']).copy()

    stoch = ta.momentum.StochasticOscillator(
        high=data["High"], low=data["Low"], close=data["Close"],
        window=window, smooth_window=smooth_window
    )

    data["stoch_k"] = stoch.stoch().round(2)
    data["stoch_d"] = stoch.stoch_signal().round(2)

    data = data[['Date', 'stoch_k', 'stoch_d']]
    data['Date'] = pd.to_datetime(data['Date'])

    return [row for row in data.to_dict(orient='records') if row["Date"] >= pd.Timestamp('2025-01-01 00:00:00')]

def compute_macd(state: Annotated[dict, InjectedState], short_window: int = 12, long_window: int = 26, signal_window: int = 9) -> list:
    """
    Computes the MACD (Moving Average Convergence Divergence) as a trend indicator.

    :param short_window: Short EMA period.
    :param long_window: Long EMA period.
    :param signal_window: Signal line smoothing period.
    :return: List of dictionaries with 'Date', 'macd', 'macd_signal', 'macd_histogram'.
    """
    data = pd.DataFrame(state['price_data']).copy()

    macd = ta.trend.MACD(
        close=data["Close"],
        window_slow=long_window, window_fast=short_window, window_sign=signal_window
    )

    data["macd"] = macd.macd().round(2)
    data["macd_signal"] = macd.macd_signal().round(2)
    data["macd_histogram"] = macd.macd_diff().round(2)

    data = data[['Date', 'macd', 'macd_signal', 'macd_histogram']]
    data['Date'] = pd.to_datetime(data['Date'])

    return [row for row in data.to_dict(orient='records') if row["Date"] >= pd.Timestamp('2025-01-01 00:00:00')]

def compute_moving_averages(state: Annotated[dict, InjectedState], sma_window: int = 50, ema_window: int = 20) -> list:
    """
    Computes Simple Moving Average (SMA) and Exponential Moving Average (EMA) as trend indicators.

    :param sma_window: Window for SMA.
    :param ema_window: Window for EMA.
    :return: List of dictionaries with 'Date', 'sma', 'ema'.
    """
    data = pd.DataFrame(state['price_data']).copy()

    data['sma'] = ta.trend.SMAIndicator(close=data["Close"], window=sma_window).sma_indicator().round(2)
    data['ema'] = ta.trend.EMAIndicator(close=data["Close"], window=ema_window).ema_indicator().round(2)

    data = data[['Date', 'sma', 'ema']]
    data['Date'] = pd.to_datetime(data['Date'])

    return [row for row in data.to_dict(orient='records') if row["Date"] >= pd.Timestamp('2025-01-01 00:00:00')]

def compute_bollinger_bands(state: Annotated[dict, InjectedState], window: int = 20, std_dev: int = 2) -> list:
    """
    Computes Bollinger Bands as a volatility indicator.

    :param window: Period for moving average.
    :param std_dev: Standard deviation multiplier.
    :return: List of dictionaries with 'Date', 'bollinger_mavg', 'bollinger_hband', 'bollinger_lband'.
    """
    data = pd.DataFrame(state['price_data']).copy()

    bollinger = ta.volatility.BollingerBands(close=data["Close"], window=window, window_dev=std_dev)

    data["bollinger_mavg"] = bollinger.bollinger_mavg().round(2)
    data["bollinger_hband"] = bollinger.bollinger_hband().round(2)
    data["bollinger_lband"] = bollinger.bollinger_lband().round(2)

    data = data[['Date', 'bollinger_mavg', 'bollinger_hband', 'bollinger_lband']]
    data['Date'] = pd.to_datetime(data['Date'])

    return [row for row in data.to_dict(orient='records') if row["Date"] >= pd.Timestamp('2025-01-01 00:00:00')]

def compute_on_balance_volume(state: Annotated[dict, InjectedState]) -> list:
    """
    Computes On-Balance Volume (OBV) as a volume indicator.

    :return: List of dictionaries with 'Date', 'obv'.
    """
    data = pd.DataFrame(state['price_data']).copy()

    data['obv'] = ta.volume.OnBalanceVolumeIndicator(close=data["Close"], volume=data["Volume"]).on_balance_volume().round(2)

    data = data[['Date', 'obv']]
    data['Date'] = pd.to_datetime(data['Date'])

    return [row for row in data.to_dict(orient='records') if row["Date"] >= pd.Timestamp('2025-01-01 00:00:00')]

def compute_williams_r(state: Annotated[dict, InjectedState], lbp: int = 14) -> list:
    """
    Computes Williams %R, a momentum-based reversal indicator.

    :param lbp: Lookback period.
    :return: List of dictionaries with 'Date', 'williams_r'.
    """
    data = pd.DataFrame(state['price_data']).copy()

    data['williams_r'] = ta.momentum.WilliamsRIndicator(
        high=data["High"], low=data["Low"], close=data["Close"], lbp=lbp
    ).williams_r().round(2)

    data = data[['Date', 'williams_r']]
    data['Date'] = pd.to_datetime(data['Date'])

    return [row for row in data.to_dict(orient='records') if row["Date"] >= pd.Timestamp('2025-01-01 00:00:00')]

technical_tools = [get_ohlcv_data, compute_rsi
         , compute_stochastic, compute_macd
         , compute_moving_averages, compute_bollinger_bands, compute_on_balance_volume, compute_williams_r
         ]
# Initialize the LLM agent
technical_llm = ChatGoogleGenerativeAI(
    model="gemini-2.0-flash"
)
technical_llm_with_tools = technical_llm.bind_tools(technical_tools)
# System message
sys_msg = (
    'system', """
    You are a Technical Trader.
    your Job is to Predict the Trend for the upcoming Trading day and given Ticker:
    1 - analyze the market based on prices (OHLCV)
    2 - analyze any Indicator you find usefull.
    3 - don't just look at the latest values of the indicators, also analyze their histoic movement.
    3 - suggest if the trend is going to be upward or downward or neutral with a probability.
    Also, mention which date and Ticker you are predicting for.
    """
    )

def technical_trader(state: TradingState, name="OIA_technical"):
    """LLM agent that analyzes price data and makes a trading decision."""
    introduction_message = HumanMessage(content = f"My name is {name}.")

    # Tips Query
    query = "tips for historical data, rsi, macd, bollinger bands, moving averages, and williams_r"
    top_tips = query_knowledge_base(query, state['knowledge_base'], audiance="technical_trader", top_n=5)

    joined_tips = "\n".join([f"{idx}. {tip}" for idx, tip in enumerate(top_tips, 1)])
    top_tips = (f"Here are the top retrieved tips:\n\n{joined_tips}")

    return {"messages": [
        introduction_message,
        technical_llm_with_tools.invoke([sys_msg] + [top_tips] + [f'\nTicker:{state["ticker"]}']+ state["messages"])
        ]}


# Build the agentic graph
# nodes
technical_graph = StateGraph(TradingState)
technical_graph.add_node("technical_trader", technical_trader)
technical_graph.add_node("summarization", summarization)
technical_graph.add_node("tools", ToolNode(technical_tools))
# edges
technical_graph.add_edge(START, "technical_trader")
technical_graph.add_conditional_edges("technical_trader", tools_or_summarization_condition)
technical_graph.add_edge("tools", "technical_trader")
technical_graph.add_edge("summarization", END)

technical_trader_subgraph = technical_graph.compile()


# Show
# display(Image(technical_trader_subgraph.get_graph(xray=True).draw_mermaid_png()))
Decision output: “Momentum and breakout patterns suggest upward trend.”
💬 Sentiment Analyst
Scrapes headlines, social chatter, and builds a sentiment model.
# sentimental analyst Graph

# Define the tools
# reddit tool
def get_reddit_posts(state: Annotated[dict, InjectedState]) -> list[dict]:
    """
    Searches Reddit's r/stocks subreddit for hot posts from the last 24 hours
    that match the wanted.


    Returns:
        List[dict]: A list of dictionaries containing post details:
                    - title
                    - score
                    - num_comments
                    - created_utc
                    - url
                    - text
    """

    # Setup
    reddit = praw.Reddit(
        client_id= REDDIT_CLIENT_ID,         # From the app dashboard
        client_secret= REDDIT_CLIENT_SECRET,        # Also from the app dashboard
        user_agent=REDDIT_USER_AGENT,  # Custom, but required
        username=REDDIT_USERNAME,    # Your Reddit login
        password=REDDIT_PASSWORD     # Your Reddit login password
    )


    # Setup times using timezone-aware datetimes
    now = datetime.now(timezone.utc)
    one_day_ago = now - timedelta(days=1)

    # Parameters
    subreddit = reddit.subreddit(state['ticker'])

    results = []
    # Search hot posts and filter manually by time
    for post in subreddit.hot(limit=50):
        post_time = datetime.fromtimestamp(post.created_utc, tz=timezone.utc)
        if post_time.date() >= one_day_ago.date():
                results.append({
                    "title": post.title,
                    "score": post.score,
                    "num_comments": post.num_comments,
                    "created_utc": post_time.strftime('%Y-%m-%d %H:%M:%S %Z'),
                    "url": post.url,
                    "text": post.selftext
                })

    # sort results by score, and return the highest 5
    results.sort(key=lambda x: x["score"], reverse=True)
    if len(results) > 5:
        results = results[:5]
    return results

# web search tool
def search_stock_prediction(query: str, max_results: int = 10) -> list[dict]:
    """
    Uses the Tavily web search tool to retrieve articles or web content related to stock predictions.

    Parameters:
        query (str): A search query that must clearly include:
                     - the stock ticker (e.g., "AAPL")
                     - the prediction date (e.g., "16th April 2025")
        max_results (int): The number of search results to retrieve (default is 10).

    Returns:
        List[dict]: A list of dictionaries, each with:
                    - title (str)
                    - url (str)
                    - score (float)
                    - content (str)

    Example:
        search_stock_prediction("AAPL stock price prediction for 16th April 2025", 10)
    """
    tavily_search = TavilySearchResults(max_results=max_results)
    tavily_search_results = tavily_search.invoke(query)

    results = []
    for result in tavily_search_results:
        results.append({
            "title": result["title"],
            "url": result["url"],
            "score": result["score"],
            "content": result["content"]
        })

    return results

sentiment_tools = [get_reddit_posts, search_stock_prediction]

# Initialize the LLM agent
sentiment_llm = ChatGoogleGenerativeAI(
    model="gemini-2.0-flash"
)
sentiment_llm_with_tools = sentiment_llm.bind_tools(sentiment_tools)
# System message
sentimental_msg = (
    'system', """
    You are a Sentimental Trader.
    your Job is to Predict the Trend for the upcoming Trading day and given Ticker:
    1 - analyze the market based on the things people talk about in reddit and the whole web
    2 - make isolated observations based on the results you see and connect them with the trend of the current stock for the given day.
    3 - your observations should be isolated based on each source or statement you want to make.
    4 - in each observation also mention the source or sources, and pay attention if the date of the content makes sense with the date you want to predict.
    5 - you can call the tools with different parameters to validate your previous observations.
    6 - suggest if the trend is going to be upward or downward or neutral with a probability.
    Also, mention which date and Ticker you are predicting for.
    """
    )

def sentimental_trader(state: TradingState, name="OIA_sentimental"):
    """LLM agent that analyzes price data and makes a trading decision."""
    introduction_message = HumanMessage(content=f"My name is {name}.")

    # Tips Query
    query = "tips for searching to get the sentimental analysis and concluding stock sentiment"
    top_tips = query_knowledge_base(query, state['knowledge_base'], audiance="sentimental_trader", top_n=5)

    joined_tips = "\n".join([f"{idx}. {tip}" for idx, tip in enumerate(top_tips, 1)])
    top_tips = (f"Here are the top retrieved tips:\n\n{joined_tips}")

    return {"messages": [
        introduction_message,
        sentiment_llm_with_tools.invoke([sentimental_msg] + [top_tips]+ [f'\nTicker:{state["ticker"]}']+ state["messages"])
        ]}

# nodes
sentimental_graph = StateGraph(TradingState)
sentimental_graph.add_node("sentimental_trader", sentimental_trader)
sentimental_graph.add_node("summarization", summarization)
sentimental_graph.add_node("tools", ToolNode(sentiment_tools))
# edges
sentimental_graph.add_edge(START, "sentimental_trader")
sentimental_graph.add_conditional_edges("sentimental_trader", tools_or_summarization_condition)  # Custom tool/summarization logic
sentimental_graph.add_edge("tools", "sentimental_trader")  # Return to trader after tool execution
sentimental_graph.add_edge("summarization", END)  # Summarization is the last step before ending

sentimental_trader_subgraph = sentimental_graph.compile()


# Show
# display(Image(sentimental_trader_subgraph.get_graph(xray=True).draw_mermaid_png()))
Decision output: “Sentiment overheated. Watch for reversal.”
🧠 Manager Agent: Final Call
The Manager Agent consolidates all three decisions and makes the final call.
# decider node
decider = ChatGoogleGenerativeAI(
    model="gemini-2.0-flash"
)
structured_decider = decider.with_structured_output(decision)

# System message
decider_msg = (
    'system', """
    You are a investment manager that makes decisions after listening to other peoples opinion and also doing your own research.
    your Job is to Predict the Trend for the upcoming Trading day for the given Ticker:
    1 - Read the observations provided by different analysts as provided below
    2 - Look at their sources, their logics and their decisions.
    3 - validate them and put them next to each other to see which ones make sense and which ones don't.
    4 - find out which observations are stronger to make decision based on them.
    5 - validate what you come up with and if you need to, you can analyze the data yourself and search the web.
    6 - make observations based on past observations and the things you found yourself that support your decision making. mention sources and names.
    7 - don't forget to make you own observations and logics as well, only relying on other peopls opinion does not make sense.
    3 - suggest if the trend is going to be upward or downward or neutral.
    Also, mention which date and Ticker you are predicting for.
    """
    )

def trading_manager(state: TradingState, name="OIA_manager"):
    """LLM agent that analyzes observations and makes a trading decision."""
    introduction_message = HumanMessage(content=f"My name is {name}.")

    # putting the output of other analysts in the context
    context = ""
    context += state['messages'][0].content + "\n\n__\n"
    for d in state['logic']:
        context += f"{d.agent_name}\n"
        context += f"{d.decision}\n"
        for o in d.chain_of_logics:
            context += f"{o}\n"
        context += "\n__\n"
    context = HumanMessage(content=context)

    # Tips Query
    query = "tips for making decision based on searches and techniocal, fundemental, and sentimental analyst decisions."
    top_tips = query_knowledge_base(query, state['knowledge_base'], audiance="trading_manager", top_n=5)
    joined_tips = "\n".join([f"{idx}. {tip}" for idx, tip in enumerate(top_tips, 1)])
    top_tips = (f"Here are the top retrieved tips:\n\n{joined_tips}")
    print("top_tips", top_tips)
    managerial_output = structured_decider.invoke([introduction_message, decider_msg, context, top_tips, f'\nTicker:{state["ticker"]}'])
    return {"logic": managerial_output if isinstance(managerial_output, list) else [managerial_output]}
Output: “Long position with tight stop-loss. All signals align.”
🔄 Self-Improvement Loop
Every day, the system compares predictions with real results and learns.
The Initiator Agent:
- Checks how predictions fared
- Generates insight tips like: > “Don’t ignore bond yields when evaluating tech stocks.”
- Stores those tips for RAG retrieval tomorrow
# auditor node
def initializer(state: TradingState):
    """Updates the knowledge base for tips for agents."""

    auditor_message = (
        "system","""
        You are an auditor that looks at a stock daily trend and finds out the reasons for it.
        you are also provided with what our department observed and predicted for the given date with the true trend
        Your task is to find out the reason for the happend trend and give tips to our traders to improve their performance based on their observation:
        1 - look at the given trend and date and find out the reason behind it.
        2 - you can search the web and look at everything to maybe find out the reason behind the trend.
        3 - be careful that we are only intrested about the trend of the stock for the given date which is in the past days.
        4 - after you uderstand the reason behind the trend, check the observations and logics out traders made and try to correct them.
        5 - Now that you know what was needed to predict correctly, give tips to our traders to improve their performance.
        6 - your tips should be a bit general in a way that help the traders to make better decisions based on logics or observations better.
        """
        )

    yesterday_info = (get_yesterday_return(state["ticker"], state["date"]))

    observations = (state["prev_day_analysis"])
    auditor = ChatGoogleGenerativeAI(
    model="gemini-2.0-flash"
)
    structured_auditor = auditor.with_structured_output(tips)
    x = structured_auditor.invoke([auditor_message,yesterday_info, observations])
    rows_to_add = [{"audiance": t.audiance, "tip": t.tip} for t in x.tips]
    print(rows_to_add)
    new_df = pd.DataFrame(rows_to_add)
    insights_new = pd.concat([insights, new_df], ignore_index=True)
    knowledge_base = create_knowledge_base(insights_new)


    return {"knowledge_base": knowledge_base}
📋 Sample Output – AAPL Decision (2025-04-18)
Please give me your decision for AAPL on 2025-04-18.

__
OIA_fundemental
Neutral to slightly upward.
observation="AAPL's performance is closely tied to the tech sector and the overall market. Recent volatility suggests some uncertainty, but a slight recovery is visible."
logic='Market and Sector Analysis: Examined AAPL, XLK, SPY, AMZN, GOOG, MSFT performance over the past 5 days.'
observation="The fundamental ratios haven't shown dramatic shifts, indicating relative stability in valuation despite price fluctuations."
logic='Fundamental Analysis: Analyzed PE, PS, PB ratios, and dividend yield over the last 5 days.'
observation='The options data suggests a slightly bullish sentiment, with more call open interest than put open interest. The negative call skew indicates slightly less demand for OTM calls compared to ATM calls, while the positive put skew indicates more demand for OTM puts compared to ATM puts'
logic='Options Data Analysis: Analyzed ATM strike, implied volatility, put/call ratio, call skew, and put skew.'

__
OIA_sentimental
Downward
observation='The only relevant reddit post is not useful.'
logic='Reddit Sentiment Analysis'
observation='Mixed sentiment: Several sources suggest a potential decrease in AAPL stock value in April 2025. For example, coincodex.com predicts AAPL to trade between $183.44 and $199.50 in April 2025.'
logic='Web Sentiment Analysis'
observation='MarketBeat.com shows a consensus rating of "Moderate Buy" for AAPL. However, it also presents a range of analyst actions, including lowering price targets.'
logic='Analyst Ratings'
observation='30rates.com forecasts AAPL to be around $187.20 on April 18, 2025.'
logic='Price Predictions'
observation='coinpriceforecast.com is very bullish in the long term.'
logic='Long-term Growth'

__
OIA_technical
Neutral
observation='The price has experienced a sharp decline followed by a slight recovery.'
logic='Recent Price Action'
observation='The price is currently below both the 20-day SMA and EMA, indicating a downward trend. The 20-day SMA is at 206.15, and the 20-day EMA is at 204.01.'
logic='Moving Averages'
observation='The MACD line (-7.79) is below the signal line (-8.21), but the histogram is positive (0.42), suggesting that the downward momentum might be weakening.'
logic='MACD'
observation='The RSI is at 43.61, which is in the neutral territory.'
logic='RSI'

__
OIA_manager
Neutral to slightly upward.
observation="AAPL's performance is closely tied to the tech sector and the overall market. Recent volatility suggests some uncertainty, but a slight recovery is visible."
logic='Market and Sector Analysis: Examined AAPL, XLK, SPY, AMZN, GOOG, MSFT performance over the past 5 days.'
observation="The fundamental ratios haven't shown dramatic shifts, indicating relative stability in valuation despite price fluctuations."
logic='Fundamental Analysis: Analyzed PE, PS, PB ratios, and dividend yield over the last 5 days.'
observation='The options data suggests a slightly bullish sentiment, with more call open interest than put open interest. The negative call skew indicates slightly less demand for OTM calls compared to ATM calls, while the positive put skew indicates more demand for OTM puts compared to ATM puts'
logic='Options Data Analysis: Analyzed ATM strike, implied volatility, put/call ratio, call skew, and put skew.'
✅ Summary – Key Takeaways
- Each agent specializes in a domain: fundamental, technical, sentiment
- Agents learn from past mistakes via RAG
- LangGraph orchestrates everything like a neural circuit board
- The Manager Agent acts like a human trading lead
- Over time, the system builds a smarter decision engine
🚀 What’s Next?
- Schedule to run daily before market opens
- Persist insights on a server or cloud DB
- Add:
- 🧮 Risk Manager Agent
- 📈 Portfolio Allocator Agent
- 📊 Quantitative Evaluator
- Track P&L to guide decision weighting
It’s not just a trading bot. It’s a thinking, learning department of bots.
The more they trade, the smarter they get.
💬 Your Turn
Got ideas for more agents? Want to try this with crypto, options, or Forex?
Drop a comment below or fork the project — let’s build a smarter financial future together.
💻 Full Code Available: Check it out on Kaggle