
Introduction
In a seismically active region like Indonesia, monitoring earthquakes in real time is crucial for ensuring public safety and preparedness. This tutorial demonstrates how to create a real-time earthquake monitoring dashboard using JavaScript, Leaflet, and the BMKG API. By the end of this article, you will have a functional dashboard that fetches earthquake data and visualizes it on an interactive map.
Technologies Used
- JavaScript
- Leaflet (for interactive maps)
- BMKG API (for earthquake data)
- HTML & CSS
Setting Up the Project
Start by creating a simple HTML structure to host your dashboard. Here’s the basic layout:
</span>
Earthquake Monitoring Dashboard
rel="stylesheet" href="https://unpkg.com/leaflet/dist/leaflet.css">
#map { height: 600px; width: 100%; }
Earthquake Monitoring Dashboard
id="map">
<span class="na">src="https://unpkg.com/leaflet/dist/leaflet.js">
<span class="na">src="app.js">
Enter fullscreen mode
Exit fullscreen mode
To make the appearance more attractive, we use CSS to create a simple yet informative design.
blink {
animation: blink-animation 1s infinite;
color: red;
font-weight: bold;
}
@keyframes blink-animation {
0% { opacity: 1; }
50% { opacity: 0; }
100% { opacity: 1; }
}
.blink-marker {
background-color: red;
border-radius: 50%;
width: 20px;
height: 20px;
animation: blink-animation 1s infinite;
border: 2px solid yellow;
}
Enter fullscreen mode
Exit fullscreen mode
Fetching Data from BMKG API
To get real-time earthquake data from BMKG, use the following fetch method in app.js:
async function fetchEarthquakeData() {
try {
const response = await fetch('https://data.bmkg.go.id/DataMKG/TEWS/gempadirasakan.json');
const data = await response.json();
console.log(data);
plotEarthquakes(data);
} catch (error) {
console.error('Error fetching data:', error);
}
}
Enter fullscreen mode
Exit fullscreen mode
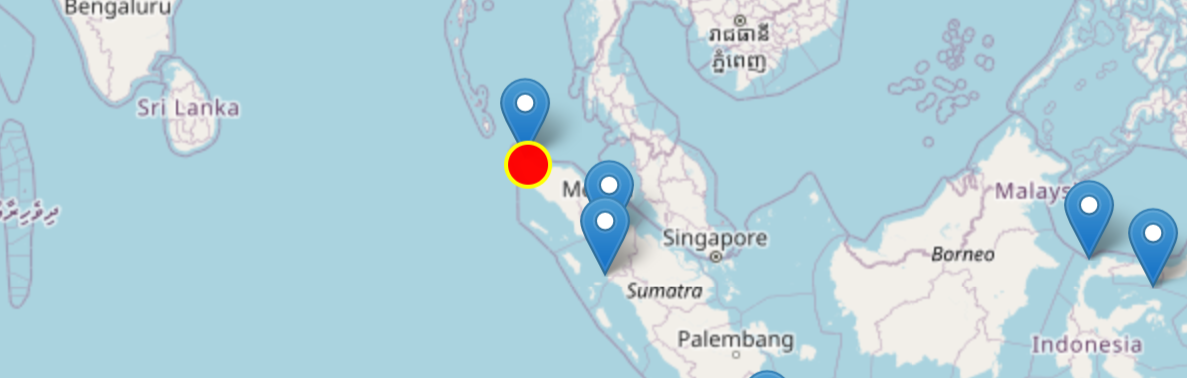
Plotting Earthquakes on the Map
With Leaflet, plot the data as markers on an interactive map:
function plotEarthquakes(data) {
const map = L.map('map').setView([-2.5489, 118.0149], 5);
L.tileLayer('https://{s}.tile.openstreetmap.org/{z}/{x}/{y}.png', {
maxZoom: 18,
}).addTo(map);
data.infogempa.gempa.forEach(quake => {
const { Lintang, Bujur, Magnitude } = quake;
const marker = L.marker([parseFloat(Lintang), parseFloat(Bujur)]).addTo(map);
marker.bindPopup(`Magnitude: ${Magnitude}`).openPopup();
});
}
fetchEarthquakeData();
Enter fullscreen mode
Exit fullscreen mode
You can view the real-time DEMO (in Bahasa) of the application directly below:
Handling Errors and Optimizing Performance 🚀
When dealing with real-time data, it’s essential to handle errors gracefully and optimize the application’s performance.
Use asynchronous functions efficiently and consider minimizing API calls to reduce server load.
Visual Enhancements and User Experience ✨
Enhance the dashboard with custom map markers and styled pop-ups to make it more visually appealing.
Additionally, adding features like earthquake history or filtering by magnitude can make the dashboard more informative and user-friendly.
Conclusion
Creating an earthquake monitoring dashboard with Leaflet and the BMKG API provides an excellent way to visualize real-time seismic data. With further improvements like enhanced UI and data filtering, this project can be expanded for broader applications, such as disaster preparedness or public awareness campaigns.I hope this article helps you understand how to build a real-time earthquake monitoring app easily and efficiently! Happy coding! 😁👍