Introduction
In the growing creator economy, YouTube channels pump out tons of videos every week. and Creators need a simple dashboard that answers the following questions:
- How has my channel grown over time?
- What is the best day and time to post a video?
- What are the most engaging videos in my channel?
To tackle this, I built an end-to-end data pipeline that automatically pulls, processes, and visualizes YouTube data.
In this article goes over the steps I took to archieve this.
Part 1: Installing the Tools Natively on an Azure Ubuntu VM
Instead of using Docker,I installed everything natively because it gave me more control, better performance tuning, and more flexibility compared to containerized environments.
1. Install Apache Airflow
Apache Airflow schedules and manages all the ETL jobs automatically.
Step 1.1: Create a dedicated airflow user
First, it’s good practice to create a separate user to run Airflow (avoiding permission issues later).
sudo adduser airflow
Follow the prompts (you can skip extra info fields). Then add the user to sudoers:
sudo usermod -aG sudo airflow
Login as the new user:
sudo su - airflow
Step 1.2: Install system dependencies
Update the system first:
sudo apt update && sudo apt upgrade -y
Install required libraries:
sudo apt install -y python3-pip python3-venv libpq-dev
python3-venv → To create isolated Python environments
libpq-dev → For Postgres client libraries (needed later)
Step 1.3: Set up Python Virtual Environment for Airflow
It’s highly recommended to run Airflow inside a virtual environment:
python3 -m venv airflow_venv
source airflow_venv/bin/activate
Now inside the virtualenv, install Airflow:
pip install apache-airflow
✅ Installing Airflow takes a while (~5 mins) because it pulls many dependencies.
Step 1.4: Initialize Airflow Database
Airflow uses a metadata database to track DAG runs and tasks. We'll configure it later for PostgreSQL, but initially, initialize it:
export AIRFLOW_HOME=~/airflow
airflow db init
This creates:
~/airflow/airflow.cfg
SQLite DB initially (we'll later connect to PostgreSQL).
Step 1.5: Create an Admin User
Airflow needs an admin user to login to the web UI.
airflow users create \
    --username admin \
    --firstname Admin \
    --lastname User \
    --role Admin \
    --email [email protected]
Step 1.6: Run Airflow services
You need two services running:
Webserver (UI)
Scheduler (Job runner)
Start them:
airflow webserver --port 8080
In another SSH session/tab:
airflow scheduler
You can now access Airflow at http://:8080
At this point, verify:
Airflow UI is accessible.
Admin login works.
2. Install Apache Spark (Data Processing Engine)
Spark handles heavy lifting for data transformation. Make sure you have java and scala installed.
Step 2.1: Download and extract Spark
wget https://downloads.apache.org/spark/spark-3.4.0/spark-3.4.0-bin-hadoop3.tgz
tar -xvzf spark-3.4.0-bin-hadoop3.tgz
Move it to /opt (standard for system-wide apps):
sudo mv spark-3.4.0-bin-hadoop3 /opt/spark
Step 2.2: Set Spark Environment Variables
Edit your bash profile:
nano ~/.bashrc
Add at the bottom:
export SPARK_HOME=/opt/spark
export PATH=$PATH:$SPARK_HOME/bin:$SPARK_HOME/sbin
Apply changes:
source ~/.bashrc
Step 2.3: Test Spark installation
Check Spark version:
spark-submit --version
✅ If you see version info without errors, Spark is installed properly.
3. Install PostgreSQL (Data Warehouse)
PostgreSQL will store all cleaned YouTube data.
Step 3.1: Install PostgreSQL Server
sudo apt update
sudo apt install -y postgresql postgresql-contrib
Step 3.2: Create Database and User
Switch to Postgres superuser:
sudo -u postgres psql
Inside psql shell:
CREATE DATABASE youtube_analytics;
CREATE USER airflow WITH ENCRYPTED PASSWORD 'yourpassword';
GRANT ALL PRIVILEGES ON DATABASE youtube_analytics TO airflow;
\q
Now Airflow and your scripts will connect using the airflow user.
At this point, verify:
psql connects successfully.
youtube_analytics database exists.
4. Install Grafana (Dashboarding)
Grafana visualizes the results beautifully.
Step 4.1: Add Grafana Repo
sudo apt-get install -y software-properties-common
sudo add-apt-repository "deb https://packages.grafana.com/oss/deb stable main"
wget -q -O - https://packages.grafana.com/gpg.key | sudo apt-key add -
sudo apt-get update
Step 4.2: Install Grafana
sudo apt-get install grafana
Enable and start the service:
sudo systemctl start grafana-server
sudo systemctl enable grafana-server
Step 4.3: Access Grafana
Grafana will be available at:
http://:3000
Default credentials:
Username: admin
Password: admin
(you'll be prompted to change password at first login)
At this point, your server is fully ready:
Airflow + Spark + Postgres + Grafana all installed, running natively.
Part 2: Code Walkthrough
1. The Core ETL Pipeline (main.py)
This file is the heart of the whole system. It does three main things:
Pulls data from the YouTube API
Processes and enriches it using PySpark
Returns clean DataFrames ready to be stored
Load API Key and Initialize Spark + YouTube Client
python
from dotenv import load_dotenv
import os
from googleapiclient.discovery import build
from pyspark.sql import SparkSession

load_dotenv()
google_api_key = os.getenv('API_KEY')
This section loads your .env file and gets the API key for authenticating with the YouTube Data API.
def get_spark():
    return SparkSession.builder \
        .appName("YoutubeAnalytics") \
        .config("spark.jars", "/path/to/postgresql-42.6.0.jar") \
        .master("local[*]") \
        .getOrCreate()
Creates a local Spark session and includes the JDBC driver to connect to PostgreSQL later.
def get_youtube():
    return build('youtube', 'v3', developerKey=google_api_key)
Builds the YouTube API client using the API key.
Get Subscriber Count (getSubscribers())
request = youtube.channels().list(part='statistics', id='UCtxD0x6AuNNqdXO9Wp5GHew')
response = request.execute()
subscriber_count = int(response['items'][0]['statistics']['subscriberCount'])
This gets the current subscriber count for the specified channel.
subscriber_data = [(date.today(), subscriber_count)]
df = spark.createDataFrame(subscriber_data, ["date", "subscribers"])
Stores the date + subscriber count as a Spark DataFrame. This helps visualize growth over time later.
Get Top Videos by Engagement (get_videos)
# Loop through playlist videos
request = youtube.playlistItems().list(part='snippet,contentDetails', playlistId=playlist_id, maxResults=50)
Pulls all video IDs from the "Uploads" playlist.
# Pull stats for each video
data_request = youtube.videos().list(part='snippet,statistics', id=','.join(video_ids))
Fetches views, likes, and comments for each video.
engagement_rate = round((like_count + comment_count) / view_count, 2)Calculates engagement rate to identify top-performing videos.
best_df = df.orderBy(col("engagement_rate").desc()).limit(5)Sorts and selects the top 5 most engaging videos.
Best Time to Post (best_post_time)
df = df.withColumn("hour", hour(col('published_date')))
df = df.withColumn("day", date_format(col('published_date'), "E"))
Extracts the day of week and hour from the video publish time.
df = df.withColumn("engagement", col('likes') + col('view_count') + col('comments'))Creates an engagement score to use for averaging.
grouped = df.groupBy("day", "hour").avg("engagement")Aggregates average engagement by day/hour pair.
result = grouped.select("day_hour", "avg_engagement").orderBy(col("avg_engagement").desc()).limit(3)Returns the best 3 day-hour combinations for posting.
2. The Controller File (controller.py)
This script is responsible for executing the ETL logic and pushing the results to PostgreSQL.
from main import getSubscribers, get_videos, best_post_time

subscriber_df = getSubscribers()
videos_list, best_videos_df = get_videos()
best_post_time_df = best_post_time(videos_list)
It calls the three main ETL functions and stores their outputs.
subscriber_df.write.jdbc(url=jdbc_url, table="subscriber_data", mode='append', properties=properties)Writes each DataFrame into its corresponding PostgreSQL table.
Tables used:
subscriber_data
best_post_time
best_performing_videos
Clean separation between data logic and storage logic.
3. The Airflow DAG (youtube_dag.py)
This DAG automates running the pipeline daily.
default_args = {
    "owner": "Batru",
    "start_date": datetime(2025, 4, 23),
    "retries": 1,
    "retry_delay": timedelta(minutes=1),
    "email_on_failure": True,
    "email": ["[email protected]"]
}
Defines retry behavior and email alerts on failure.
task_youtube = BashOperator(
    task_id="task_youtube",
    bash_command="""
        source /home/mombasa/projects/youtubue_analytics_dashboard/venv/bin/activate &&
        python3 /home/mombasa/projects/youtubue_analytics_dashboard/controller.py
    """
)
The task activates the Python virtual environment and runs controller.py, kicking off the full ETL.
Part 3: Visualizing YouTube Data with Grafana
With the data successfully loaded into PostgreSQL from our Spark job (via Airflow), it’s time to bring it to life visually using Grafana.
Grafana is already installed on our Ubuntu server. Here's how we set it up and created dashboards that answer our key analytics questions.
Connect Grafana to PostgreSQL
- Login to Grafana
- Navigate to http://128.85.32.87:3000 in your browser. * Default login is usually:
Username: admin
Password: admin (you’ll be asked to reset on first login)
- Add PostgreSQL as a Data Source and Fill in:
Host: localhost:5432 or your DB host
Database: youtube_analytics
User and Password: your PostgreSQL credentials
Click Save & Test.
Create the Dashboards
Now that the DB is connected, let’s create panels to visualize the insights.
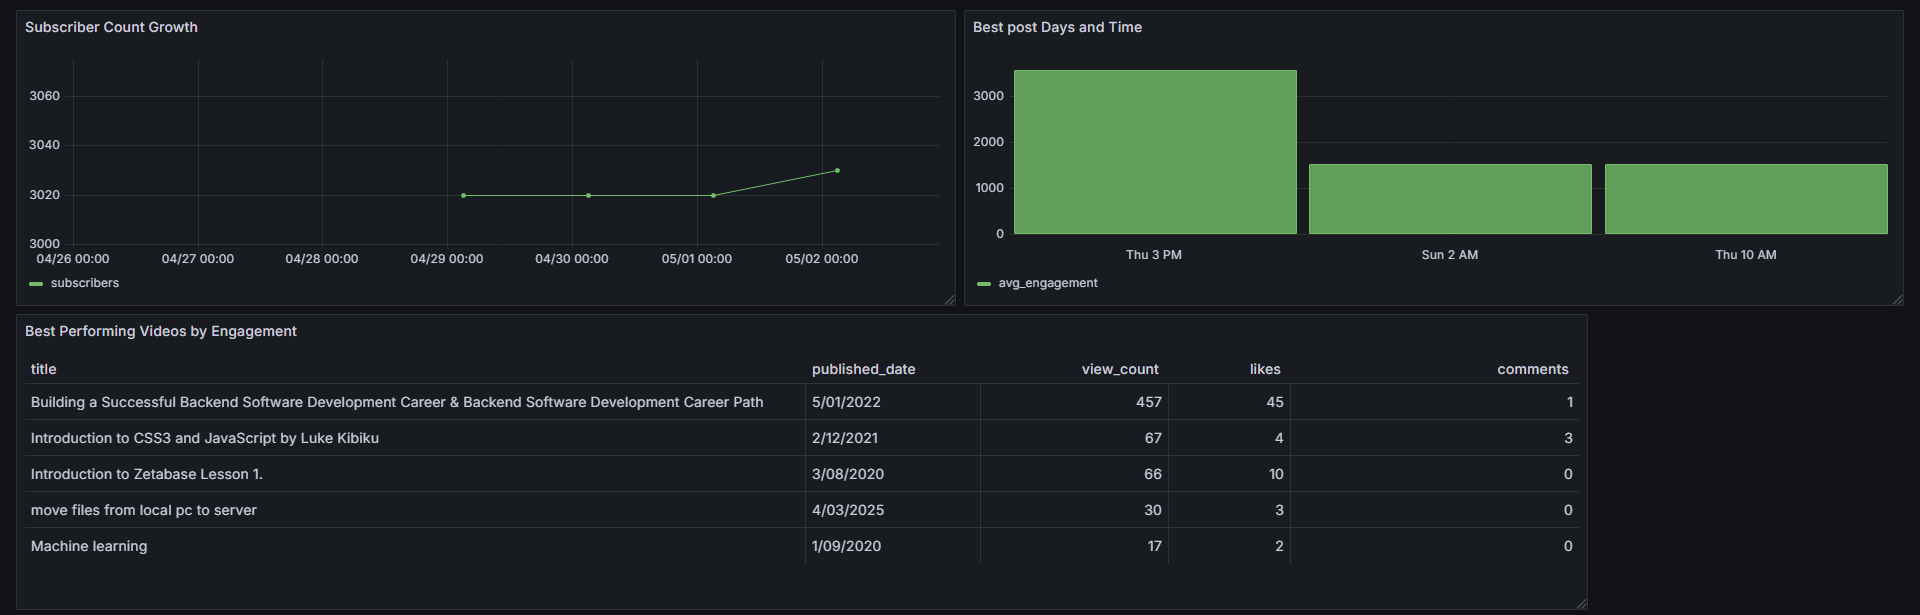
1. Channel Growth Over Time
Query from subscriber_data table:
SELECT date, subscribers FROM subscriber_data ORDER BY date;Visualization: Use a Time Series panel
Y-axis: Subscriber count
X-axis: Date
This shows subscriber growth trends over time.
2. Best Performing Videos by Engagement
Query from best_performing_videos:
SELECT title, engagement_rate FROM best_performing_videos ORDER BY engagement_rate DESC LIMIT 5;Visualization: Bar Chart
X-axis: Video titles
Y-axis: Engagement rate
This reveals which videos truly resonate with the audience.
3. Best Time to Post
Query from best_post_time:
SELECT day_hour, avg_engagement FROM best_post_time ORDER BY avg_engagement DESC LIMIT 5;Visualization: Table or Bar Chart
The final dashboard would look like something like this