STEP 1: Download the dataset from the kaggle.

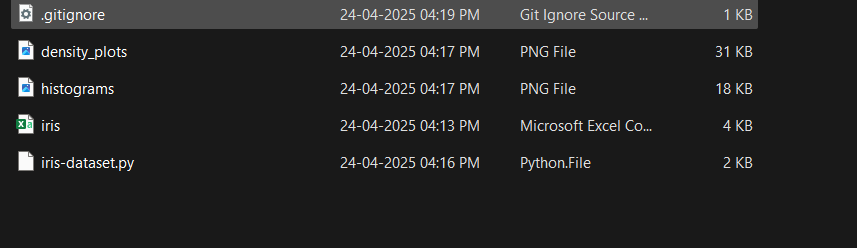
STEP 2: save them in the one folder.
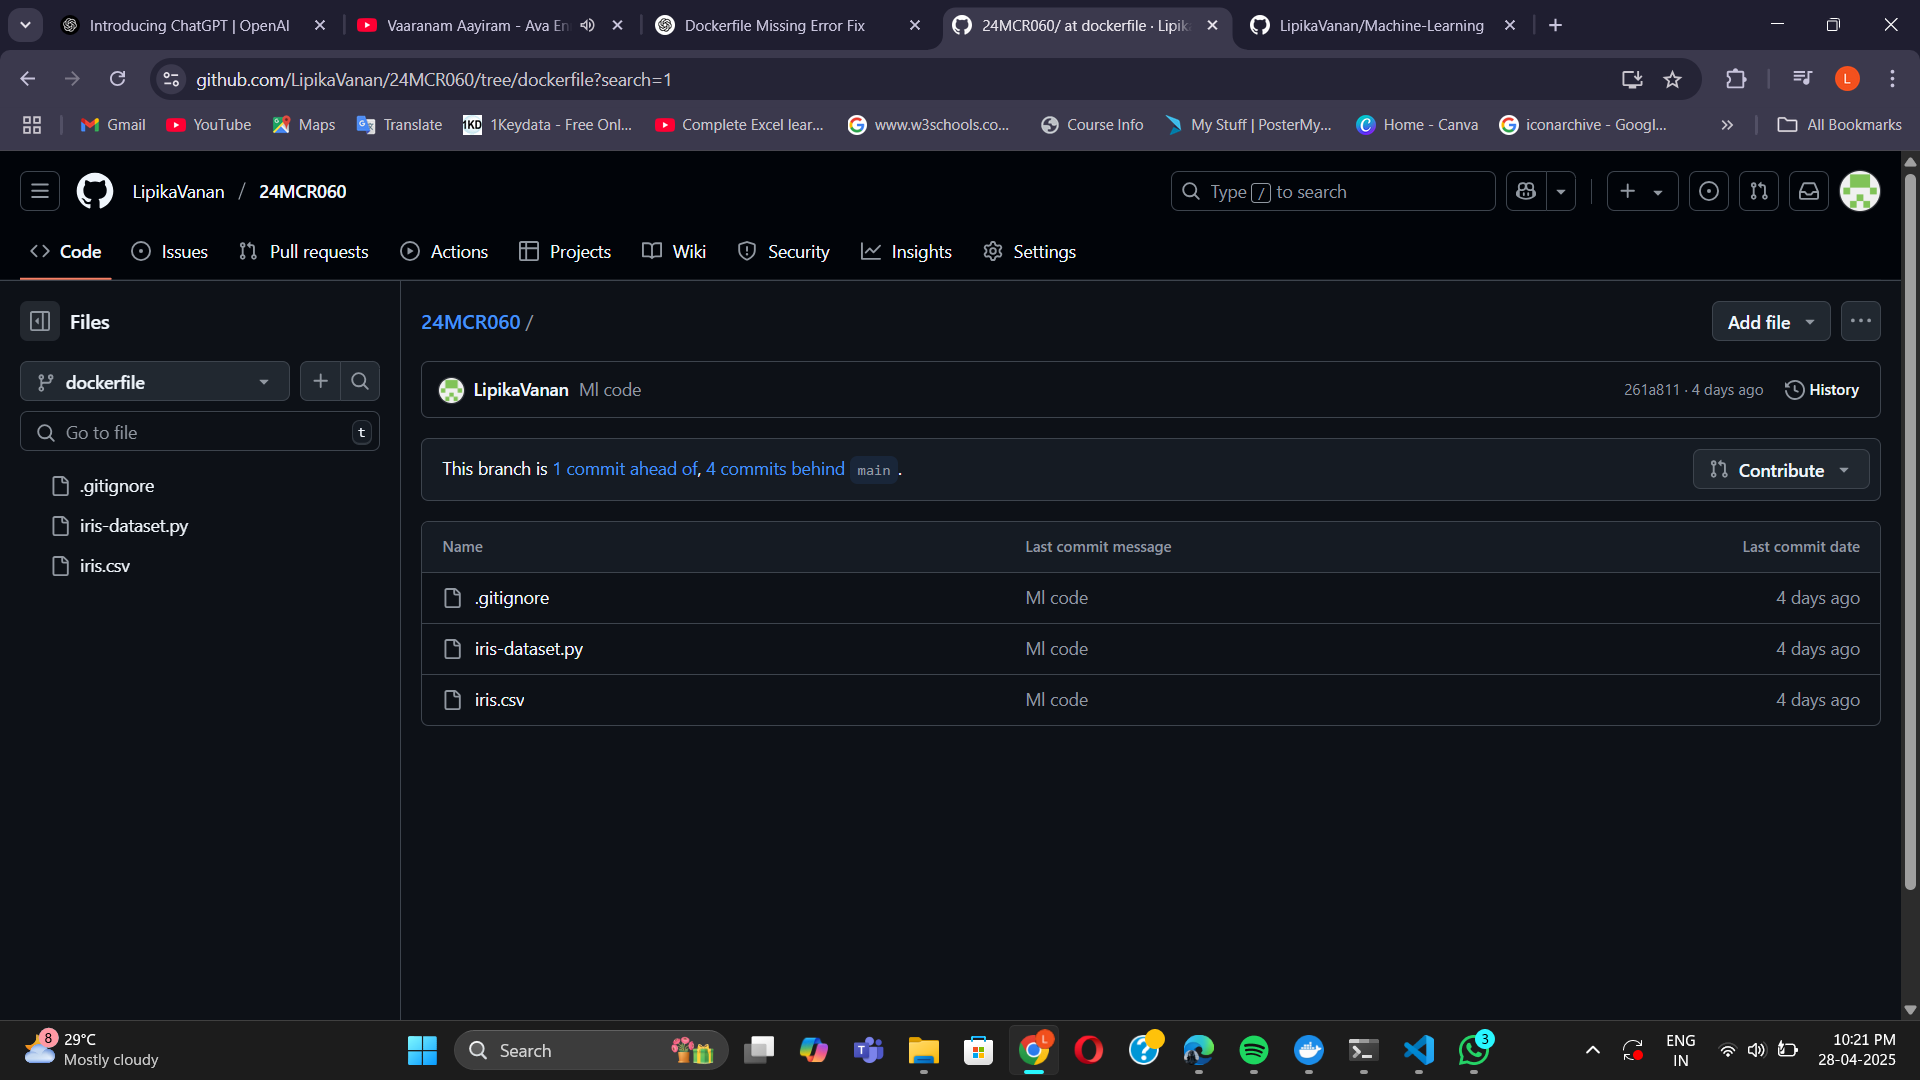
STEP 3: create the repository in the github.
STEP 4: given code run on the visual studio and install the python library on that after run the code.
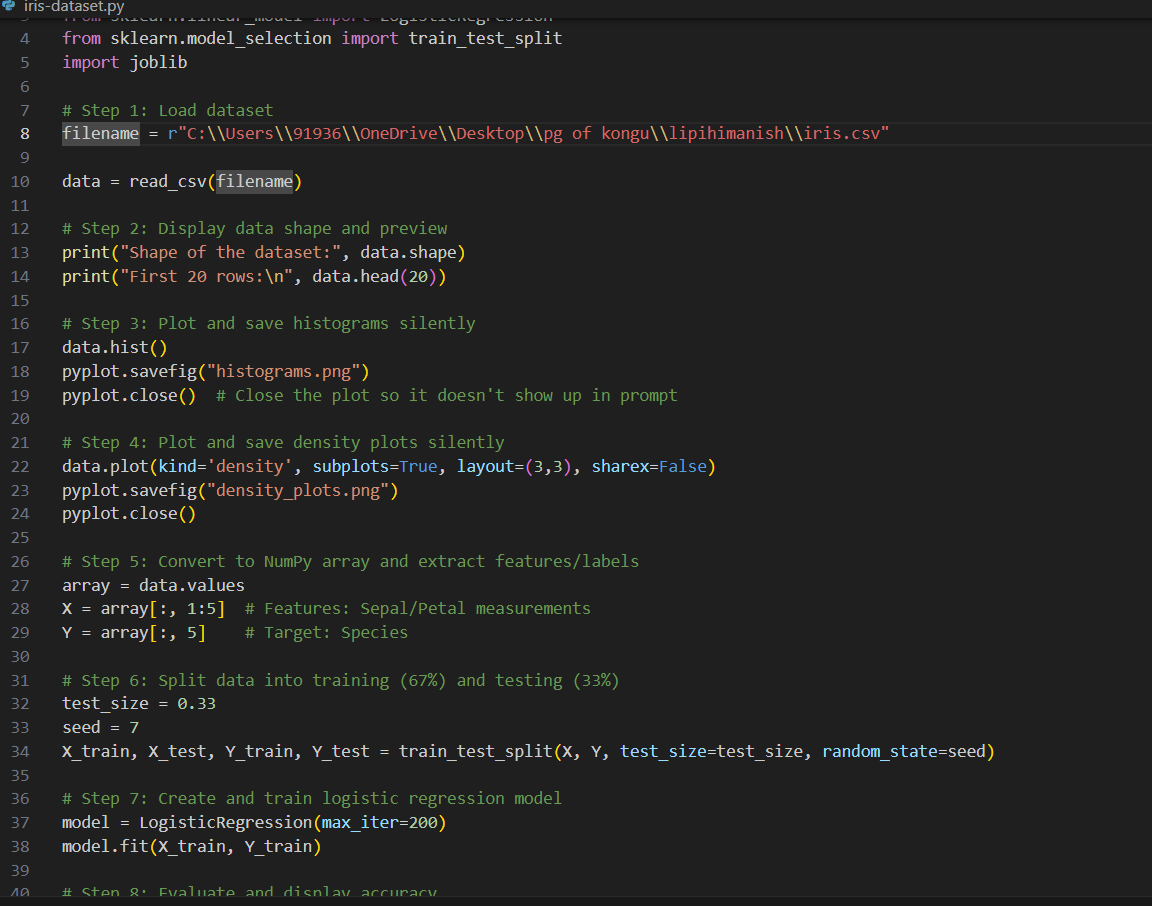
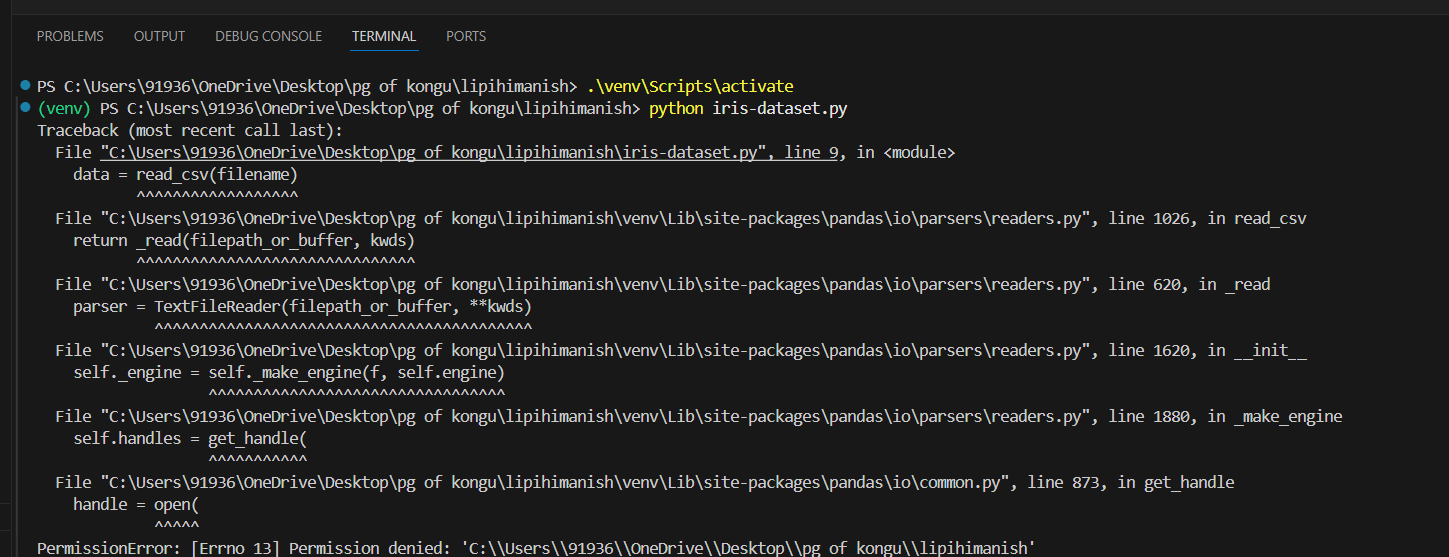
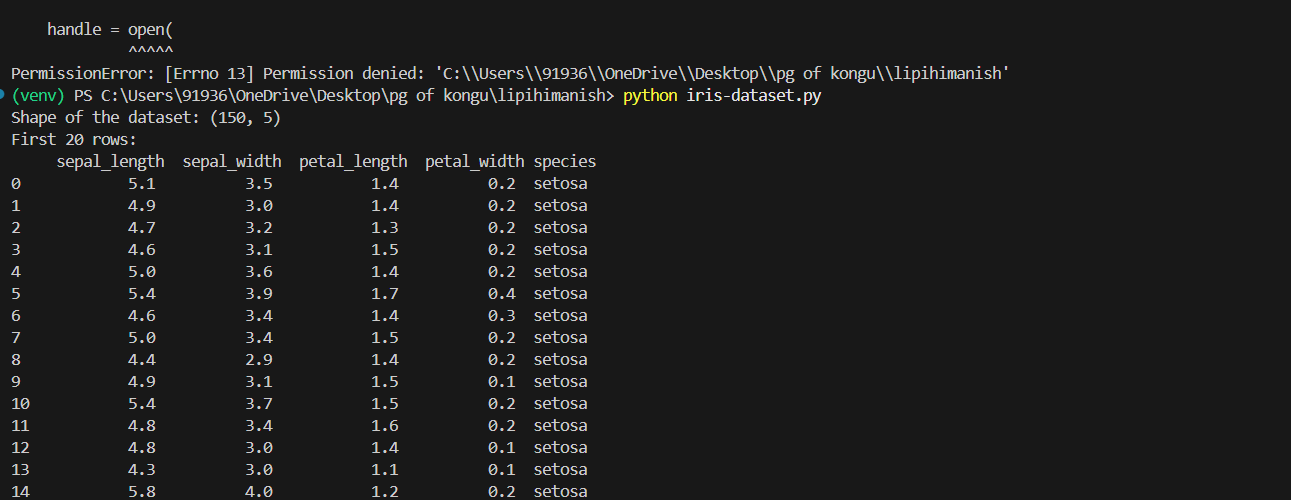
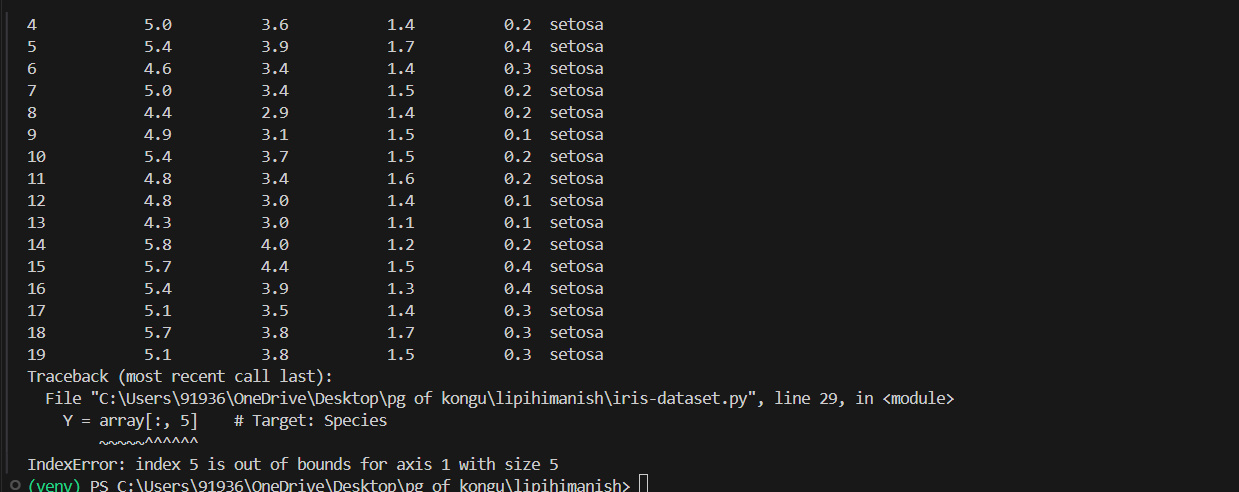
STEP 5: In the output there will be a display the graph,plot on that. and collect them and save in the same file which is already is saved.
STEP 6: open the cmd and correct the path and create the branch.
STEP 7: add the files.
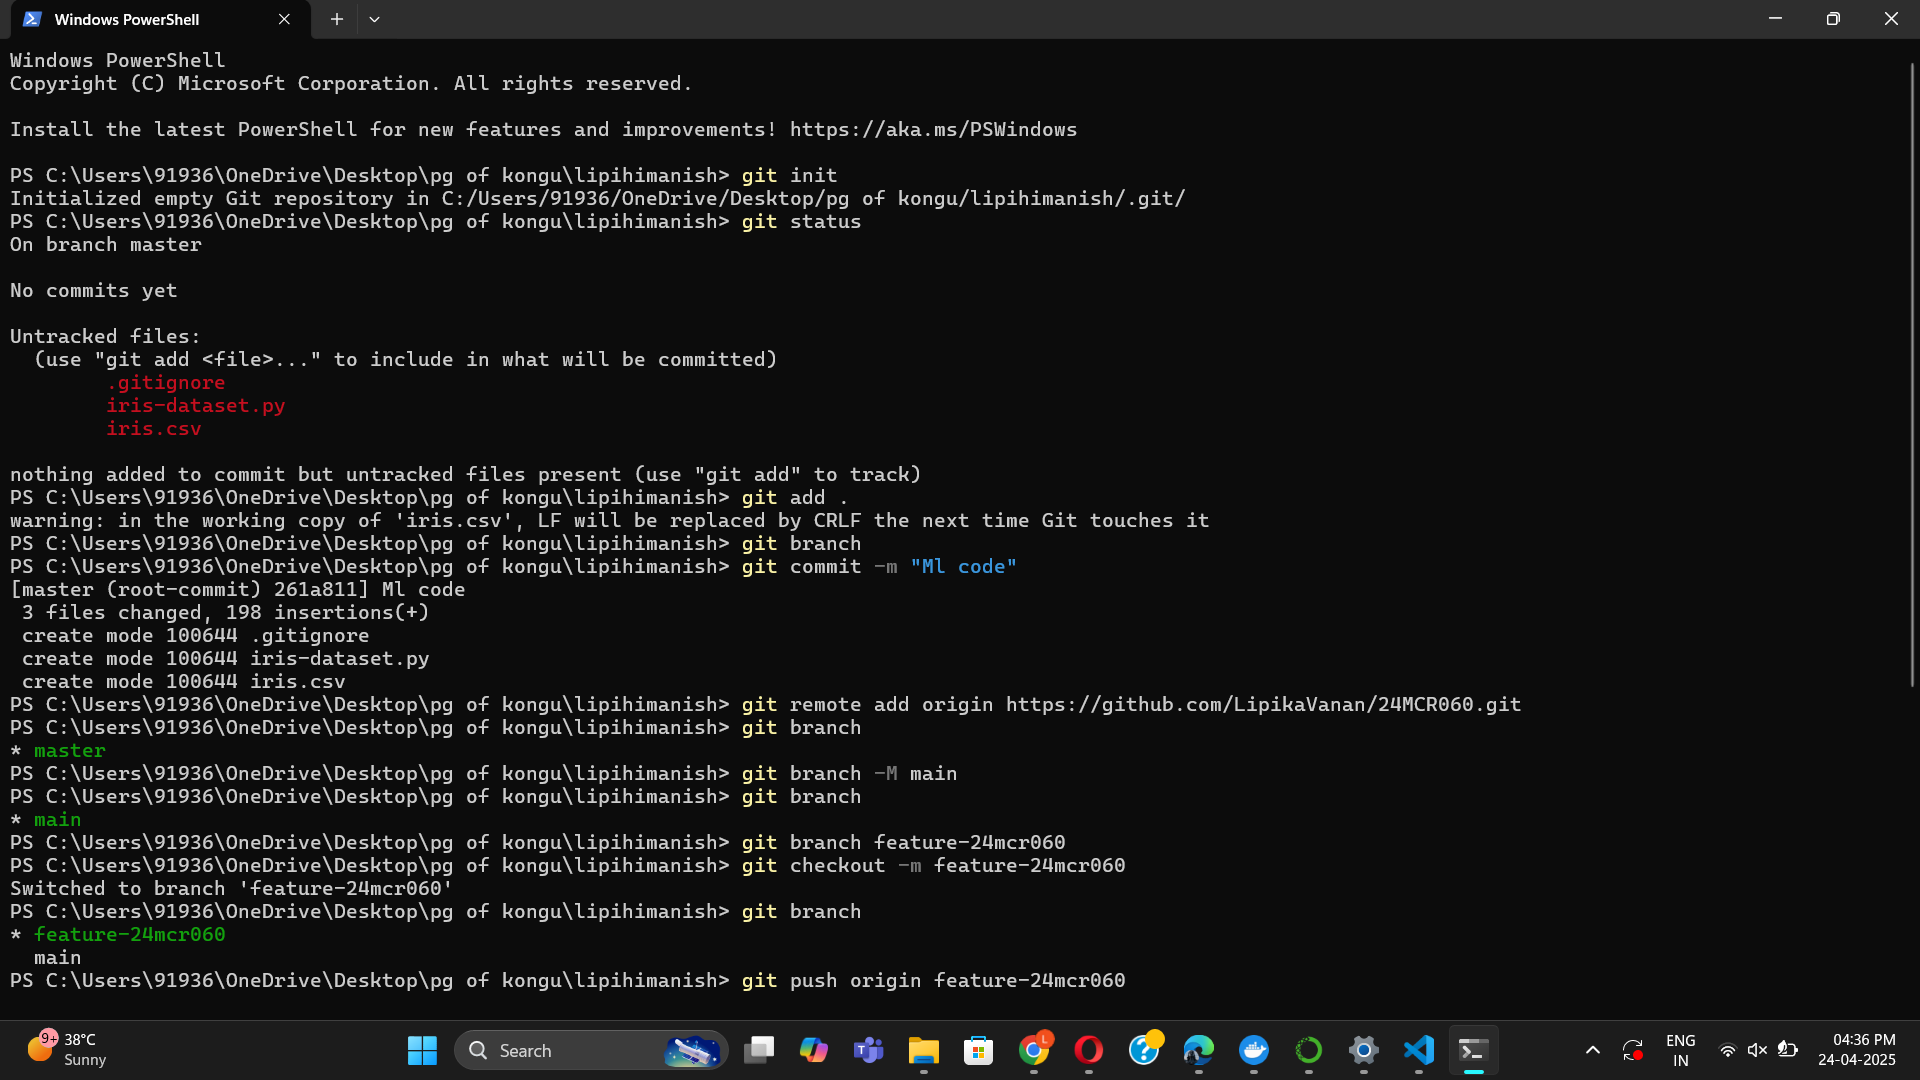
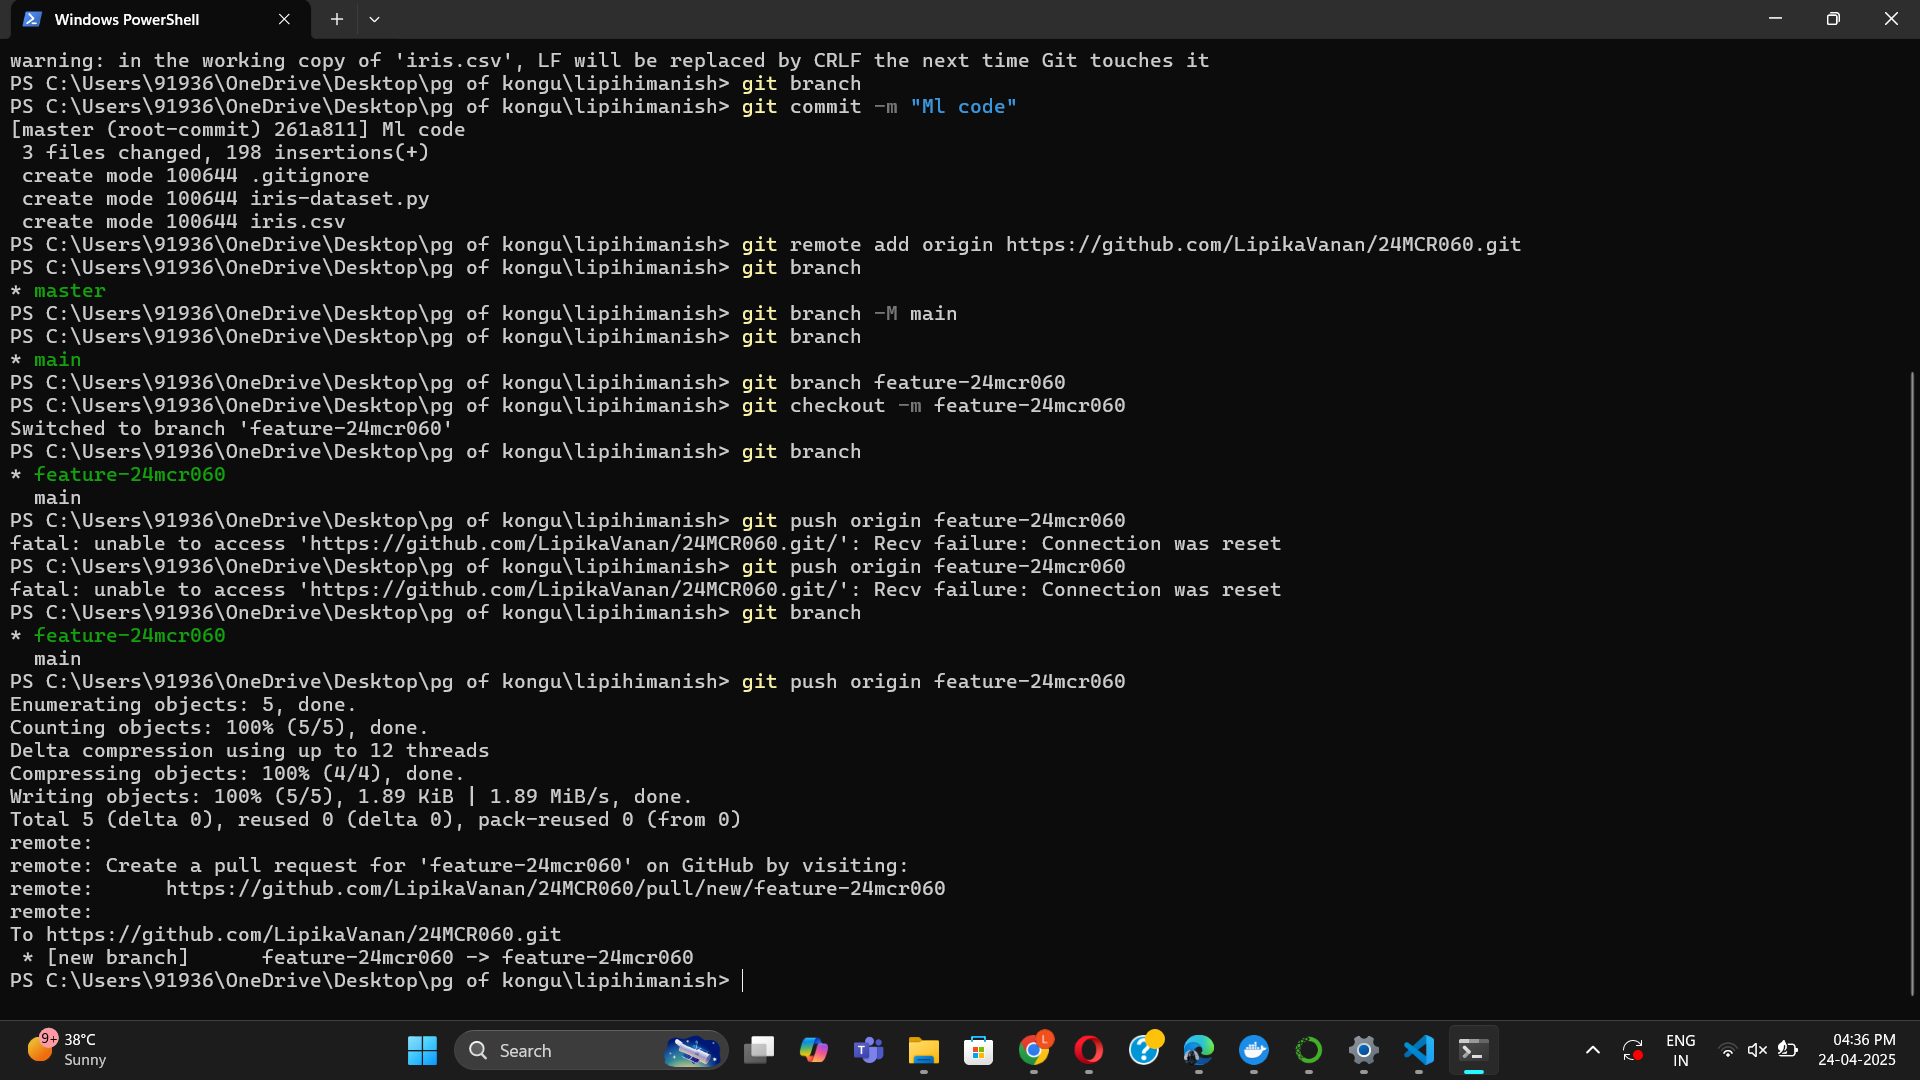
STEP 8: push them on the githup.
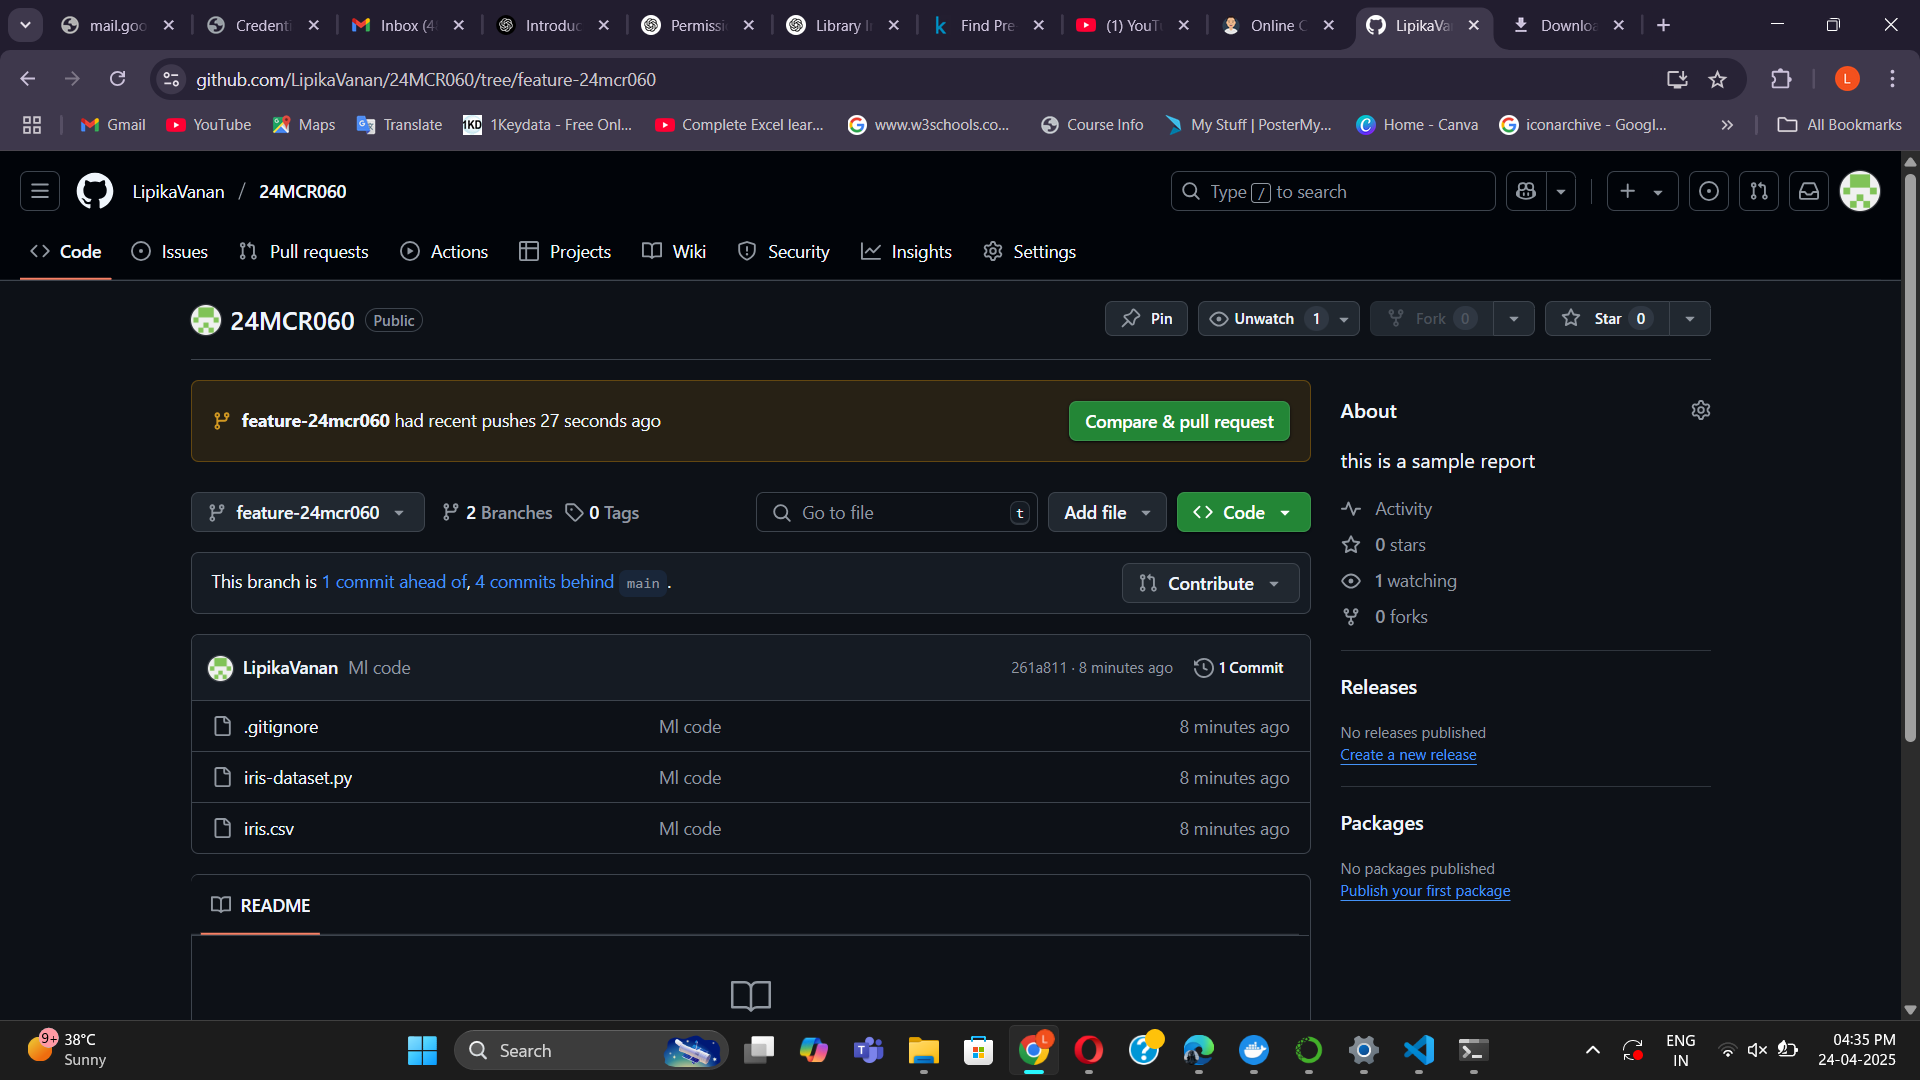
STEP 9: AFter open the githup and you can check them in that repository.
DOCKER COMMANDS
1.Check Docker version
Command:
docker --version

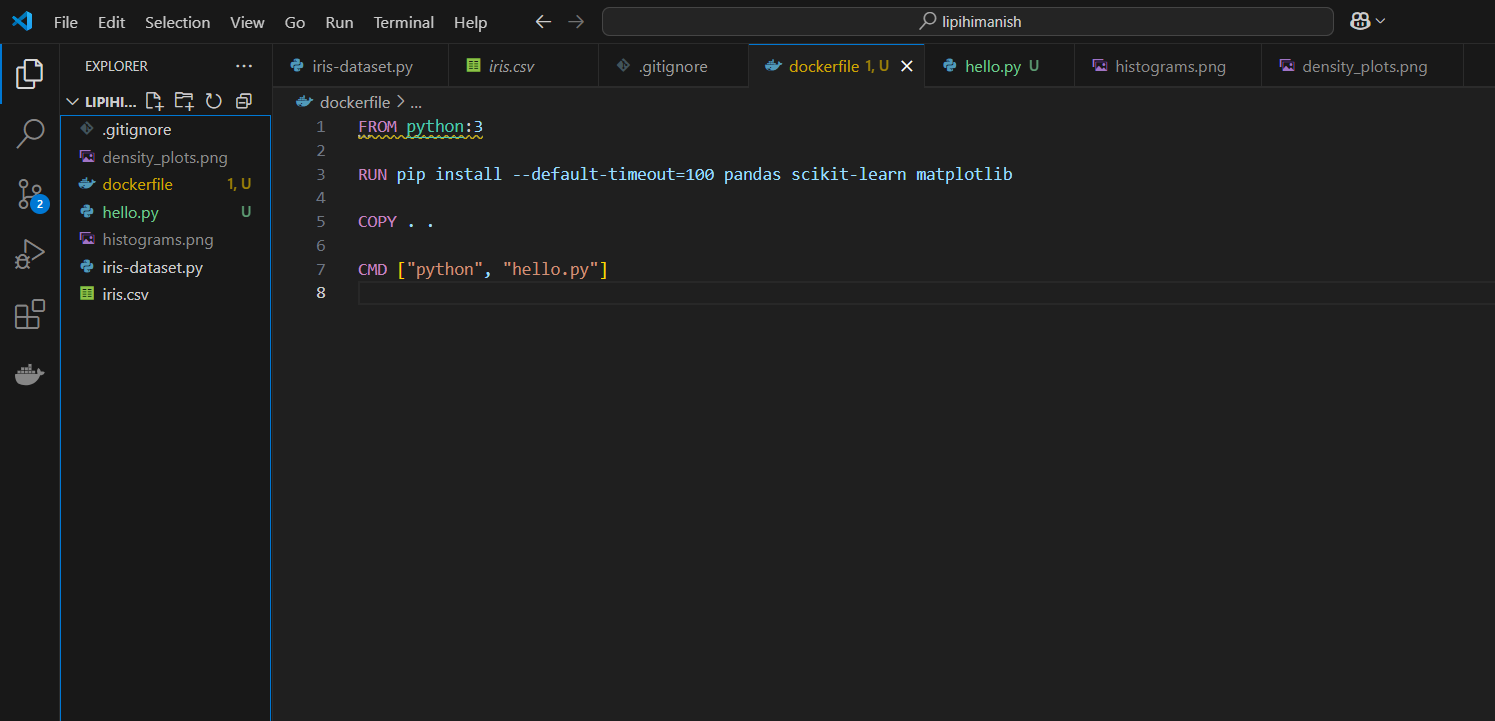
2.Create a Dockerfile in your project
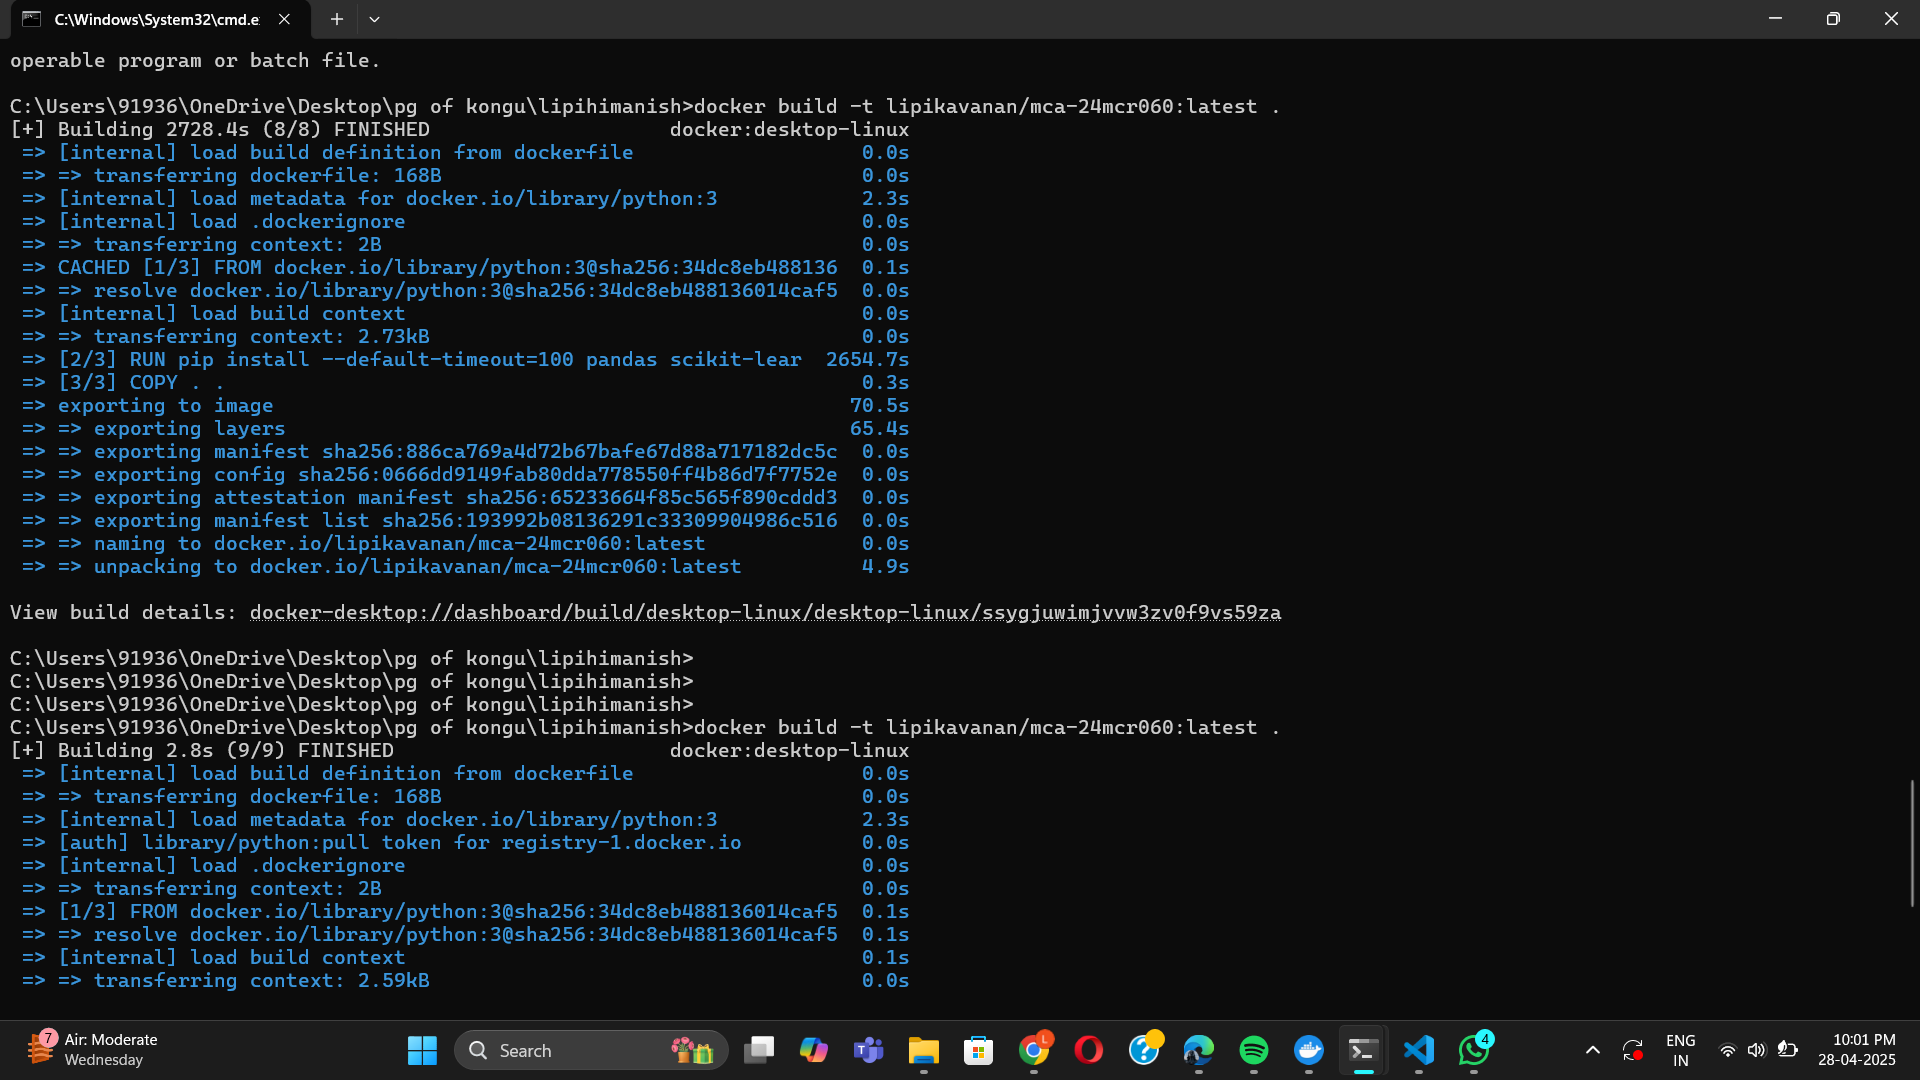
3.Build Docker image
Command:
docker build -t gokila07/mca-24mcr042-ml:latest .
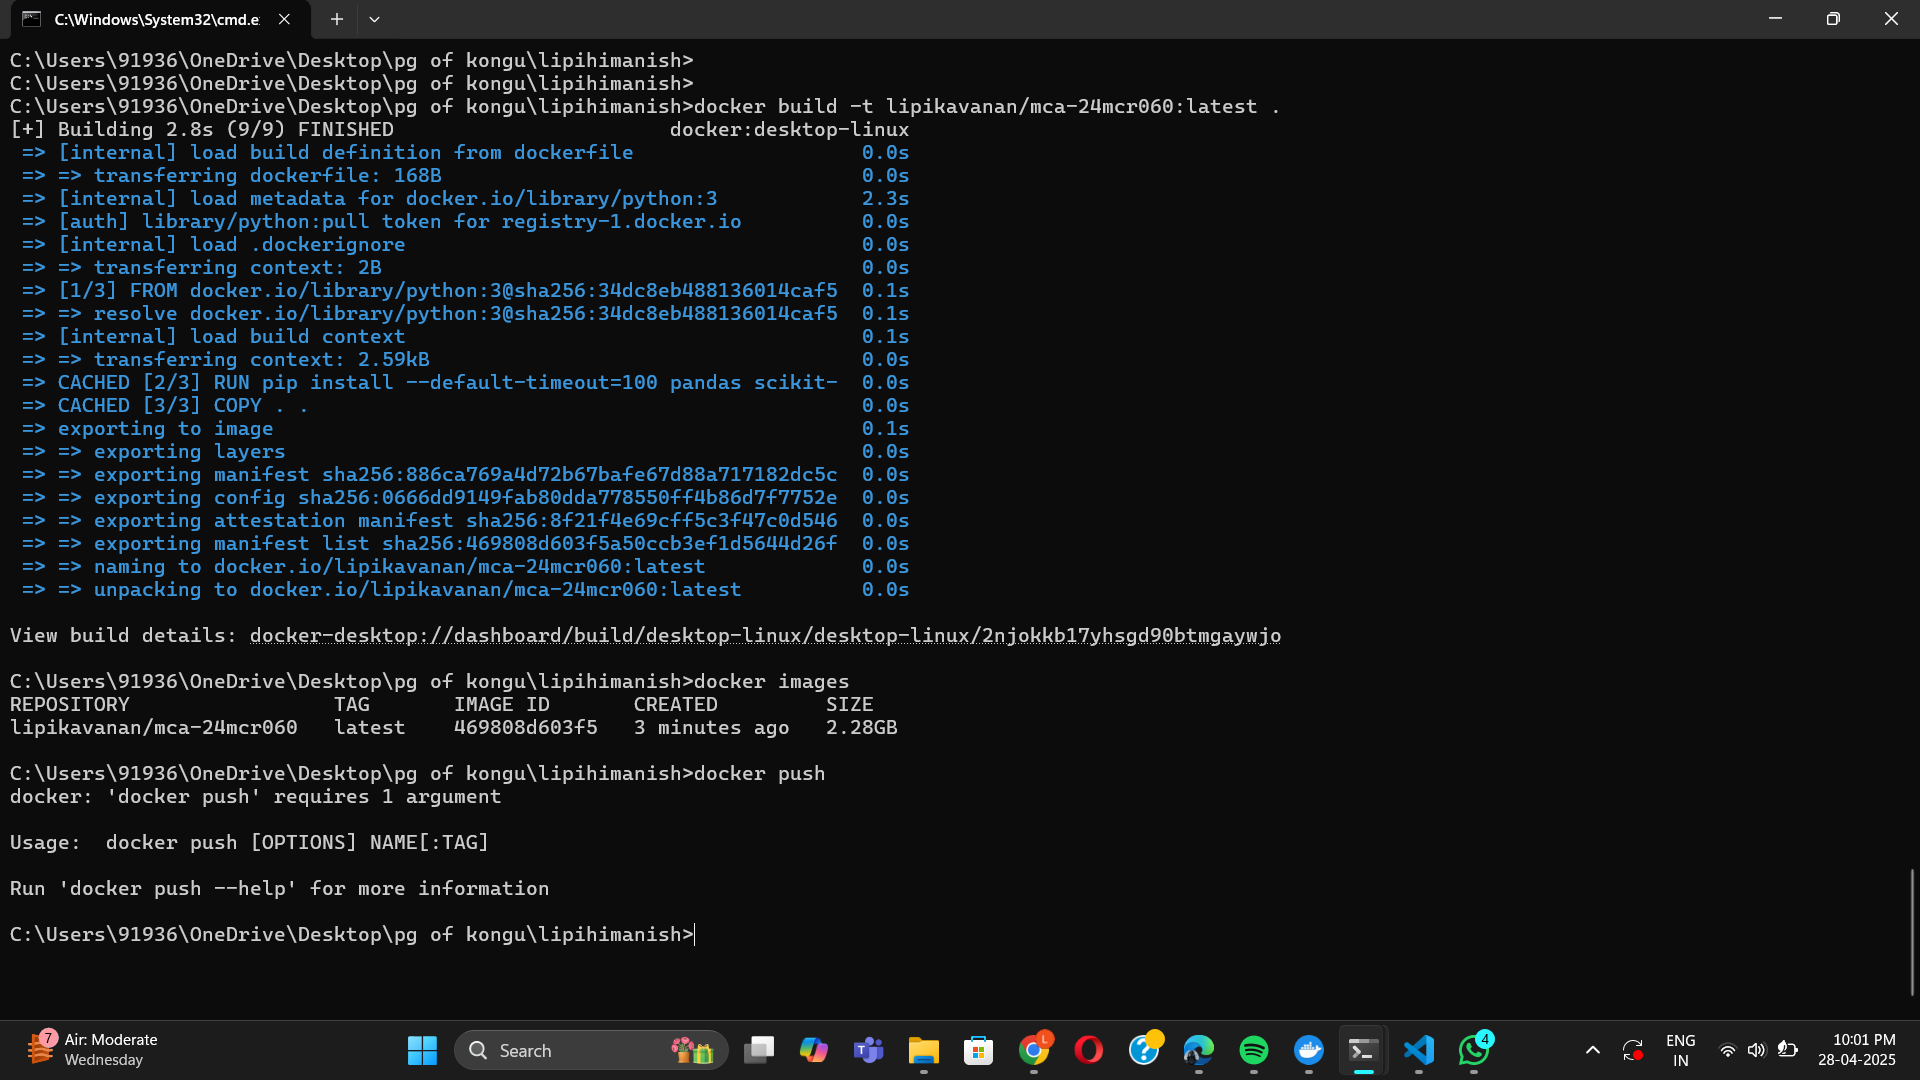
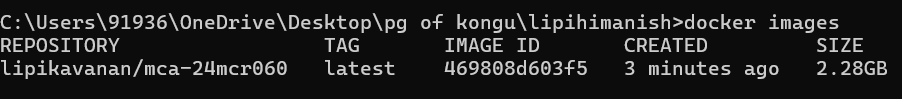
4.List Docker images
Command:
docker images
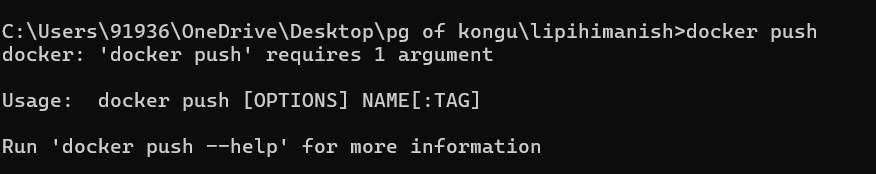
5.Push Docker image to DockerHub
Command:
docker push gokila07/mca-24mcr027
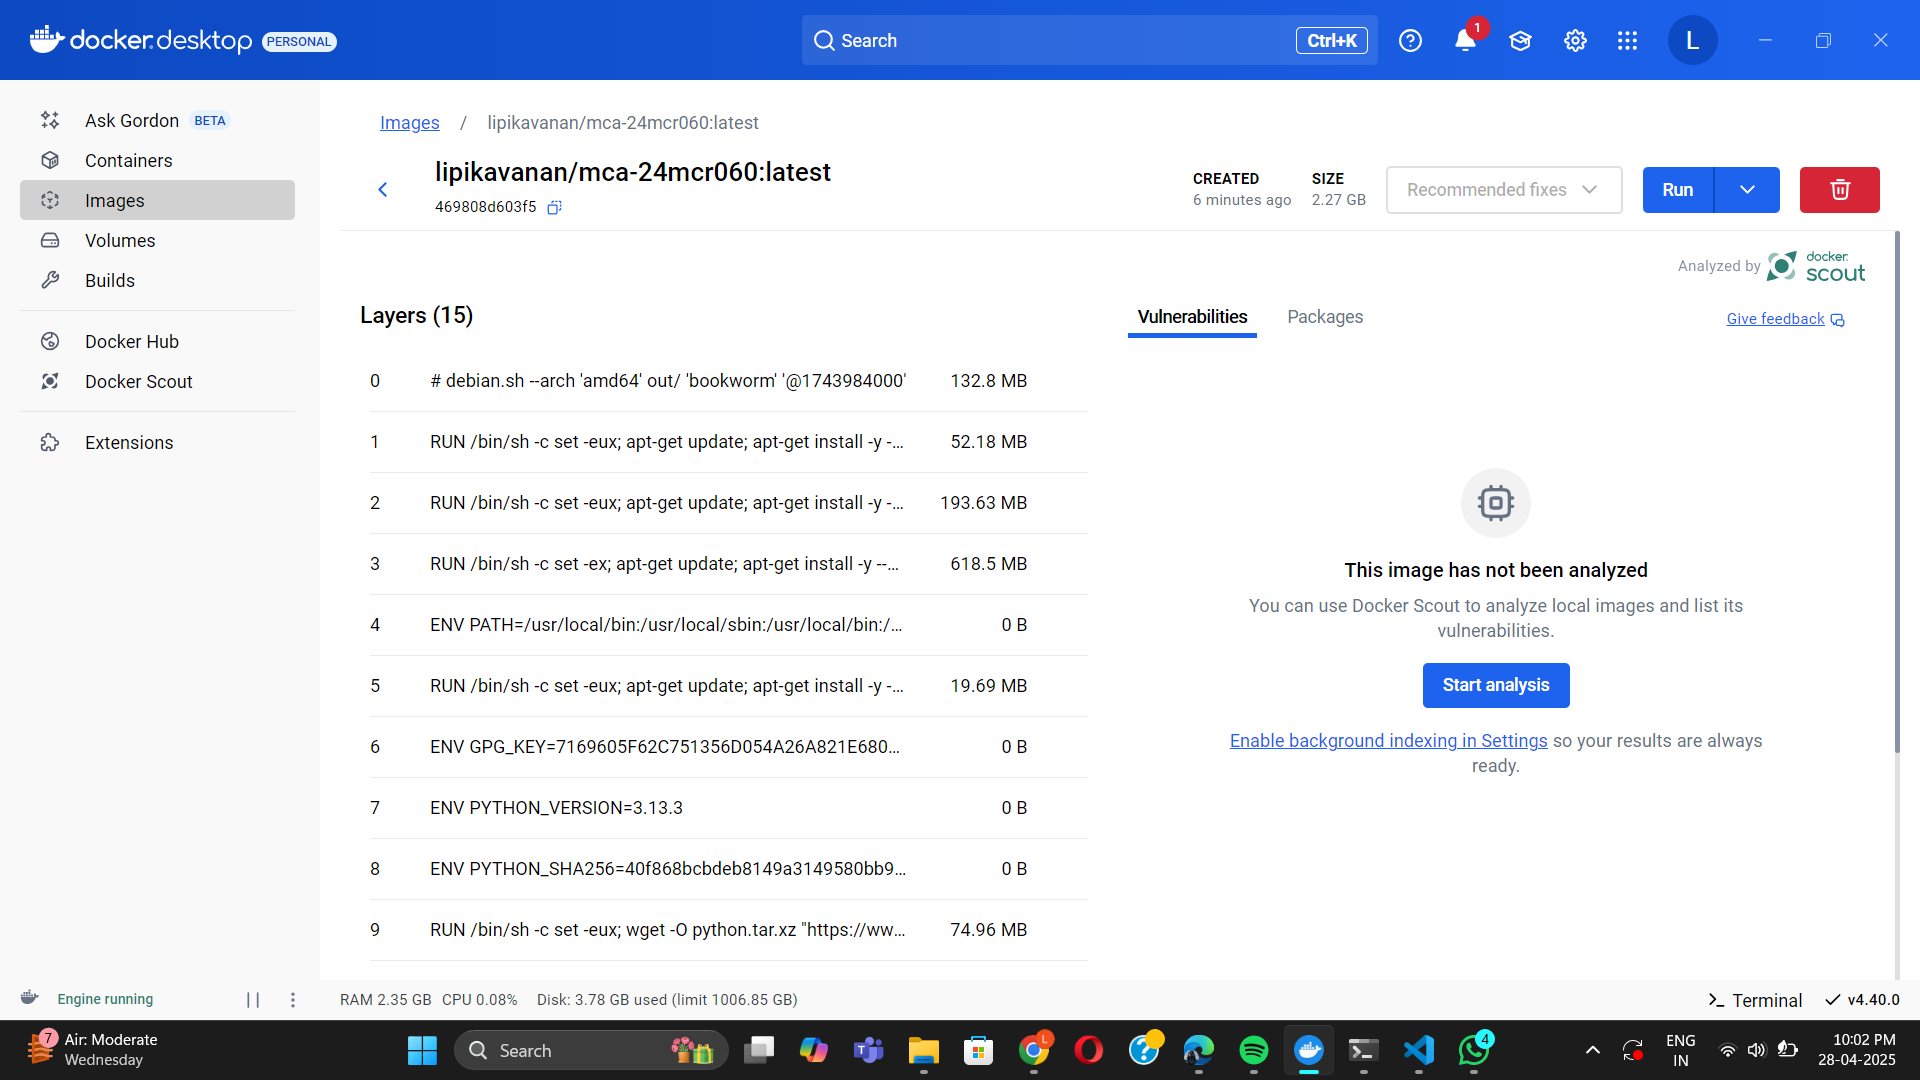
6.Open Docker Desktop to view images and containers
PUSH DOCKER FILE INTO GITHUB
Main branch
First Branch: feature-24mcr027
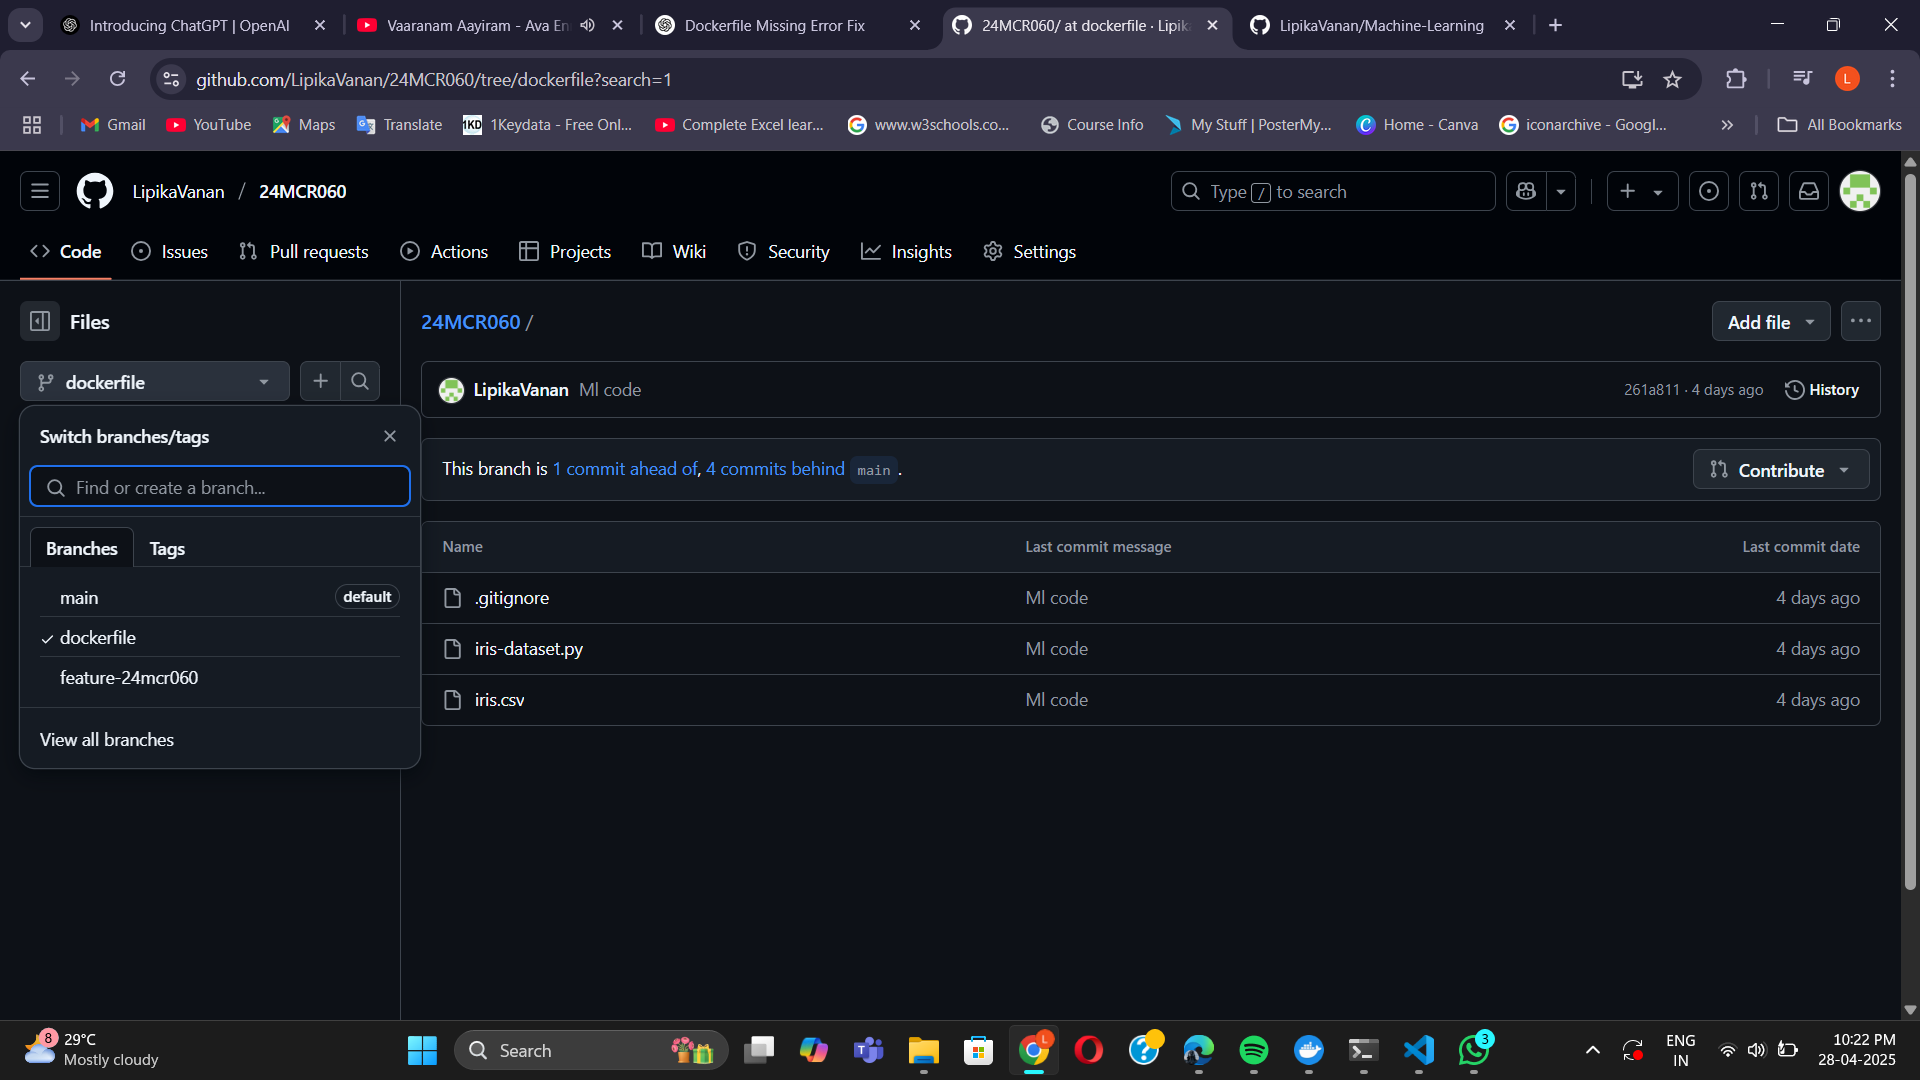
Second Branch: dockerfile