Meet
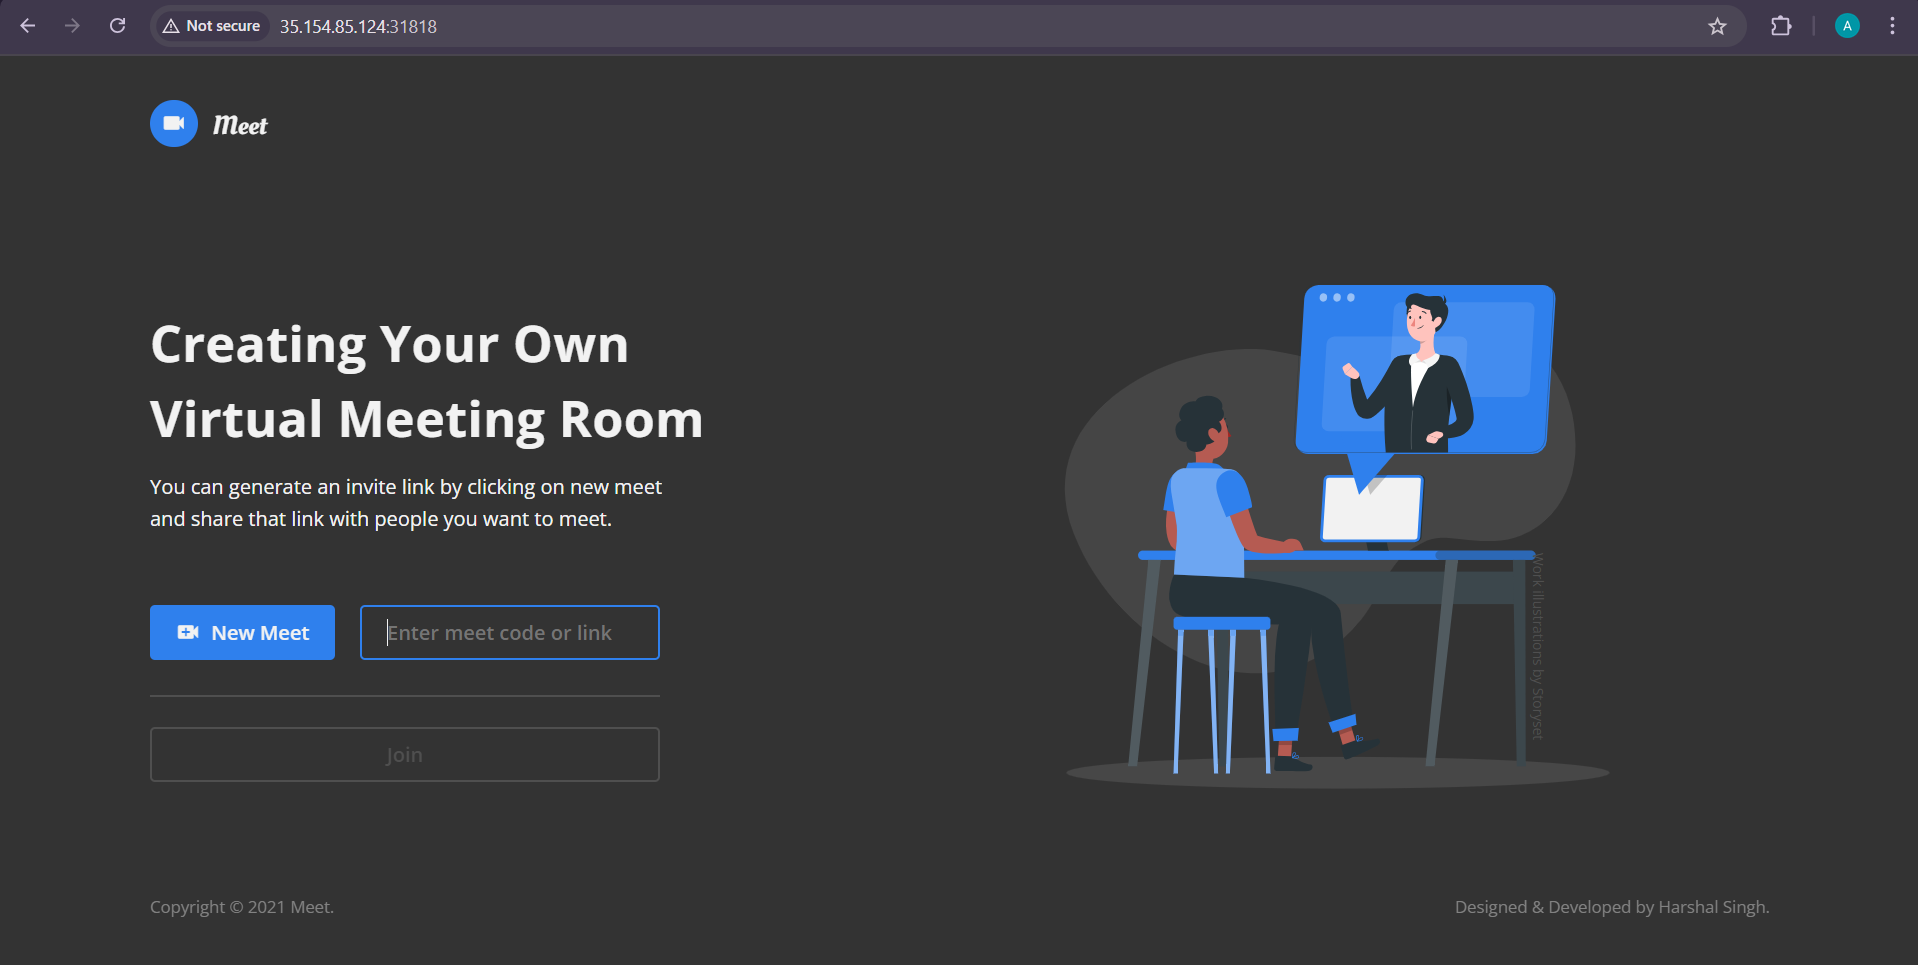
Meet is a web-based video conferencing service that allows users to hold real-time face-to-face meetings for free. It is ideal for various use cases such as company meetings, job training sessions, or board member discussions.
Features
- Join Meet: Easily join an existing meeting using a provided link or code.
- Create Meet: Host your own meeting and invite participants.
- Audio Controls: Mute and unmute your microphone during the meeting.
- Video Controls: Turn your camera on or off as needed.
- In-Call Chatting: Communicate with participants via text chat during the meeting.
- Link Sharing: Share the meeting link with others for easy access.
- Meet Code Sharing: Provide a unique meeting code for participants to join.
- Participants List: View a list of all attendees.
- Leave Meet: Exit the meeting when you are done.
Meet Project End-to-End Implementation
In this demo, we will deploy a fully functional Meet application on an AWS EKS (Elastic Kubernetes Service) cluster.
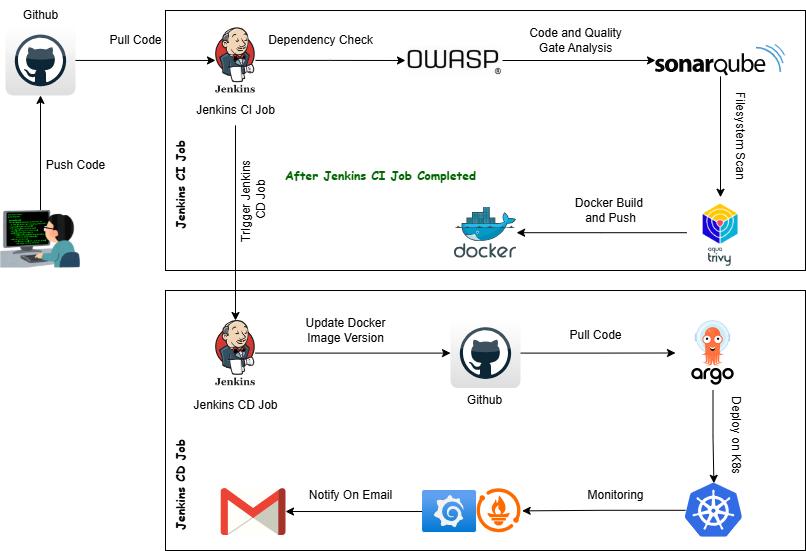
Project Deployment Flow:
Tech Stack Used in this Project
The following technologies are used in this project for deployment, monitoring, and management:
- GitHub (Source Code Management)
- Docker (Containerization)
- Jenkins (Continuous Integration - CI)
- OWASP Dependency Check (Security Scanning)
- SonarQube (Code Quality Analysis)
- Trivy (File System Security Scan)
- Argo CD (Continuous Deployment - CD)
- AWS EKS (Kubernetes Orchestration)
- Terraform (Infrastructure Provisioning)
- Ansible (Configuration Management)
- Helm (Monitoring using Grafana and Prometheus)
CI/CD Pipelines
CI Pipeline (Build & Push)
CD Pipeline (Application Deployment)
Argo CD Application Deployment on EKS
Prerequisites to Implement This Project
Why Use Google Cloud?
Google Cloud offers a $300 free credit for three months, making it an excellent choice for provisioning heavy instances without incurring costs. This allows us to set up and test our EKS infrastructure efficiently.
Master Node Setup
Note:
This instance will act as the master node and will be used for all EKS cluster operations using Kubectl. It will also be used for Jenkins and Argo CD operations.
- Create a new Ubuntu 22.04 LTS instance on Google Cloud
- Machine Type:
e2-standard-2 - RAM:
8GB - vCPUs:
2 -
Storage:
30GB-
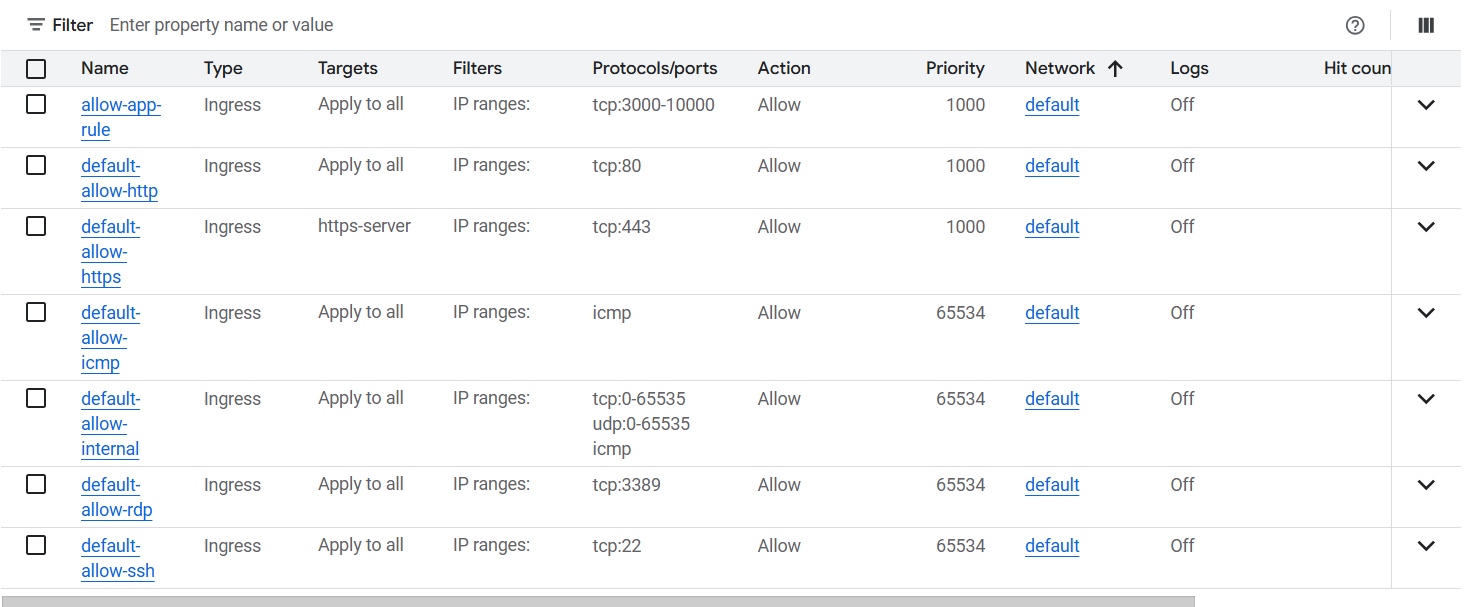
Open the required ports in firewall rules for the master node
- Add Public Key to the instance before creation
-
Open the required ports in firewall rules for the master node
Navigate to Security > Scroll Down to Manage Access > Add Key
Paste the Public Key and save it
Ansible Provisioner VM Setup
Note:
This instance is used only for configuration and package installations via Ansible. It is not recommended to run any other workloads on this instance.
- Create a new Ubuntu 22.04 LTS instance on Google Cloud
- Machine Type:
e2-medium - RAM:
4GB - vCPUs:
2 -
Storage:
10GB- Install Ansible on the instance
Use the following script to install Ansible:
#!/bin/bash

# Exit immediately if a command fails
set -e

run_silent() {
    "$@" >/dev/null 2>&1
}

echo "🔄 Updating package lists..."
run_silent sudo apt update -y

echo "📦 Installing required dependencies..."
run_silent sudo apt install -y software-properties-common

echo "➕ Adding Ansible PPA repository..."
run_silent sudo apt-add-repository --yes --update ppa:ansible/ansible

echo "🚀 Installing Ansible..."
run_silent sudo apt install -y ansible

# Verify installation
echo "✅ Ansible installed successfully!"
ansible --version- Clone the Meet repository
git clone https://github.com/rcheeez/meet.git- Create an SSH key pair for secure remote access
To enable Ansible to connect and configure the master instance properly, generate an SSH key pair and add the public key to the master instance.
cd ~/.ssh
ssh-keygen
This creates an SSH key pair. The public key must be added to the master node to allow secure connections.
- Configure the Ansible hosts file
- Open the hosts file:
sudo vim /etc/ansible/hosts- Add the following configuration:
[master]
   master_server ansible_host=

   [master:vars]
   ansible_python_interpreter=/usr/bin/python3
   ansible_user=
ansible_ssh_private_key_file=/home//.ssh/- Set proper permissions for the private key
sudo chmod 600 /home//.ssh/- Install the required Ansible collections
ansible-galaxy collection install community.docker- Run the Ansible playbook to configure the master node
ansible-playbook -i /etc/ansible/hosts master_server_tools_play.ymlNOTE
Make sure the Master Node is up and running and also make sure the Public key is added to the Master Node.
This will setup all the configuration on the Master Node.
🌍 Terraform Configuration for EKS on Google Cloud Shell
We will use Google Cloud Shell to provision our AWS EKS infrastructure using Terraform. Since Terraform is already installed in Google Cloud Shell, we can directly execute our infrastructure provisioning commands without any additional setup.
This approach eliminates the need for external applications and leverages Google's free cloud credits for cost-effective provisioning.
🛠 Steps to Set Up Terraform on Google Cloud Shell
1️⃣ Launch Google Cloud Shell
- Open Google Cloud Console
- Click on Activate Cloud Shell
2️⃣ Clone the Terraform Repository
git clone https://github.com/rcheeez/meet.git
cd meet/terraform/
3️⃣ Initialize Terraform
terraform init4️⃣ Apply Terraform Configuration to Provision EKS Cluster
terraform plan
terraform apply --auto-approve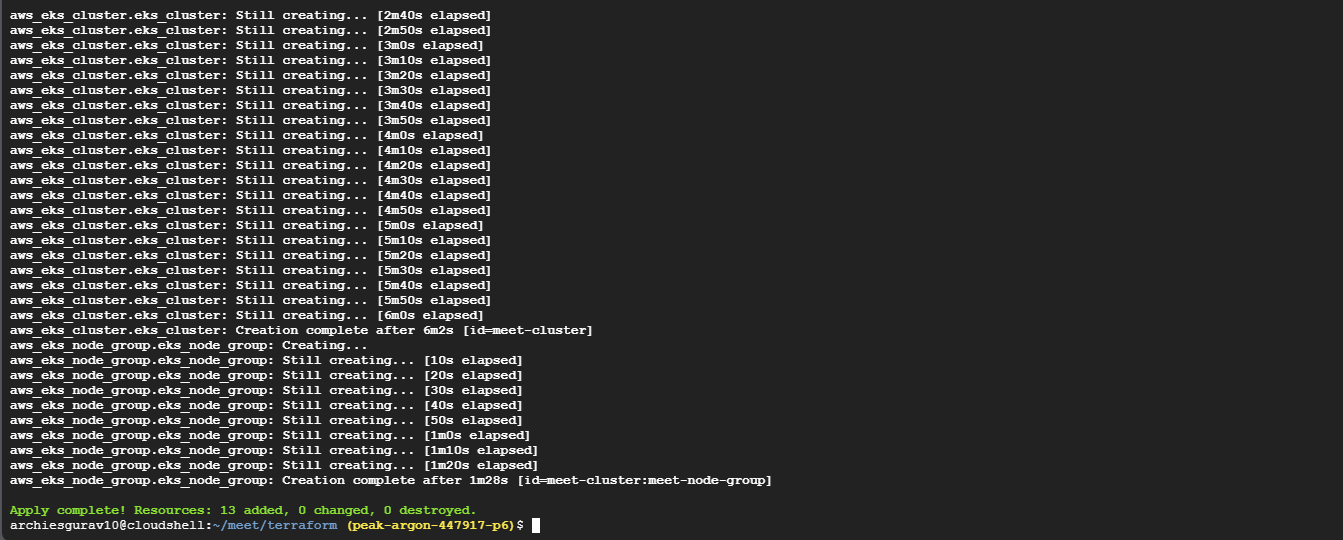
🚀 Setting Up Jenkins & Installing Required Plugins
1️⃣ Install Required Plugins
- Navigate to Jenkins > Manage Jenkins > Plugins > Available Plugins
- Install the following plugins:
- OWASP Dependency Check
- Docker Pipeline
- Pipeline: Stage View Plugin
-
SonarQube Scanner
- After installing these plugins, restart Jenkins to apply the changes.
⚙️ Setting Up Tools
Navigate to Jenkins > Manage Jenkins > Tools and configure the required tools:
1️⃣ Add SonarQube Scanner
-
Name:
sonarqube - Installation: Install Automatically
2️⃣ Add OWASP Dependency Check
-
Name:
OWASP - Installation: Install Automatically from GitHub
3️⃣ Add Docker
-
Name:
docker - Installation: Install Automatically from Docker (latest version)
🔧 Configuring SonarQube for Jenkins Integration
After adding the required tools, we need to integrate SonarQube with Jenkins by creating an authentication token and setting up a webhook for automated analysis.
1️⃣ Generating a SonarQube Token for Jenkins
- Navigate to SonarQube > User > Security > Tokens
- Click on Generate Token and provide a name (e.g.,
jenkins-sonar-token) - Copy the generated token and save it securely
2️⃣ Adding SonarQube Token in Jenkins
- Navigate to Jenkins > Manage Jenkins > Credentials
- Add a new credential with:
-
ID:
sonar-token - Type: Secret Text
- Secret: Paste the copied SonarQube token
-
ID:
(Refer to the next section for detailed steps on adding credentials in Jenkins.)
3️⃣ Setting Up a SonarQube Webhook for Jenkins
- Login to SonarQube and navigate to Administration > Webhooks
- Click Create and configure the webhook to point to your Jenkins server URL
- This enables automatic triggering of SonarQube analysis after each Jenkins build
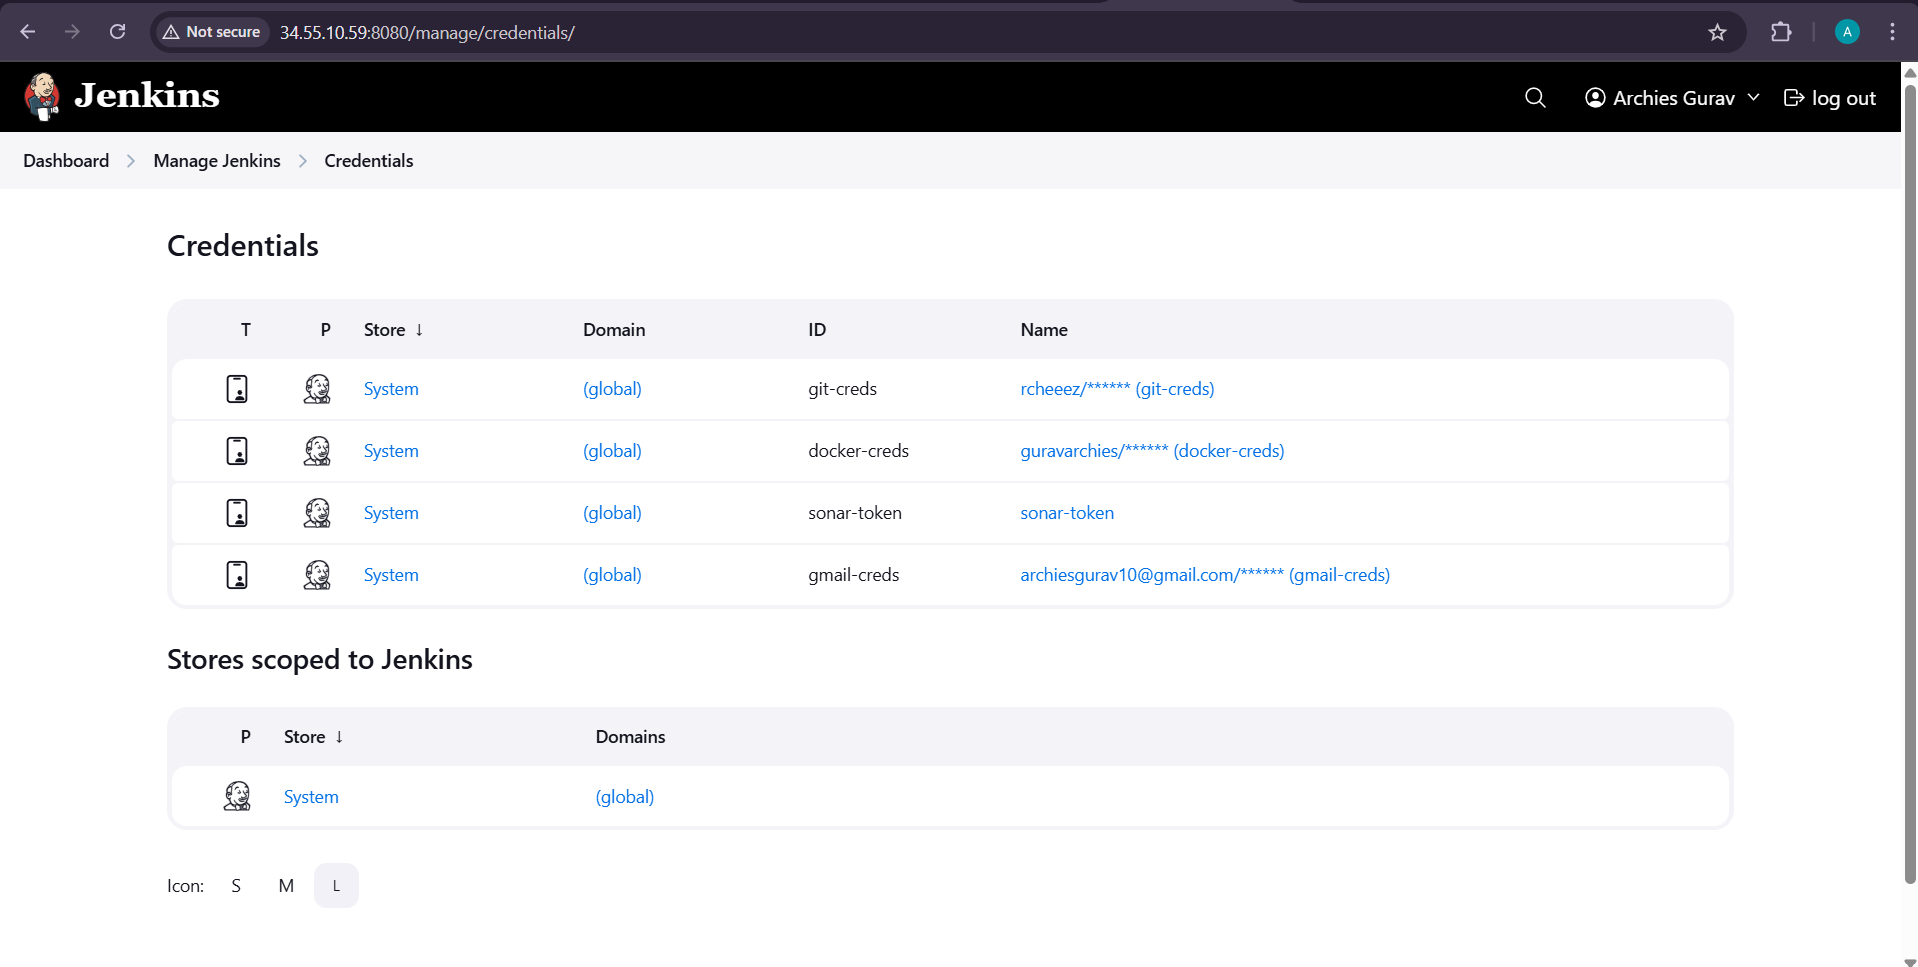
🔐 Configuring Credentials for the Pipeline
Navigate to Jenkins > Manage Jenkins > Credentials > Credentials Provider and add the following credentials:
1️⃣ Git Credentials
-
ID:
git-creds - Description: Git Credentials
- Type: Username with Password
- Username: Your Git Username
- Password: Your Git Personal Access Token
2️⃣ Docker Credentials
-
ID:
docker-creds - Description: Docker Credentials
- Type: Username with Password
- Username: Your Docker Hub Username
- Password: Your Docker Personal Access Token
3️⃣ SonarQube Token
-
ID:
sonar-token - Description: SonarQube Token
- Type: Secret Text
- Secret: Your SonarQube API Token
4️⃣ Gmail Credentials
-
ID:
gmail-creds - Description: Gmail Credentials
- Type: Username with Password
- Username: Your Gmail Email
- Password: Your Google Account App Password
✅ Final Step
📌 Ensure all credentials are added correctly as shown in the reference image.
Configuring the System in Jenkins
After setting up the credentials, follow these steps to configure the system in Jenkins:
1️⃣ Access Jenkins System Configuration
- Navigate to Jenkins > Manage Jenkins > System
- Click on Configure System
2️⃣ Set System Email Address
- Under Jenkins Location, set the System E-mail address to your Gmail account.
3️⃣ Configure SonarQube Servers
- Add a new SonarQube Server entry.
- Provide a name for the server, enter the server URL, and set up authentication credentials.
4️⃣ Set Up Global Trusted Pipeline Libraries
- Add a new Shared Library entry.
- Provide:
- Library name
- Git repository URL
- Project repository branch name
- Credentials (if the Jenkins Shared Library repository is private)
5️⃣ Configure Git Plugin
- Locate Git Plugin settings in the configuration.
- Fill in the following fields:
- Git Global Config user.name → Enter your Git username
- Git Global Config user.email → Enter your Git email
6️⃣ Set Up Email Notifications
🔹 Extended Email Notification:
- Configure the SMTP server and port.
- Add authentication credentials and enable SSL.
🔹 Email Notification:
- Configure the SMTP server, port, and credentials.
- Enable SSL.
- Test the configuration by sending a test email to verify the setup.
🚀 Creating CI and CD Jenkins Pipelines
After configuring the system, follow these steps to create CI and CD Jenkins pipelines for the Meet application.
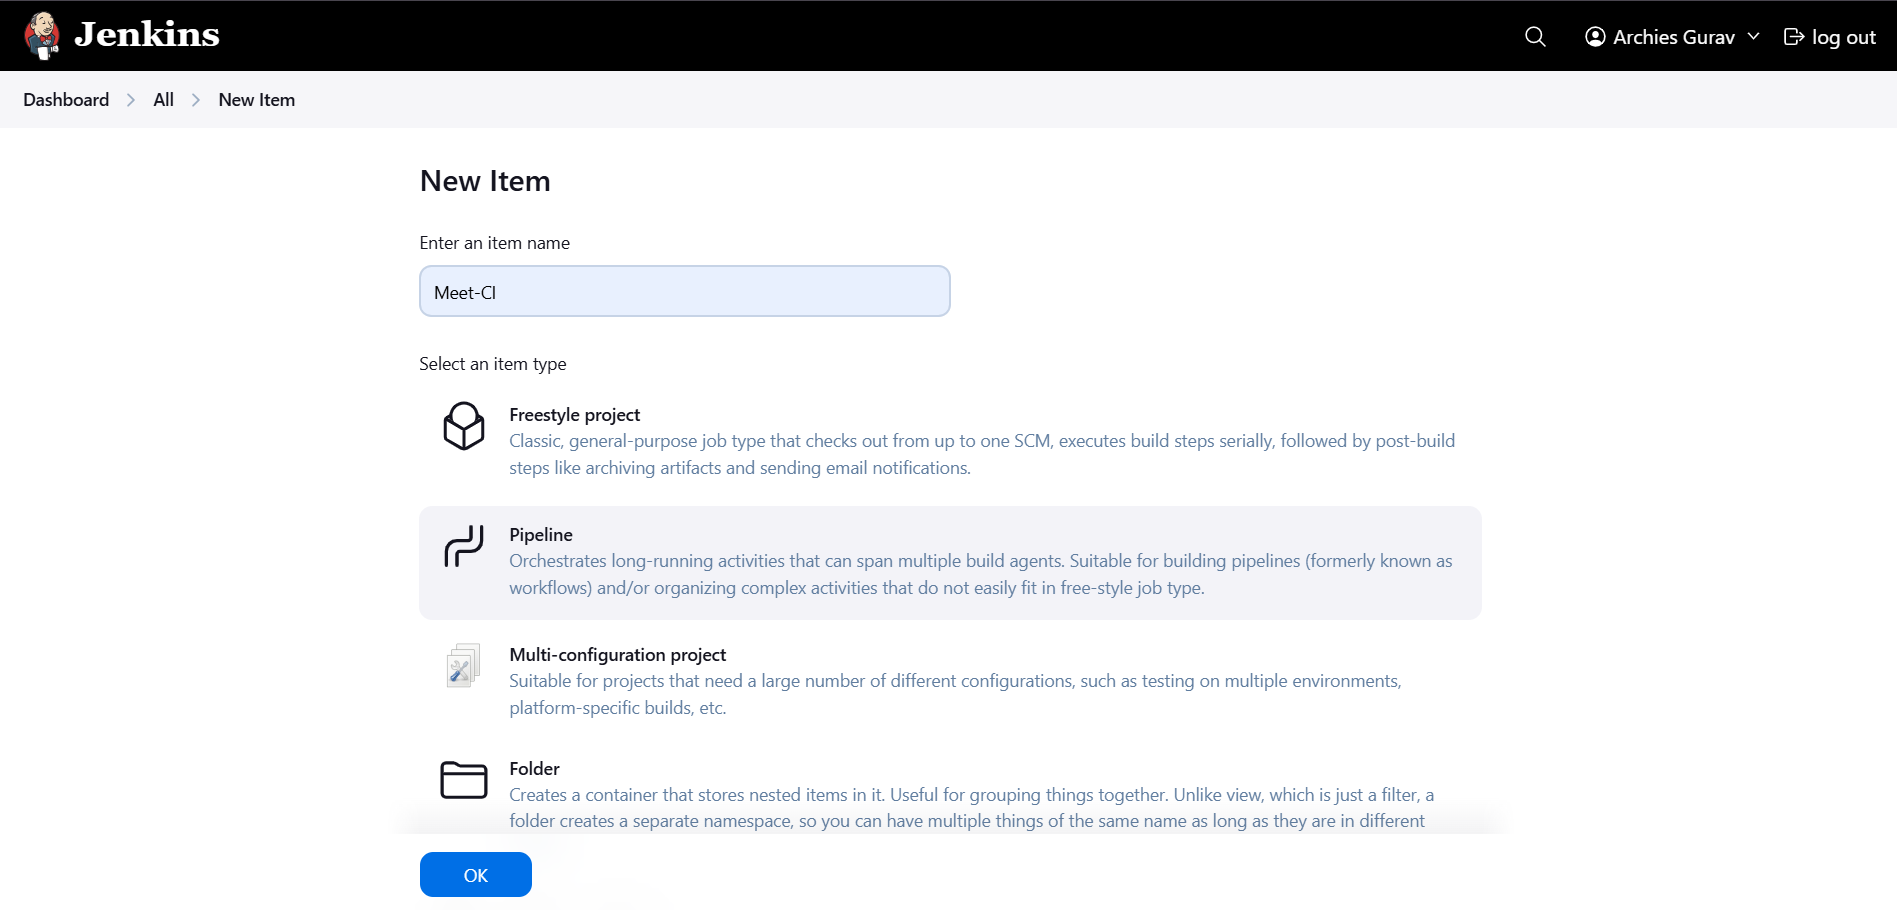
📌 1️⃣ Creating the Jenkins CI Pipeline (Meet-CI)
Step 1: Create a New Jenkins Pipeline Job
- Open Jenkins Dashboard → Click on New Item
- Enter Job Name:
Meet-CI - Select Pipeline as the project type
- Click OK to create the job
Step 2: Configure the Pipeline
- Scroll down to the Pipeline section
-
Under Definition, choose Pipeline script from SCMOption 1: Using SCM (Recommended)
- SCM: Select Git
- Repository URL: Add your GitHub repository URL
- Credentials: Add Git credentials if required(if repository is private)
-
Branch: Select the branch where the Jenkinsfile exists (e.g.,
main) -
Script Path: Set it as
Jenkinsfile
Option 2: Manually Copying the Jenkinsfile
- Select Pipeline script
- Manually paste the contents of
Jenkinsfilefrom thegitopsfolder
🖼️ Screenshot: Jenkins CI Pipeline Configuration
📌 2️⃣ Creating the Jenkins CD Pipeline (Meet-CD)
Step 1: Create a New Jenkins Pipeline Job
- Open Jenkins Dashboard → Click on New Item
- Enter Job Name:
Meet-CD - Select Pipeline as the project type
- Click OK to create the job
Step 2: Configure the Pipeline
- Scroll down to the Pipeline section
- Under Definition, choose one of the two options:
Option 1: Using SCM (Recommended)
- SCM: Select Git
- Repository URL: Add your GitHub repository URL
- Credentials: Add Git credentials if required (if repostiory is private)
-
Branch: Select the branch where the Jenkinsfile exists (e.g.,
main) -
Script Path: Set it as
gitops/Jenkinsfile
Option 2: Manually Copying the Jenkinsfile
- Select Pipeline script
- Manually paste the contents of
Jenkinsfilefrom thegitopsfolder- Click Save
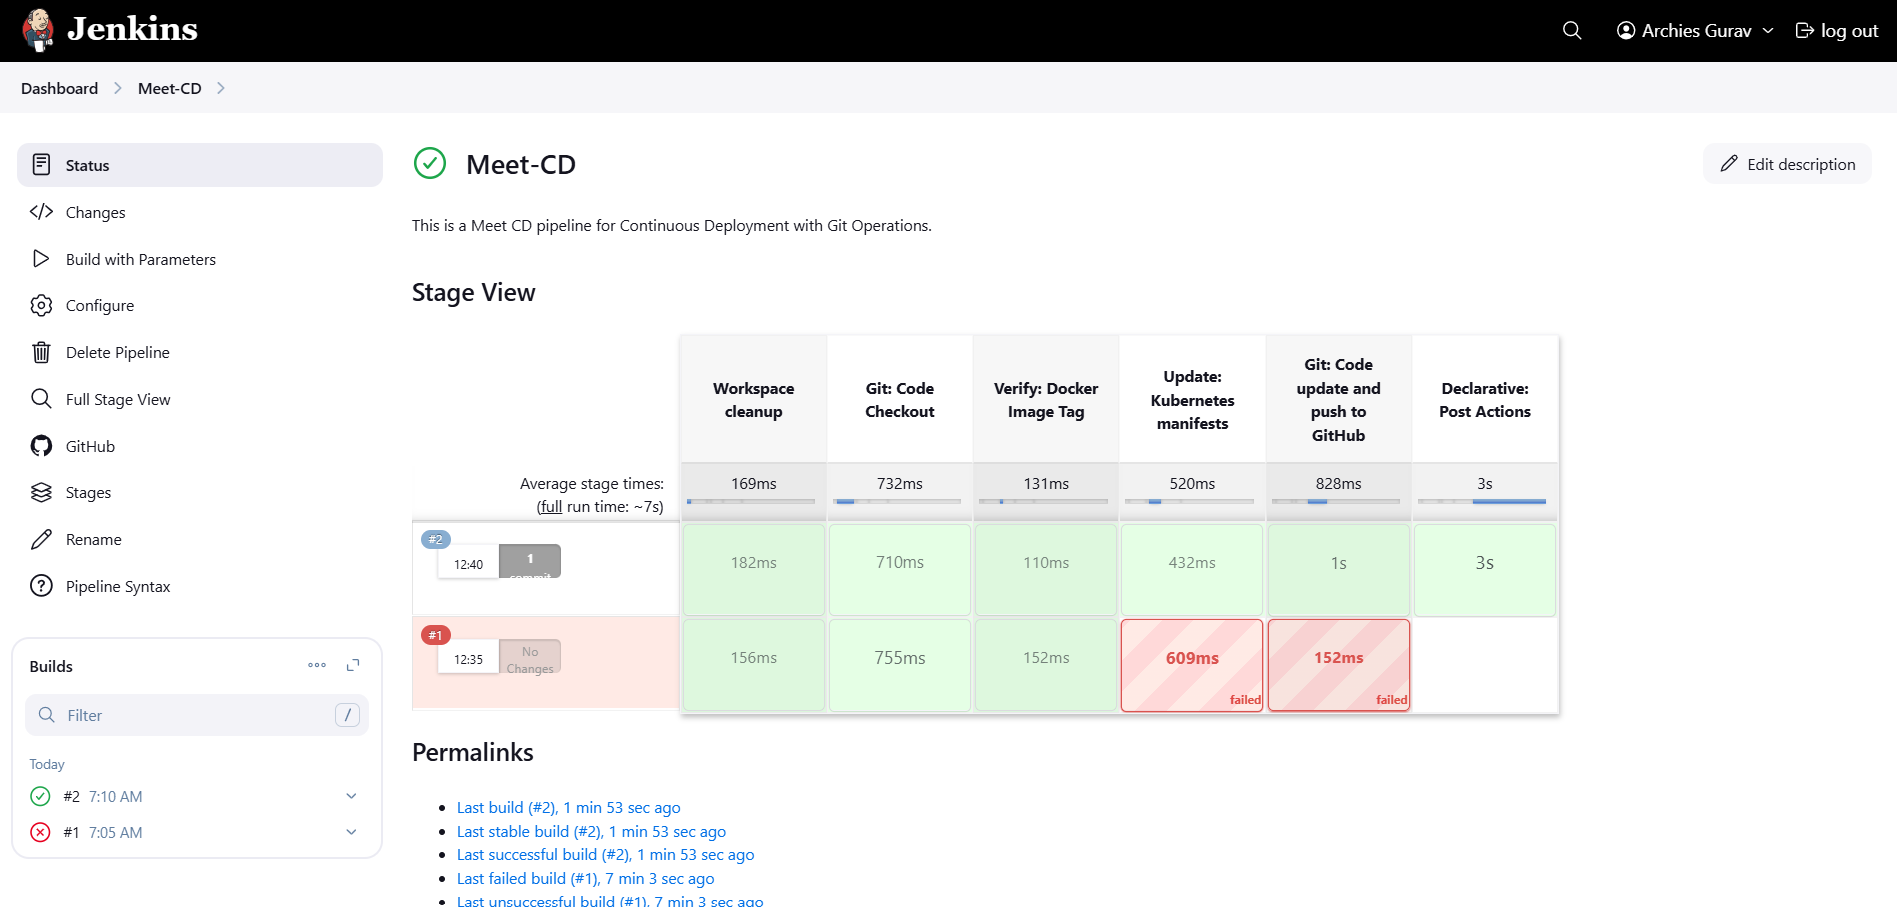
🖼️ Screenshot: Jenkins CD Pipeline Configuration

🎯 Now your CI/CD pipelines are ready!
- Meet-CI will handle building, testing, and pushing images
- Meet-CD will handle deployments via ArgoCD

🚀 Running the CI/CD Pipelines
Now that Jenkins is set up, let's run the pipelines.
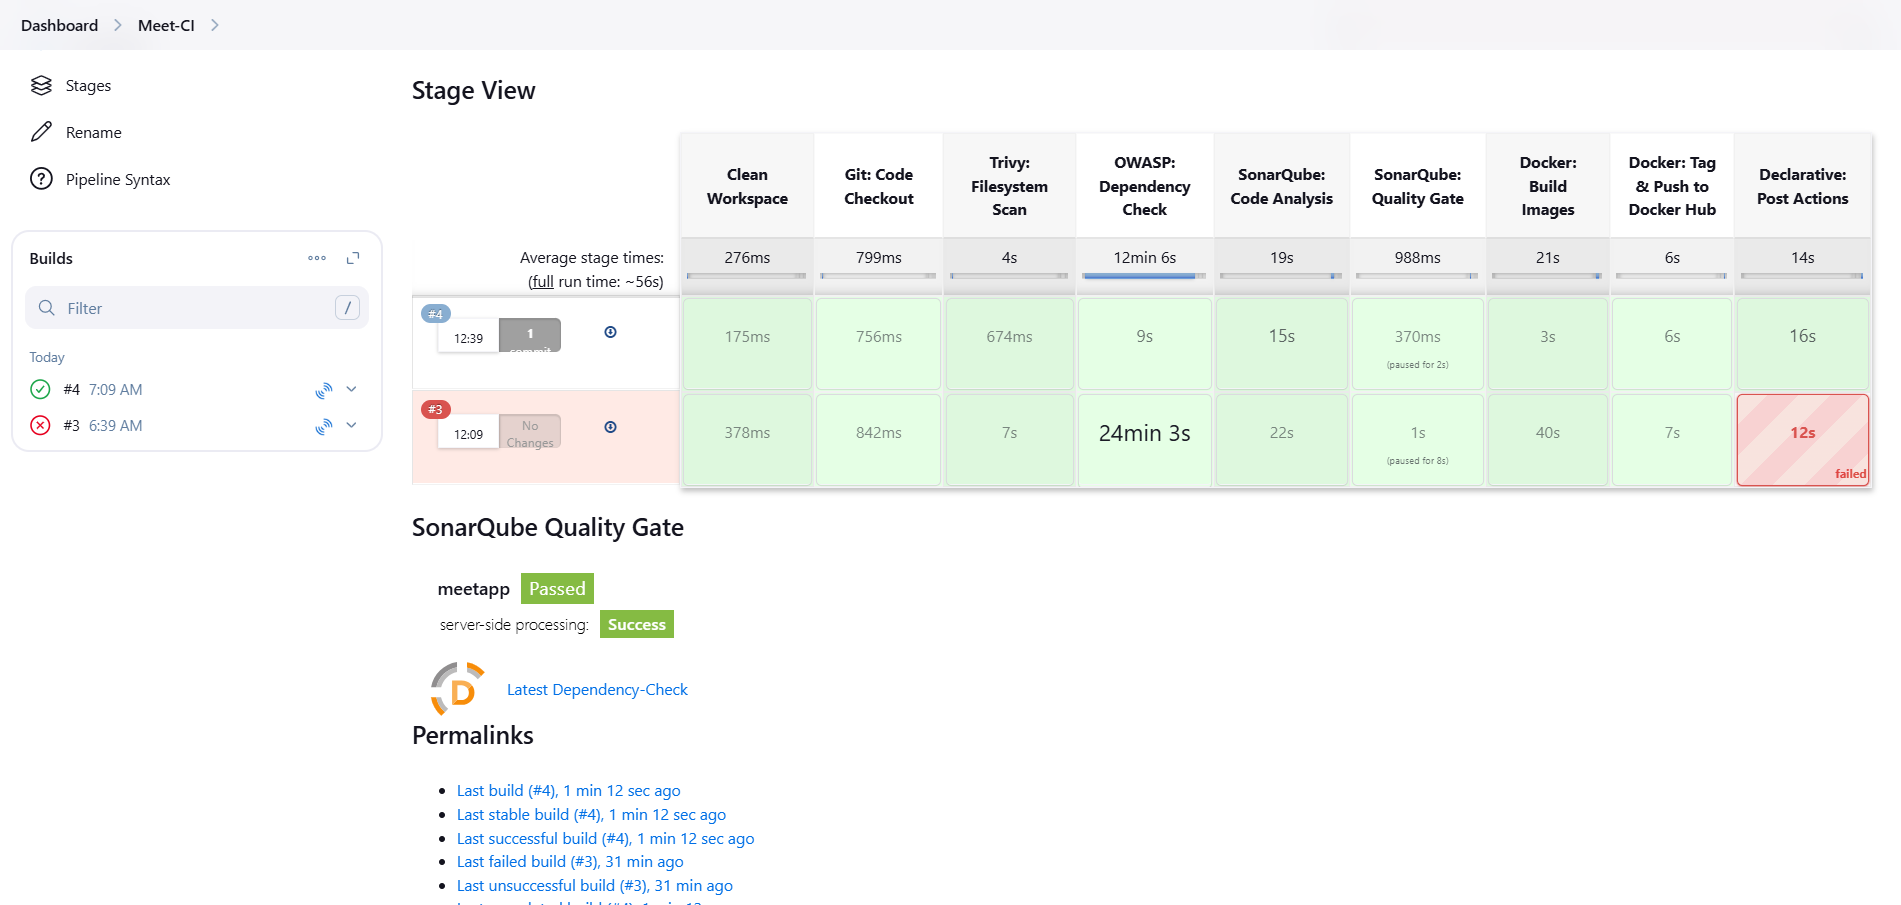
1️⃣ Run the CI Pipeline
- Navigate to Jenkins > Meet-CI
- Click Build Now
- Monitor the pipeline execution to ensure successful build, test, and push steps
2️⃣ Run the CD Pipeline
- Navigate to Jenkins > Meet-CD
- Click Build Now
- This will trigger the deployment process using ArgoCD
Once the pipelines have successfully run, we can now set up ArgoCD on EKS for automated deployments.
🚀 Setting Up ArgoCD on EKS for CI/CD Deployment
Before deploying applications via ArgoCD, we need to connect kubectl to our EKS cluster and install ArgoCD.
🔗 Connecting kubectl to EKS Cluster
1️⃣ Ensure AWS CLI is configured
Before running the following command, make sure you have configured AWS CLI (aws configure). Otherwise, the connection will fail.
2️⃣ Connect kubectl to the EKS Cluster
aws eks update-kubeconfig --region ap-south-1 --name meet-clusterThis command connects your EKS cluster to kubectl.
🛠 Installing ArgoCD on EKS
1️⃣ Create ArgoCD Namespace
kubectl create ns argocd2️⃣ Apply ArgoCD Manifest
kubectl apply -n argocd -f https://raw.githubusercontent.com/argoproj/argo-cd/stable/manifests/install.yaml3️⃣ Verify ArgoCD Installation
kubectl get pods -n argocdEnsure that all ArgoCD pods are running.
⚙️ Checking ArgoCD Services
kubectl get svc -n argocdThis will list all the services running under the argocd namespace.
Change ArgoCD Service Type to NodePort
By default, ArgoCD runs as a ClusterIP service. We need to change it to NodePort for external access.
kubectl patch svc argocd-server -n argocd -p '{"spec": {"type": "NodePort"}}'Confirm the Service is Patched
kubectl get svc -n argocd✅ Ensure the argocd-server service is now of type NodePort.
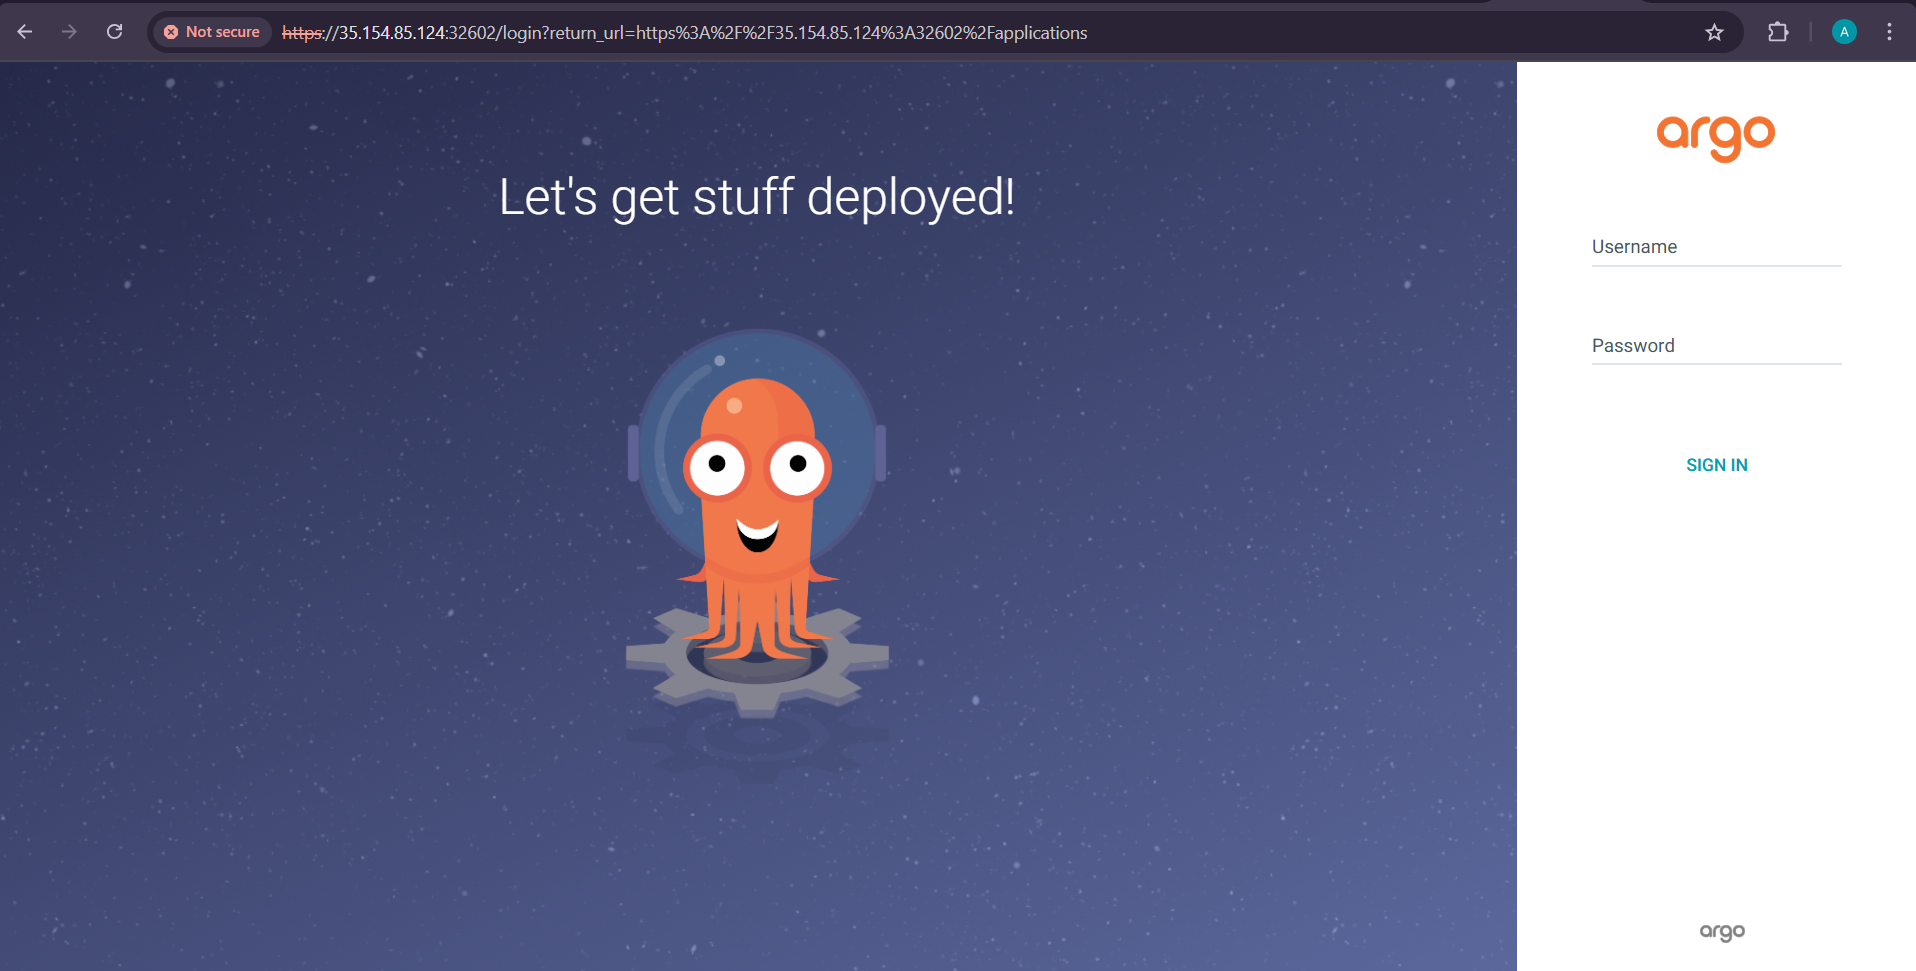
🌐 Accessing ArgoCD UI
1️⃣ Find Your Public EKS Worker Node IP
2️⃣ Open the ArgoCD UI in a browser using:
:3️⃣ Click Advanced and proceed.
🔑 Fetching Initial Admin Password
kubectl -n argocd get secret argocd-initial-admin-secret -o jsonpath="{.data.password}" | base64 -d; echoCopy the decoded password and use it to log in to ArgoCD.
🏗 Updating Admin Password
1️⃣ Log in to ArgoCD UI
2️⃣ Go to User Info > Update Password
3️⃣ Set a new secure password.
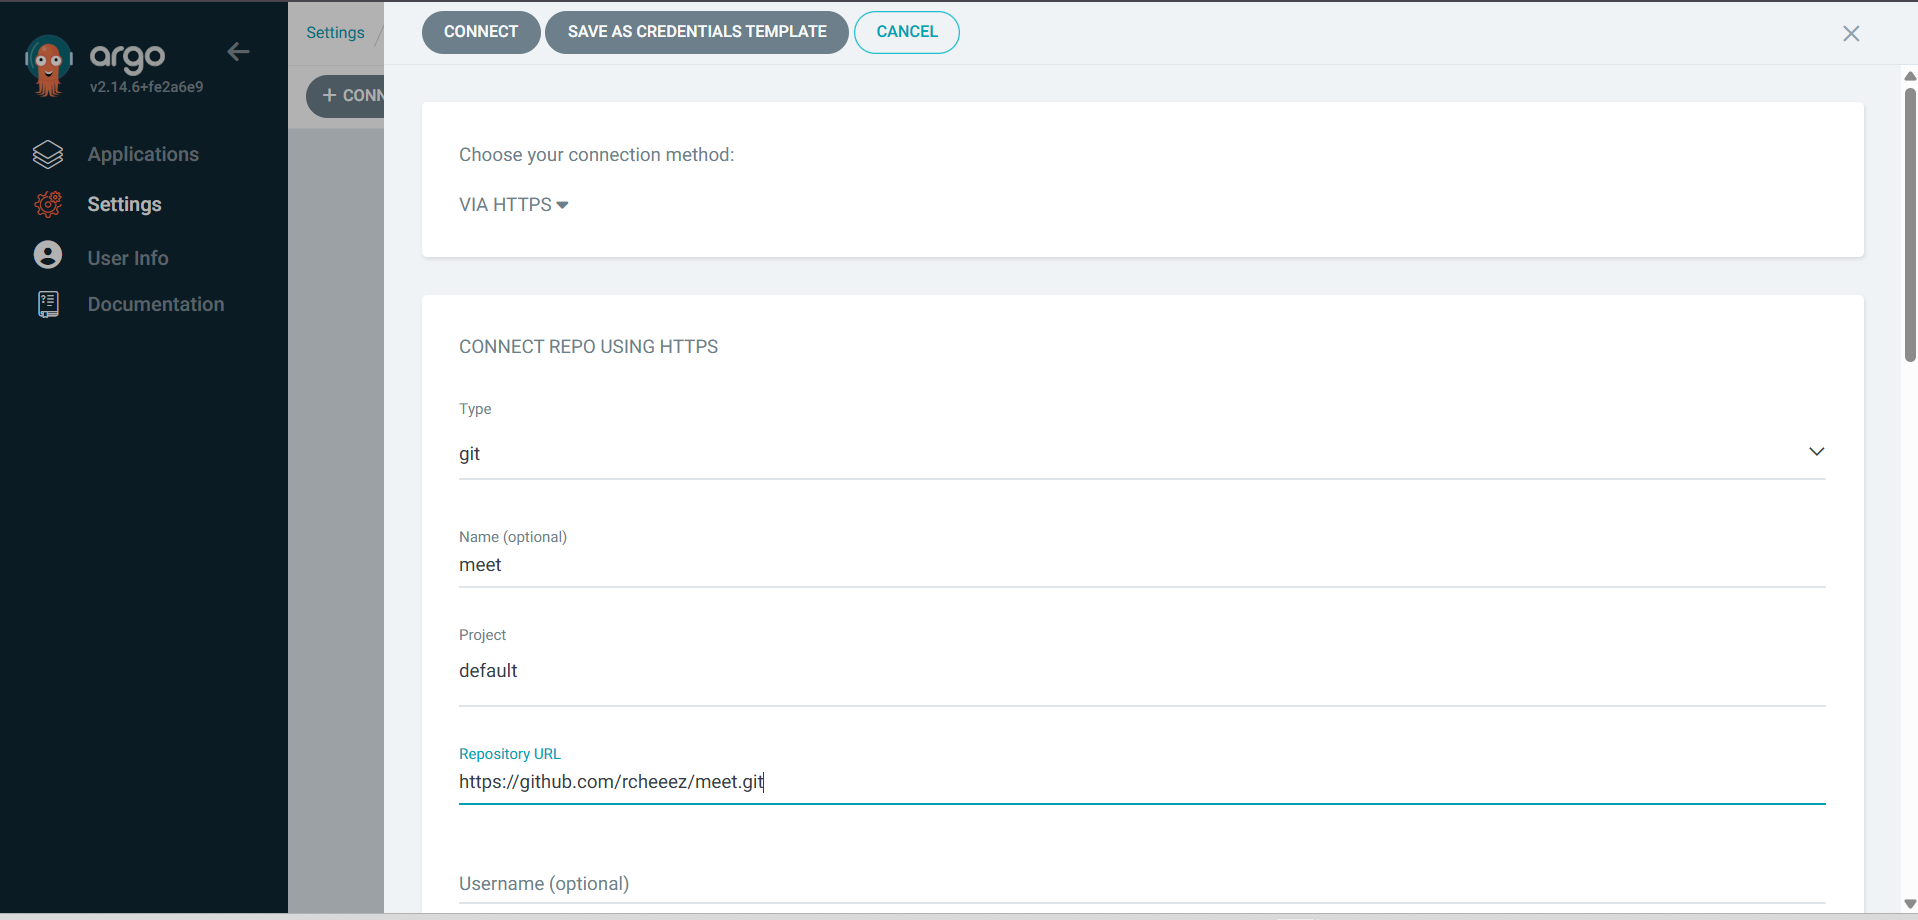
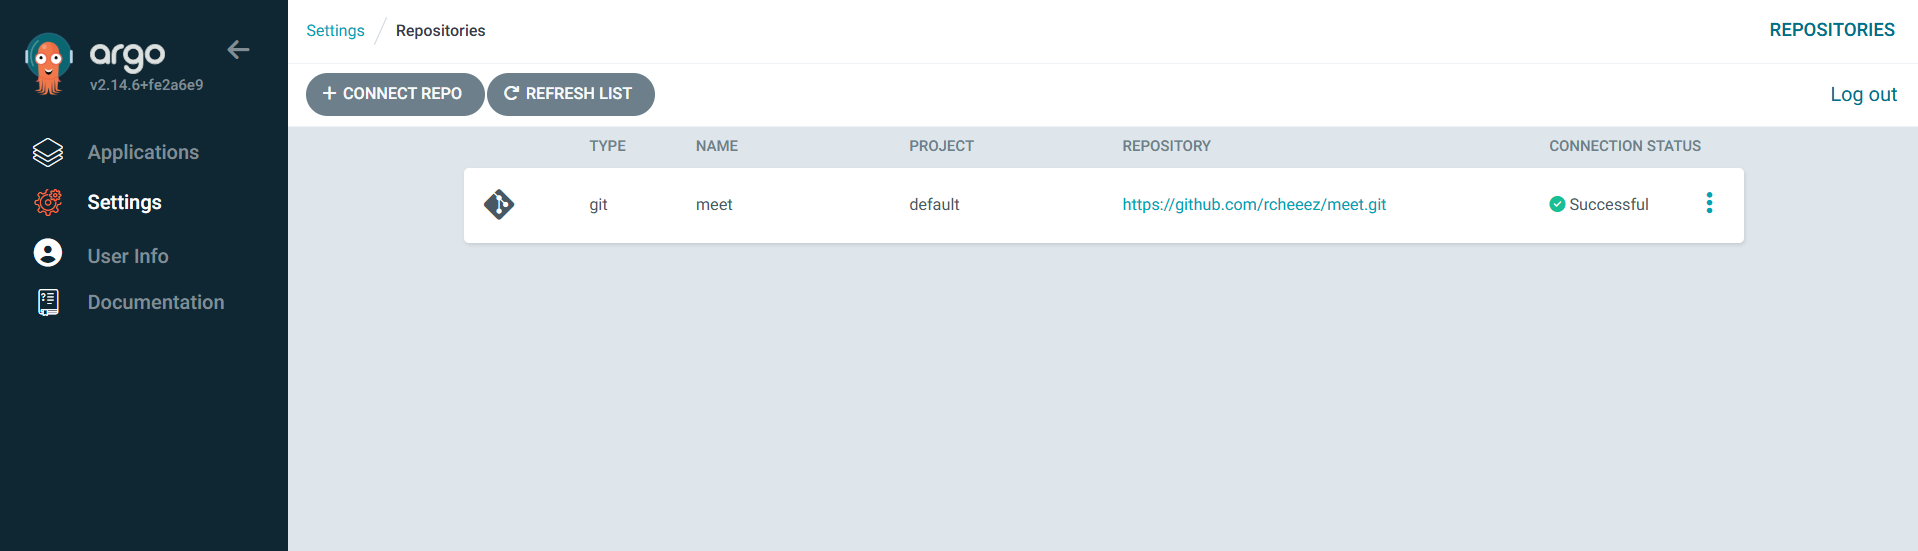
🔗 Connecting Git Repository to ArgoCD
1️⃣ Go to Repositories section in ArgoCD UI2️⃣ Click Connect Repository3️⃣ Choose Git as repository type4️⃣ Enter the Repository URL and select the Branch5️⃣ Click Connect
📝 Note: The connection must be successful before proceeding.
🔐 Logging in to ArgoCD via CLI
📌 The ArgoCD CLI is already installed using Ansible on the Jenkins Master machine.
1️⃣ Login to ArgoCD CLI
argocd login : --username admin2️⃣ Enter the password fetched earlier.
✅ You are now logged in to ArgoCD via CLI.

📌 Checking Available Clusters in ArgoCD
argocd cluster list🔍 Finding Your EKS Cluster Name
kubectl config get-contexts🔗 Adding EKS Cluster to ArgoCD
argocd cluster add arn:aws:eks:ap-south-1:034362041947:cluster/meet-cluster --name meet-cluster🎯 Verify Cluster in ArgoCD UI
1️⃣ Go to Settings → Clusters
2️⃣ Ensure that the EKS cluster is successfully added
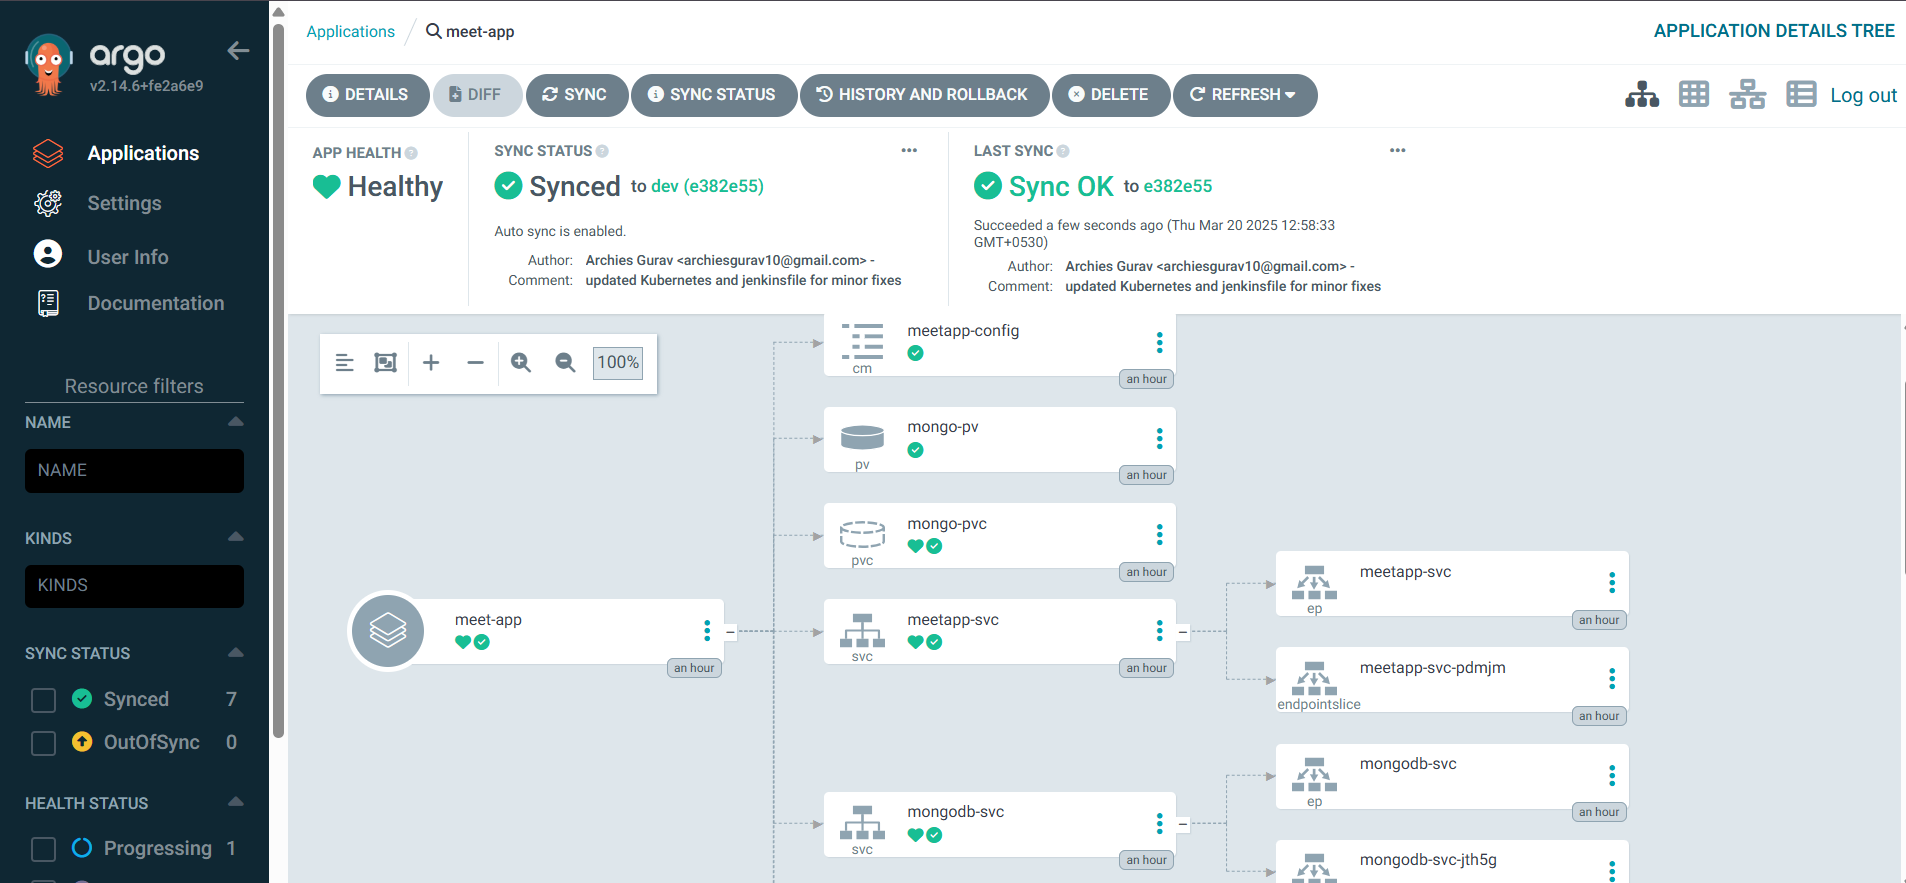
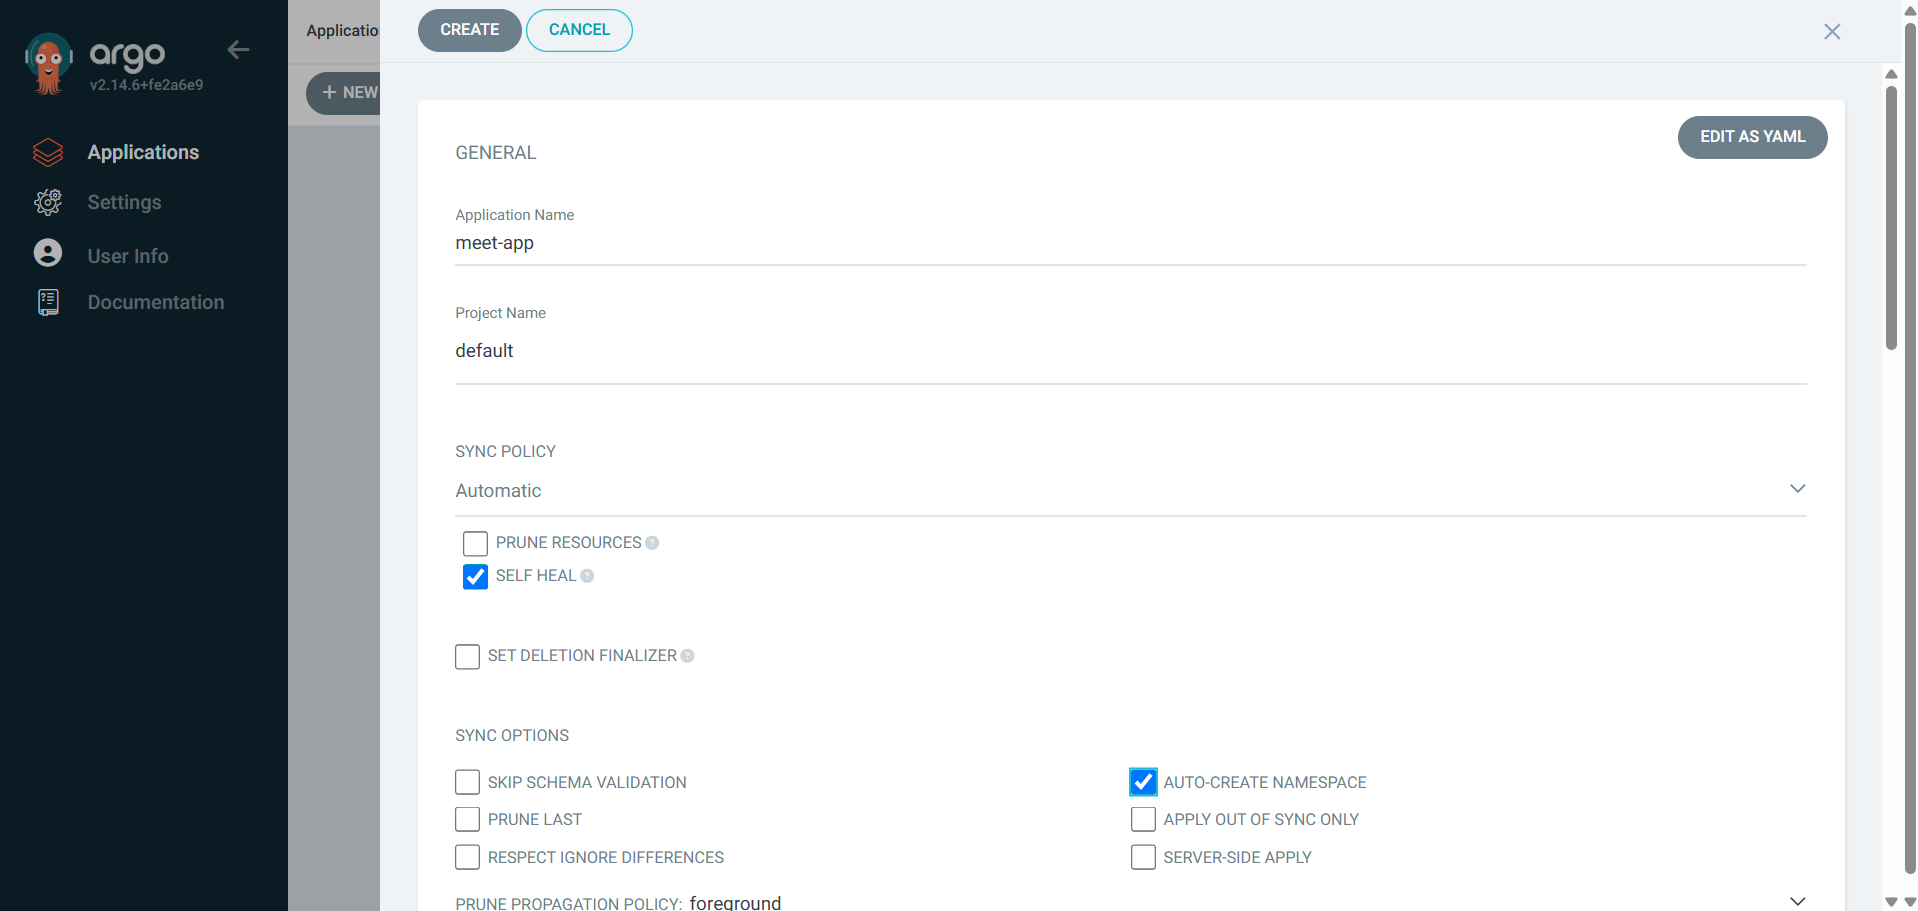
🚀 Deploying an Application in ArgoCD
1️⃣ Go to Applications → New App
2️⃣ Fill in the required details
3️⃣ Enable "Auto-Create Namespace"
4️⃣ Set the Application Name same as Namespace
5️⃣ Click Create
Here's the improved version with better readability and clarity:
✅ Your ArgoCD deployment is now ready! 🎉

🔍 Verify Deployment and Access the Application
1️⃣ Check the Deployment Status from Master Instance
Run the following command to check the status of your services and deployments:
kubectl get all -n meetappThis will display the pods, services, and deployments running inside the meetapp namespace.
2️⃣ Find the Service NodePort
Look for the NodePort assigned to your service in the output. For example:
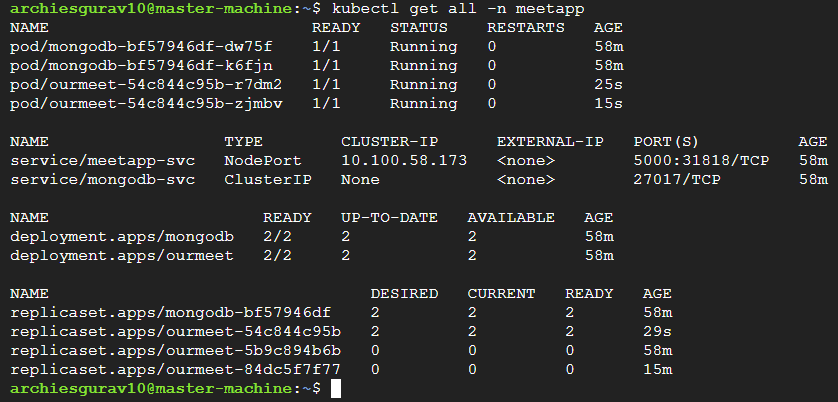
Here, the NodePort is 31818.
3️⃣ Access the Application in Browser
Open your browser and visit:
http://:31818📌 Replace
🚀 Your application has been successfully deployed and is now accessible! 🎯
🌐 Access the Deployed Application
You can now open the application in your browser using the assigned NodePort.

📌 Ensure that you are using the correct public IP of your EKS worker node.
📩 Deployment Success Notification
A success email notification has also been sent to the email address configured in the Jenkins pipeline.
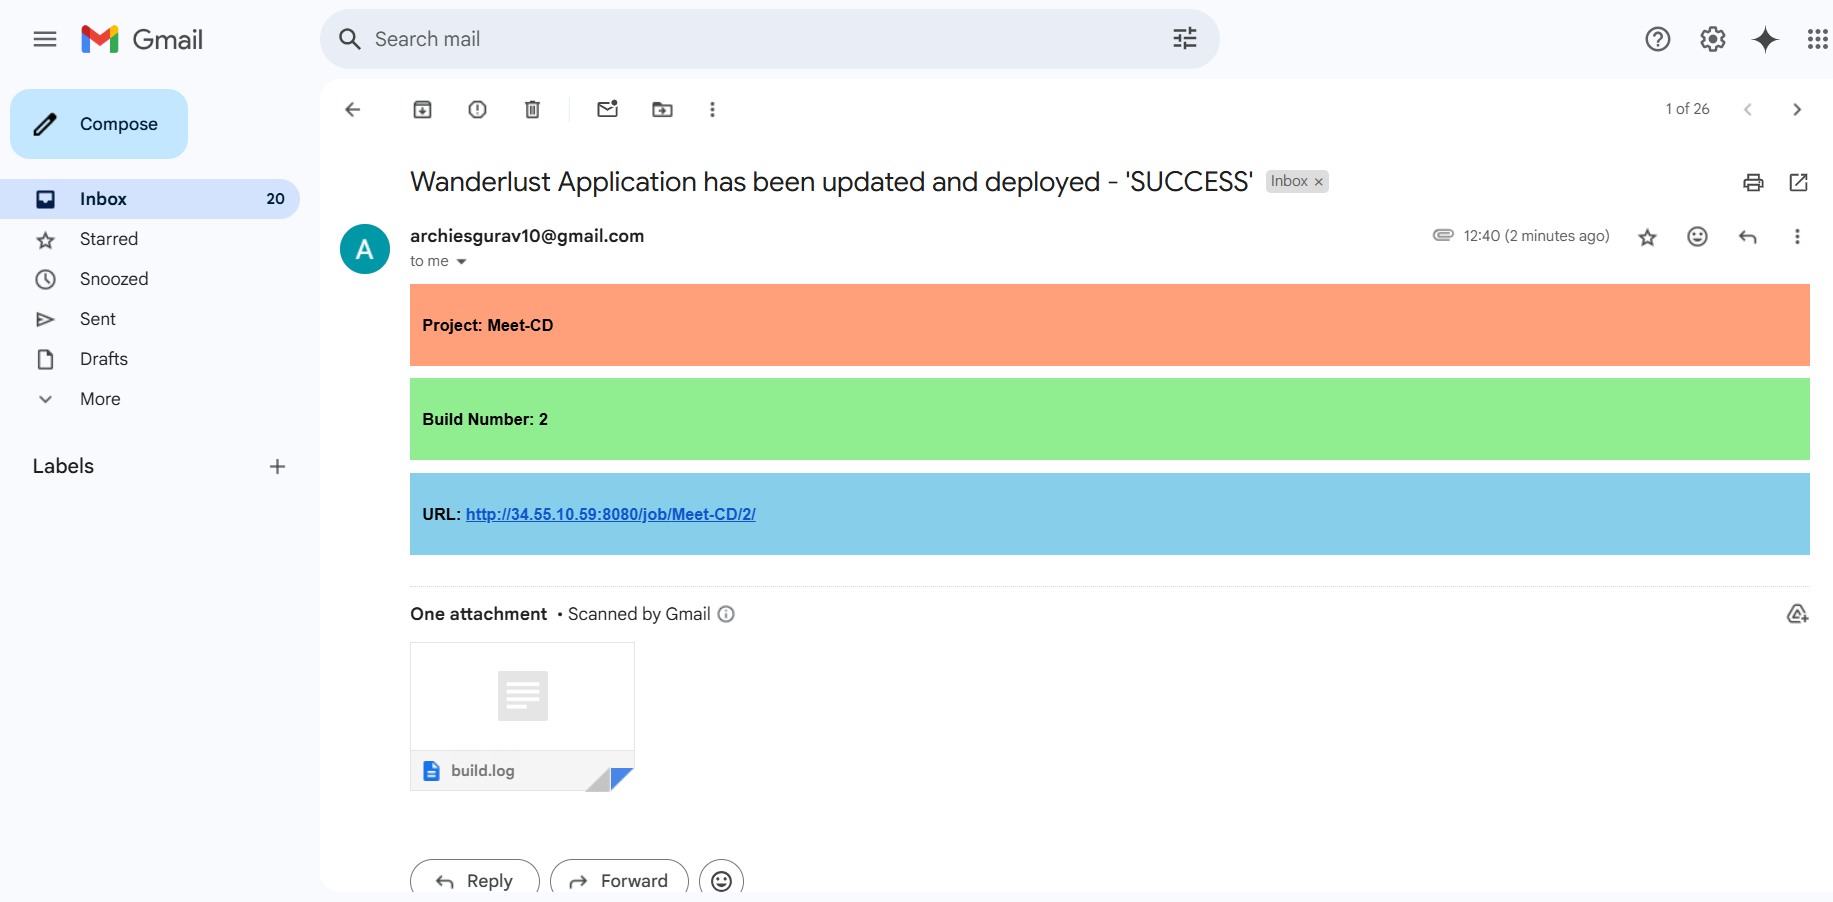
✅ This confirms that the CI/CD pipeline has successfully built and deployed the application! 🚀
📊 Monitoring EKS Cluster & Workloads with Prometheus & Grafana (via HELM)
To effectively monitor your EKS cluster, Kubernetes components, and workloads, we will set up Prometheus and Grafana using HELM.
🛠 Installing HELM on the Master Machine
1️⃣ Download and Install HELM
curl -fsSL -o get_helm.sh https://raw.githubusercontent.com/helm/helm/main/scripts/get-helm-3
chmod 700 get_helm.sh
./get_helm.sh
2️⃣ Add HELM Chart Repositories
helm repo add stable https://charts.helm.sh/stable
helm repo add prometheus-community https://prometheus-community.github.io/helm-charts
✅ This adds the required repositories for installing Prometheus and Grafana.
📌 Deploying Prometheus & Grafana on EKS
1️⃣ Create a Namespace for Prometheus
kubectl create ns prometheus2️⃣ Install Prometheus and Grafana using HELM
helm install stable prometheus-community/kube-prometheus-stack -n prometheus✅ This installs Prometheus for monitoring and Grafana for visualization.
3️⃣ Check Prometheus Services
kubectl get svc -n prometheus🌍 Exposing Prometheus & Grafana to External Access
By default, Prometheus and Grafana are only accessible within the cluster.
We need to change their services to NodePort to make them accessible externally.
1️⃣ Expose Prometheus to External Access
kubectl edit svc stable-kube-prometheus-sta-prometheus -n prometheus🔹 Modify the type: ClusterIP to type: NodePort
🔹 Save and exit the editor
2️⃣ Verify Prometheus Service is Exposed
kubectl get svc -n prometheus3️⃣ Expose Grafana to External Access
kubectl edit svc stable-grafana -n prometheus🔹 Modify the type: ClusterIP to type: NodePort
🔹 Save and exit the editor
4️⃣ Verify Grafana Service is Exposed
kubectl get svc -n prometheus🔑 Accessing Grafana Dashboard
1️⃣ Get Grafana Admin Password
kubectl get secret --namespace prometheus stable-grafana -o jsonpath="{.data.admin-password}" | base64 --decode ; echo📌 The default username is admin. Use the retrieved password to log in.
2️⃣ Open Grafana in Your Browser
Use the EKS worker node’s public IP and the Grafana NodePort to access it.
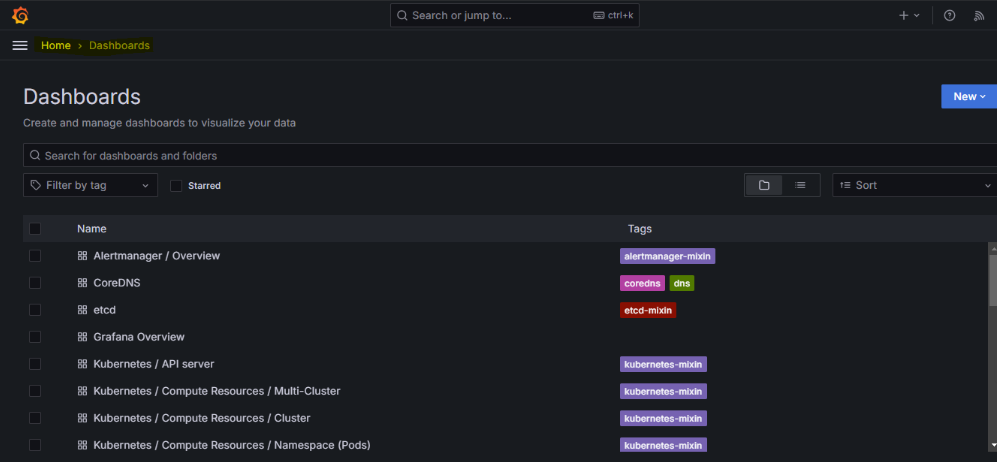
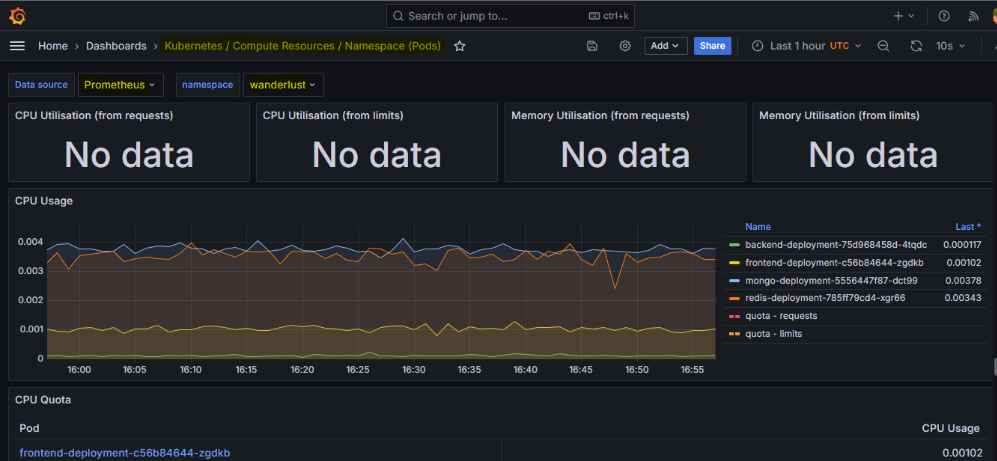
📊 Grafana Dashboards
Once logged in, explore the pre-configured dashboards to monitor your Kubernetes cluster!
🧹 Cleaning Up the Infrastructure
When you're done, delete the EKS infrastructure and remove the GCP instances to avoid unnecessary costs.
terraform destroy --auto-approve✅ This command will remove all AWS EKS resources.
✅ Manually delete the two instances from GCP.