Observability has become a cornerstone of modern software engineering, transforming how developers monitor, debug, and optimize their applications. For Golang developers seeking to build robust, reliable, and high-performing applications, implementing comprehensive observability is no longer optional—it's essential. This article explores how observability practices can significantly benefit your Golang codebase while highlighting various implementation approaches to maximize your application's transparency and reliability.
Understanding Observability in Golang
Observability is the ability to understand an application's internal state by examining its external outputs. Unlike simple monitoring, which focuses on predefined metrics, observability provides deep insights into complex systems by enabling developers to ask arbitrary questions about their behavior without deploying new code. In the context of Golang applications, observability becomes especially valuable due to Go's widespread use in distributed systems, microservices, and high-performance applications.
Golang's design philosophy of simplicity and efficiency carries over into its observability practices. The language's standard library provides fundamental building blocks for implementing observability, which can be enhanced with specialized frameworks and libraries to create a comprehensive observability strategy tailored to your application's needs.
The Three Pillars of Observability
Effective observability rests on three foundational pillars: logs, metrics, and traces. Each provides a different perspective on your application's behavior, and together they create a comprehensive view of your system's health and performance.
Structured Logging
Logs offer real-time insights into your application's state and activities, providing valuable information for debugging, troubleshooting, and monitoring performance. In Golang, structured logging has become the standard approach, replacing traditional text-based logs with structured formats like JSON or logfmt that are easier to query and analyze.
Modern Golang applications often implement:
- Contextual logging with correlation IDs
- Log level customization (INFO, DEBUG, ERROR, etc.)
- JSON-formatted logs for easy integration with log aggregation systems
- Asynchronous logging to prevent blocking the main application thread
When implementing logging, consider sampling strategies or asynchronous emission patterns to prevent logs from becoming performance bottlenecks themselves, especially during high-traffic periods.
Metrics Collection
Metrics provide quantitative data about your application's performance and resource utilization. They play a crucial role in:
- Monitoring response times and latency
- Tracking resource utilization (CPU, memory, disk I/O)
- Detecting faults and troubleshooting issues
- Measuring and meeting service-level agreements
Prometheus has become the de facto standard for metrics collection in Golang applications, with its pull-based architecture and dimensional data model. Metrics are typically exposed via an HTTP endpoint in Prometheus format, allowing for easy scraping and integration with visualization tools like Grafana.
Key metrics to consider for Golang applications include:
- Garbage collection cycles and duration
- Number of active goroutines
- Memory allocation statistics
- HTTP request/response times
- Database connection stats and query performance
These metrics provide both a high-level overview of application health and detailed insights into specific components, enabling both proactive monitoring and targeted troubleshooting.
Distributed Tracing
Tracing completes the observability triad by providing visibility into request flows across distributed systems. A trace represents the journey of a request as it traverses various services and components, with each segment of the journey captured as a "span".
In complex microservice architectures, tracing is essential for:
- Understanding request pathways through the system
- Identifying bottlenecks in distributed transactions
- Debugging cross-service issues
- Analyzing performance across service boundaries
OpenTelemetry has emerged as the industry standard for tracing in Golang, providing a vendor-neutral way to collect and export traces to various backends such as Jaeger, Zipkin, or cloud-native observability platforms.
Effective tracing implementations typically include:
- Automatic correlation ID generation and propagation
- Contextual span creation with relevant attributes
- Integration with existing logging and metrics systems
- Sampling strategies to manage trace volume
Benefits of Observability for Golang Code
Implementing comprehensive observability in your Golang applications yields numerous benefits that directly impact both development efficiency and application performance.
Accelerated Debugging and Issue Resolution
With proper observability, debugging becomes less of an archaeological expedition and more of a guided investigation. When issues arise, developers can:
- Trace the exact path of problematic requests
- Analyze logged error messages with contextual information
- Identify performance anomalies through metric visualization
- Correlate symptoms across services via trace correlation IDs
This integrated approach dramatically reduces mean time to resolution (MTTR) for production issues, minimizing downtime and user impact.
Performance Optimization Opportunities
Observability provides the data foundation necessary for meaningful performance optimization:
- Identify hot spots and bottlenecks through profiling and tracing
- Measure the impact of optimizations with before/after metrics comparisons
- Detect gradual performance degradation before it becomes critical
- Validate optimizations in production environments
Golang's efficiency-focused design philosophy pairs naturally with data-driven optimization approaches enabled by comprehensive observability.
Enhanced System Understanding
For complex systems, observability creates a map that developers can navigate:
- Visualize service dependencies and interaction patterns
- Understand real-world usage patterns versus theoretical designs
- Document system behavior through actual observation rather than speculation
- Onboard new team members with concrete examples of system behavior
This deeper understanding leads to more informed architectural decisions and better system evolution over time.
Improved Reliability and Uptime
Proactive observability practices directly contribute to system reliability:
- Early warning systems through anomaly detection
- Capacity planning informed by historical metrics
- Faster incident response through comprehensive diagnostics
- Evidence-based postmortem analysis for preventing recurrence
Implementing Observability in Golang
While the standard library provides basic building blocks, most production Golang applications leverage specialized frameworks and libraries to implement comprehensive observability.
Frameworks with Built-in Observability
Some Golang frameworks come with integrated observability features that simplify implementation. GoFr, for example, manages observability out of the box with features for logging, metrics, and tracing that activate automatically when the server starts.
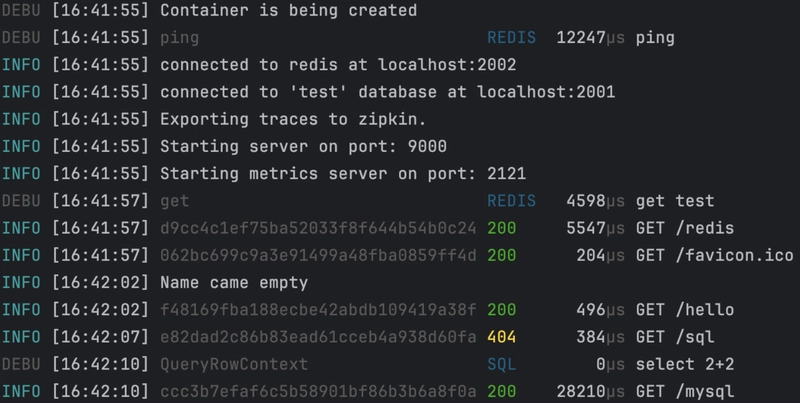
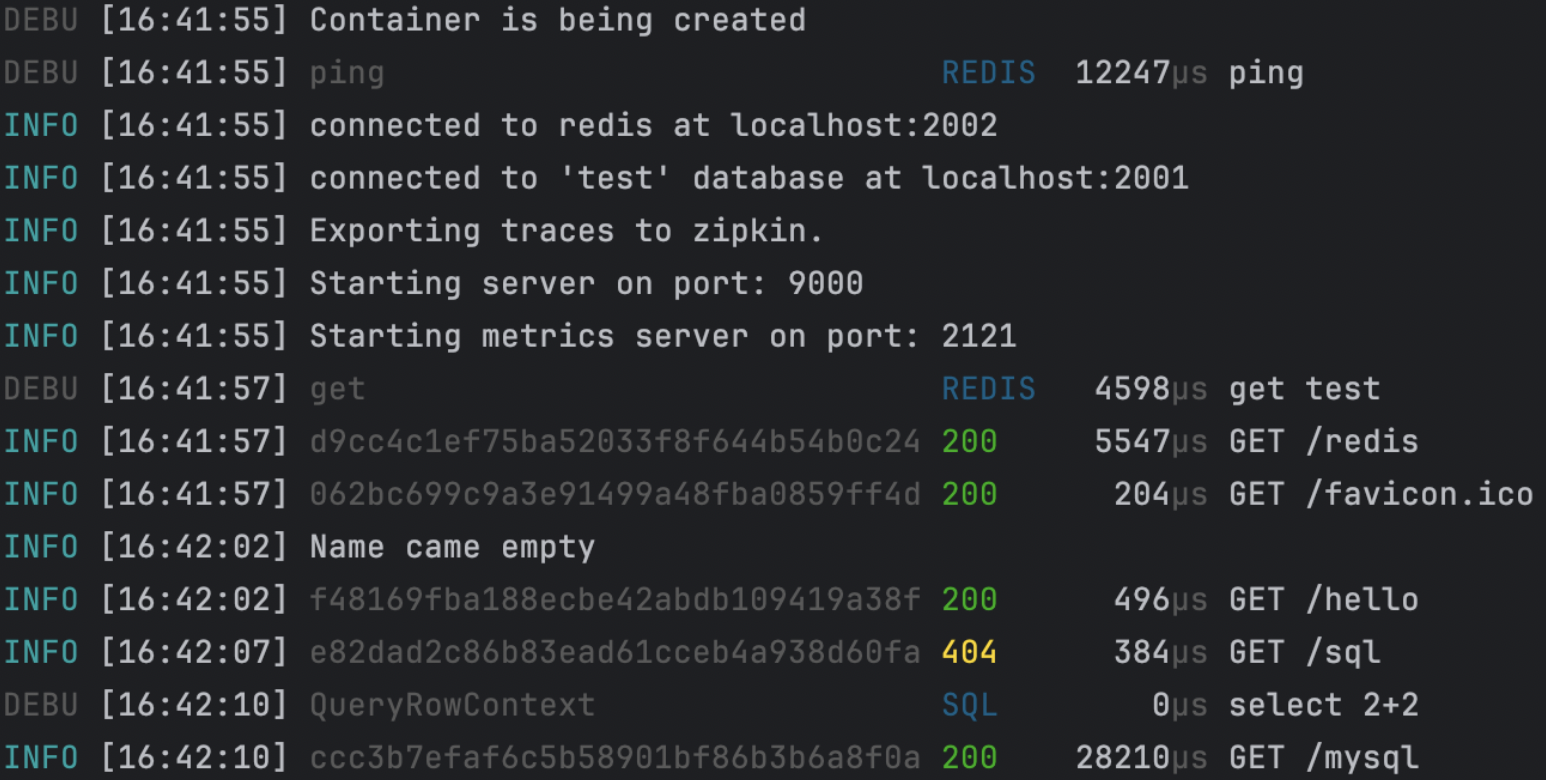
With GoFr, logs are well-structured in JSON format when exported to a file, making them compatible with systems like Loki. The framework automatically logs important events like configuration loading, database connections, and HTTP requests, complete with correlation IDs and timing information.
GoFr logger allows customizing log level which provides flexibility to adjust logs based on specific needs.
Logs are generated only for events equal to or above the specified log level, by default GoFr logs at INFO level. Log Level can be changed by setting the environment variable LOG_LEVEL value to WARN,DEBUG,ERROR,NOTICE or FATAL.
When GoFr server runs, it prints log for reading configs, database connection, requests, database queries, missing configs etc. They contain information such as request's correlation ID, status codes, request time etc.
For metrics, GoFr publishes to a dedicated port (2121 by default) on a /metrics endpoint in Prometheus format, covering everything from garbage collection statistics to HTTP response times and database connection metrics.
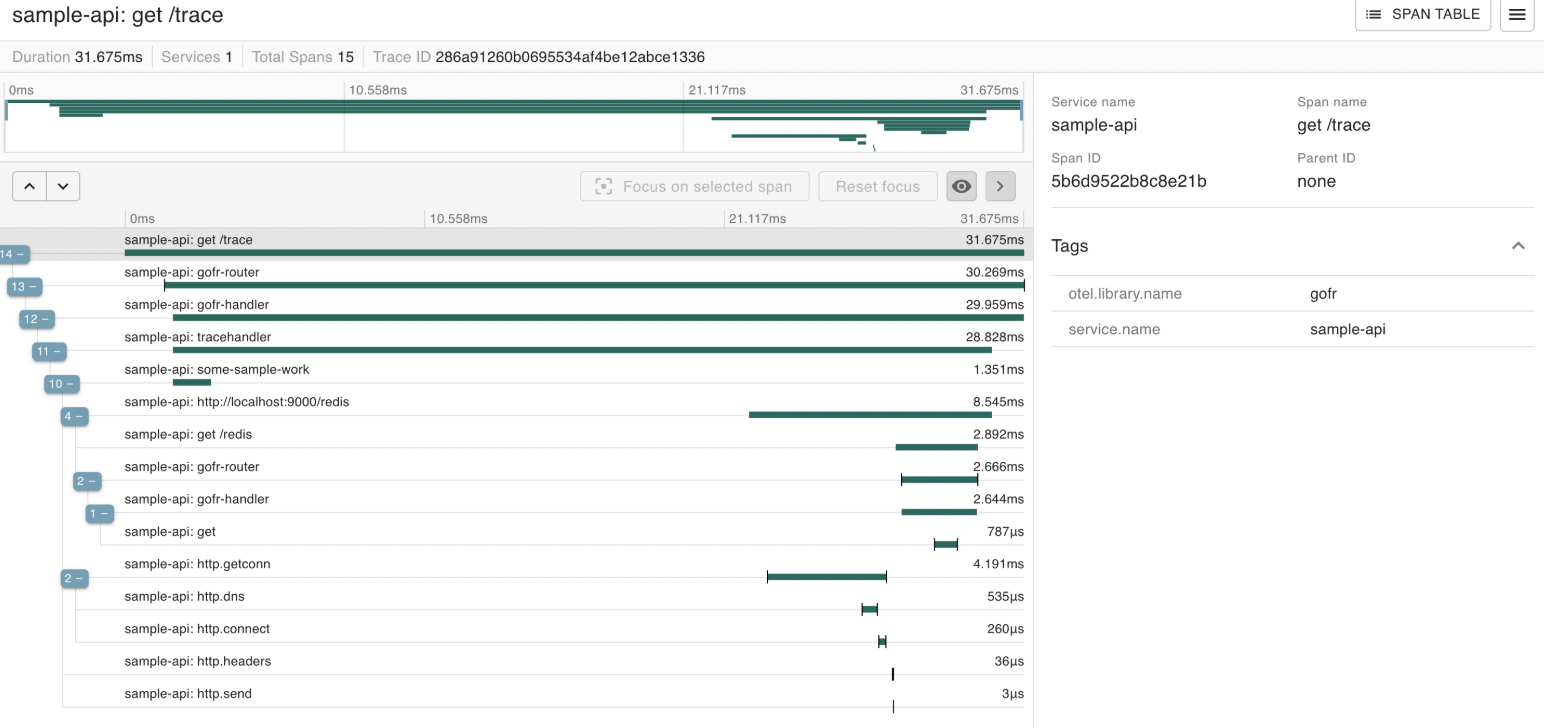
GoFr also implements automatic tracing with OpenTelemetry, generating correlation IDs for all requests and supporting multiple trace exporters including Zipkin, Jaeger, OTLP, and its own custom tracer.
Conclusion
Comprehensive observability transforms how we build, maintain, and evolve Golang applications. By implementing the three pillars of observability—logs, metrics, and traces—developers gain unprecedented insight into their applications' behavior, enabling faster debugging, data-driven optimization, and improved reliability.
Whether you leverage frameworks like GoFr with built-in observability features or build custom solutions using specialized libraries, the investment in observability pays dividends throughout your application's lifecycle. As distributed systems grow increasingly complex, observability has become not just a nice-to-have feature but an essential practice for maintaining and evolving robust Golang applications.
By embracing observability principles and implementing them thoughtfully in your Golang codebase, you'll build not just more transparent systems, but more resilient, maintainable, and performant applications that can evolve confidently to meet changing requirements.