While many testers are familiar with the basics of API testing—validating status codes, parsing response bodies, and testing CRUD operations—expert-level API testing goes far beyond that. To build a resilient and maintainable test suite, testers must adopt advanced practices like structured logging, traceability, and clear reporting.
In this article, we explore logging best practices that are largely tool-agnostic, but we'll demonstrate them using PactumJS, a powerful and extensible API testing tool, along with Mocha, a popular JavaScript test framework. For logging, we’ll use Pino, one of the fastest and most reliable structured loggers for Node.js.
Here is the sample repo https://github.com/pactumjs/pactum-mocha-boilerplate to see the code in live action.
🎯 Why Logging Matters in API Testing
Running thousands of API tests is meaningless if, when something fails, you can’t answer the following:
❓ What failed?
❓ Why did it fail?
❓ When did it start failing?
❓ Is it a consistent or intermittent failure?
Without structured and persistent logging, diagnosing failures becomes time-consuming and unreliable. Reporting+Logging helps testers see the full picture, improves debugging speed, and strengthens collaboration across the team.
🤓 Concept: See the Full Picture with Perfect Logging
In real-world API automation suites—especially those integrated into CI/CD pipelines—you need more than just a test failure message. You need context:
📤 Request payload
📥 Response body and headers
🔄 Dynamic variables passed between steps
Without these, troubleshooting is reduced to guesswork.
🧰 Solution: Pino + PactumJS Event Logging
To implement clean and contextual logging, we’ll use Pino to persist logs and hook into PactumJS’s event system to automatically log request and response details after every API interaction.
Step 1: Set Up a Custom Logger
Create a logger using pino, and write all logs to a file:
// logger.js
const { pino } = require('pino');

const logger = pino({
  level: 'info',
  transport: {
    target: 'pino-pretty',
    options: {
      destination: `logs/${Date.now()}.log`,
      colorize: false,
      translateTime: 'UTC:yyyy-mm-dd HH:MM:ss.l o',
    },
  },
});

module.exports = { logger };
Step 2: Hook Into Pactum Events
Use Pactum’s built-in AFTER_RESPONSE event to capture and log each request/response:
// event.logger.js
const { events } = require('pactum');
const { logger } = require('./logger');

const { pactumEvents, EVENT_TYPES } = events;

pactumEvents.on(EVENT_TYPES.AFTER_RESPONSE, ({ request, response }) => {
  logger.info({
    request: {
      method: request.method,
      url: request.url,
      headers: request.headers,
      body: request.body,
    },
    response: {
      statusCode: response.statusCode,
      responseTime: response.responseTime,
      headers: response.headers,
      body: response.body,
    }
  }, `Request: ${request.method} ${request.path}`);
});
With this setup, every test execution will generate rich logs that capture all HTTP activity in a structured format.
✅ Pro Tip: Always stream logs to a file rather than printing to the console. Log files are easier to archive, reference later, or integrate with monitoring/reporting tools.
Sample Logs
[2025-04-13 07:26:13.741 +0000] INFO (51775): Setting up base test
[2025-04-13 07:26:14.522 +0000] INFO (51775): Request: POST /challenger
    request: {
      "method": "POST",
      "url": "https://apichallenges.eviltester.com/challenger"
    }
    response: {
      "statusCode": 201,
      "responseTime": 780,
      "headers": {
        "x-challenger": "3f9331e7-8f26-45bf-af46-0ffd9582a64d",
      },
      "body": ""
    }
[2025-04-13 07:26:15.345 +0000] INFO (51775): Request: POST /todos
    request: {
      "method": "POST",
      "url": "https://apichallenges.eviltester.com/todos",
      "headers": {
        "X-CHALLENGER": "3f9331e7-8f26-45bf-af46-0ffd9582a64d"
      },
      "body": {
        "title": "process payroll",
        "doneStatus": false,
        "description": ""
      }
    }
    response: {
      "statusCode": 201,
      "responseTime": 822,
      "headers": {
        "content-type": "application/json",
        "x-challenger": "3f9331e7-8f26-45bf-af46-0ffd9582a64d",
      },
      "body": {
        "id": 11,
        "title": "process payroll",
        "doneStatus": false,
        "description": ""
      }
    }
📝 Reporting: Make Logs Actionable
Logging is only half the story — reporting turns those logs into insights. Once your logs capture rich request and response data, the next step is to organize and deliver that information in a way that your team can actually use. Actionable reporting ensures test results don’t go unnoticed and helps drive faster decisions.
🤓 Concept: Automated Reporting with Context
Once tests are run, logs and results need to be visible and shareable. Reporting tools help teams:
- Detect regressions early
- Share real-time feedback in Slack/Teams
- Build test history and trends
🧪 Tool: TestBeats for Result Publishing
We’ll use TestBeats to push test reports (e.g., JUnit XML) directly to Slack or dashboards.
npx testbeats@latest publish \
  --slack ${{ secrets.SLACK_WEBHOOK_URL }} \
  --junit reports/junit.xml
This integration ensures your team doesn’t need to hunt through CI logs—they’ll be notified of test outcomes instantly, along with rich failure context.
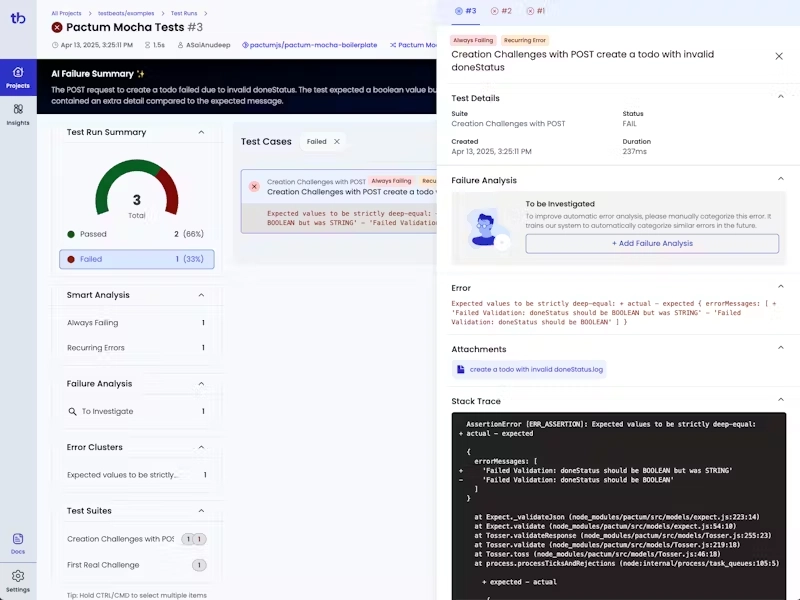
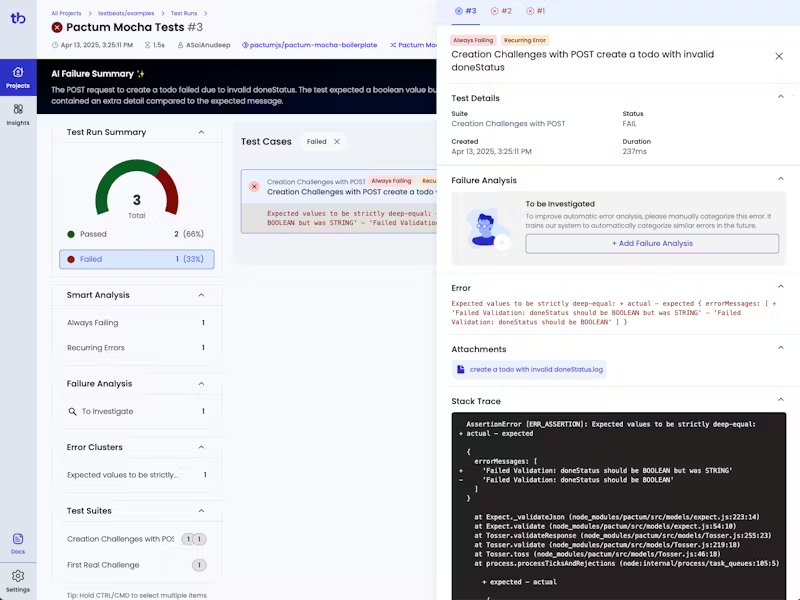
App Dashboard
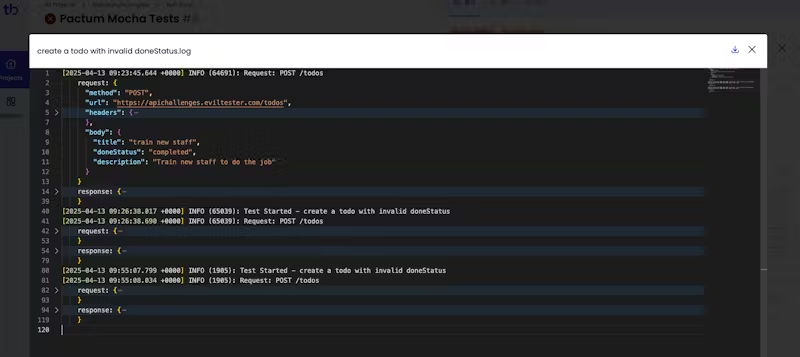
Logs
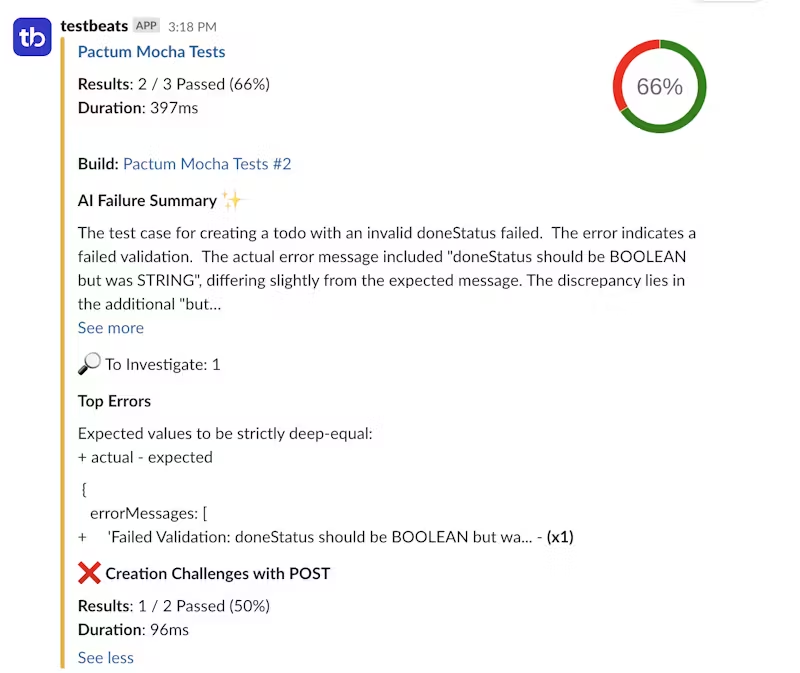
Slack Alert
Conclusion
Logging is not just about debugging—it’s about observability, accountability, and collaboration. Whether you're building a simple smoke suite or a complex regression pipeline, structured logs help you move from confusion to clarity.
By combining PactumJS, Mocha, and Pino, and by integrating tools like TestBeats, you can build a robust E2E testing workflow that gives you complete visibility from requests to reports.