Power BI is a powerful tool for data visualization and analysis. If you're new to it, this guide will walk you through creating your first dashboard step by step.

Step 1: Download & Install Power BI
Before you start, download Power BI Desktop from Microsoft’s official website. Install it and open the application to begin.
Step 2: Import Data into Power BI
Once Power BI Desktop is open, follow these steps to import your dataset:
- Click Home → Get Data → Text/CSV.
- Select your CSV file and click Open.
- Click Load to import it into Power BI.
Step 3: Transform Data
To clean and structure your data, use Power Query Editor:
- Click Transform Data to open the Power Query Editor.
- Check column names and correct data types:
- Convert date fields to Date format.
- Convert sales numbers to Whole Number/Decimal.
- Click Close & Apply to save changes.
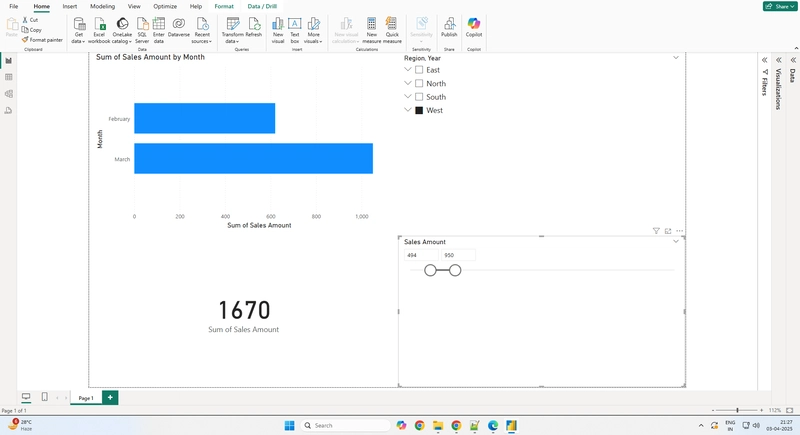
Step 4: Create Visuals
Now, let’s create some charts and key performance indicators (KPIs):
- Go to the Report View.
- Click on a Bar Chart from the Visualizations Pane.
- Drag Month to the X-Axis and Sales to the Y-Axis.
- Click on Card Visualization, and drag Total Sales to display a KPI.
Step 5: Add Filters & Slicers
To make the dashboard interactive:
- Click on Slicer Visualization.
- Drag Year or Region into the slicer to enable interactive filtering.
Step 6: Publish Your Dashboard
Once your dashboard is ready:
- Click Publish (top-right corner of Power BI Desktop).
- Sign in to Power BI Service.
- Share the report via a link.
Download Sample Code
To further enhance your Power BI learning experience, you can download sample code from the link below:
📥 Download Sample Code
Conclusion
With these steps, you can build your first Power BI dashboard! Power BI allows you to connect to multiple data sources, transform data, and create interactive reports easily.
🚀 Next Steps: Learn DAX (Data Analysis Expressions) for advanced calculations and explore real-time dashboard capabilities in Power BI Service.
Have you built your first Power BI dashboard? Share your experience in the comments! 🎯