Hey everyone! Today, I’m thrilled to introduce HonoSphere – an IoT project that combines an ESP32 microcontroller, environmental sensors, and the magic of Cloudflare Workers to deliver real-time environmental monitoring. In this post, I'll dive into how Cloudflare Workers make HonoSphere free and cost-effective, and why this project is perfect for beginners looking to explore the world of IoT.
For the complete source code and more details, check out the HonoSphere repository on GitHub.
Table of Contents
- What is HonoSphere?
- Why Cloudflare Workers?
- Tech Stack Overview
- Getting Started
- Use Cases
- Future Upgrades & Attachables
- Wrapping Up
What is HonoSphere?
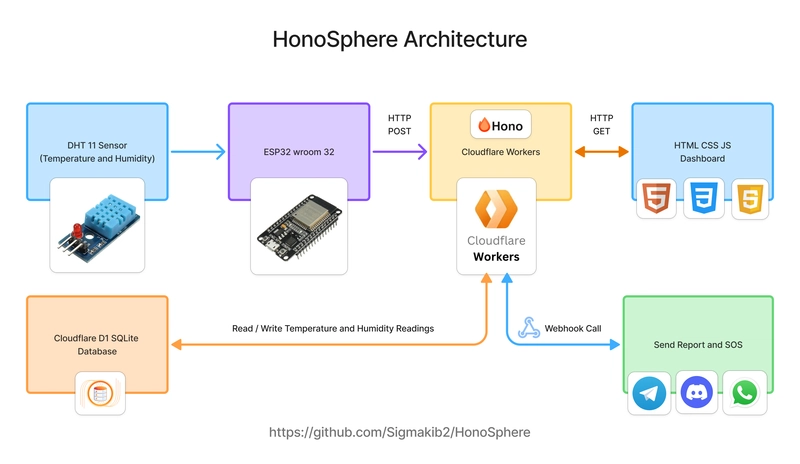
HonoSphere is an innovative IoT project designed to monitor environmental conditions like temperature, humidity, heat index, mold risk, and vapor pressure deficit (VPD) in real-time. It uses an ESP32 and a DHT11 sensor to capture data, then sends this information to Cloudflare Workers where it’s processed and stored in a Cloudflare D1 Database. The data is finally visualized on a dynamic web dashboard built with HTML, Tailwind CSS, and Chart.js.
This Project is Useful For:
IoT Enthusiasts & Beginners:
An accessible project for anyone starting with IoT, ESP32 programming, and sensor integration.Smart Home Automation:
Enhance your smart home setup by monitoring and controlling temperature and humidity for optimal comfort.Greenhouse & Agricultural Monitoring:
Keep your plants happy with real-time environmental data to adjust watering, ventilation, and heating systems.Office Environment & Indoor Air Quality:
Maintain a healthy workspace by tracking and managing indoor climate conditions.Personal Weather Stations:
Create your own remote weather station to gather local climate data for personal use or community sharing.Educational Projects:
A practical project for learning about sensor networks, cloud computing, and real-time data visualization.
Why Cloudflare Workers?
One of the standout features of HonoSphere is its use of Cloudflare Workers. Here’s why they make this project an ideal choice for beginners and budget-conscious makers:
Free Tier and Cost-Effectiveness:
Cloudflare Workers offer a generous free tier, allowing you to run your code at the edge without incurring hefty costs. This means you can deploy your IoT project without worrying about monthly fees or scaling issues.Ease of Deployment:
Cloudflare Workers simplify the deployment process. With just a few commands and minimal configuration, you can get your backend up and running in minutes.Low Maintenance:
Since Cloudflare Workers are serverless, there’s no need to manage servers or worry about infrastructure. This leaves you free to focus on building and improving your IoT project.Edge Computing Benefits:
By running your code on Cloudflare’s global network, you benefit from low latency and high performance, ensuring your IoT data is processed quickly and reliably no matter where you are.Beginner-Friendly Environment:
The developer tools, documentation, and community support make Cloudflare Workers a great entry point for those new to serverless computing and IoT projects.
Tech Stack Overview
Backend
- Hono.js: A fast API framework that powers our endpoints.
- Cloudflare Workers: Serverless computing that makes deployment free and easy.
- D1 Database: A cloud-based SQL database from Cloudflare for storing sensor data.
Frontend
- HTML & Tailwind CSS: For building a sleek, responsive dashboard.
- Chart.js & chartjs-plugin-zoom: For interactive, eye-catching charts.
Hardware
- ESP32: Your IoT microcontroller that connects to WiFi.
- DHT11 Sensor: Captures temperature and humidity data.
HonoSphere Architecture
Visualize the flow of your project with this neat diagram:

Installation & Setup
Clone the Repository
Kick things off by cloning the repository to your local machine:
git clone https://github.com/Sigmakib2/HonoSphere.git
cd HonoSphere
Backend Setup
Get ready to deploy the magic on Cloudflare!
Cloudflare Workers Project
- Navigate and Install Dependencies:
Jump into the Cloudflare Workers folder and install the necessary packages:
cd cloudflare_worker
   npm install
npm run dev- Set Up Cloudflare D1 Database:
Follow the Cloudflare D1 documentation to configure your database. Below you can see this process:
Configure Wrangler
- Edit the
wrangler.jsoncFile:
Update your configuration to connect to your D1 database and secure your endpoints with an API key:
{
     "d1_databases": [
       {
         "binding": "DB",
         "database_name": "honosphere",
         "database_id": "Your-d1_databases-ID"
       }
     ],
     "vars": {
       "AUTH_KEY": "YOUR_SECURE_API_KEY"
     }
   }
Tip: The
AUTH_KEYis crucial—it's what keeps unauthorized users from writing data to your database!
Create & Configure the D1 Database
- Create the Database:
Execute this command to create a new database called honosphere:
npx wrangler d1 create honosphere(If you haven’t installed Wrangler yet, run npm install wrangler -g.)
- Set Up Your Database Table:
Run the schema file to create the necessary table:
npx wrangler d1 execute honosphere --remote --file db/schema.sql- Deploy Your Worker:
Finally, deploy your Cloudflare Worker:
npm run deployOnce deployed, you’ll see an endpoint URL in your terminal like this:
https://..workers.devESP32 Firmware Setup
Let’s power up the ESP32!
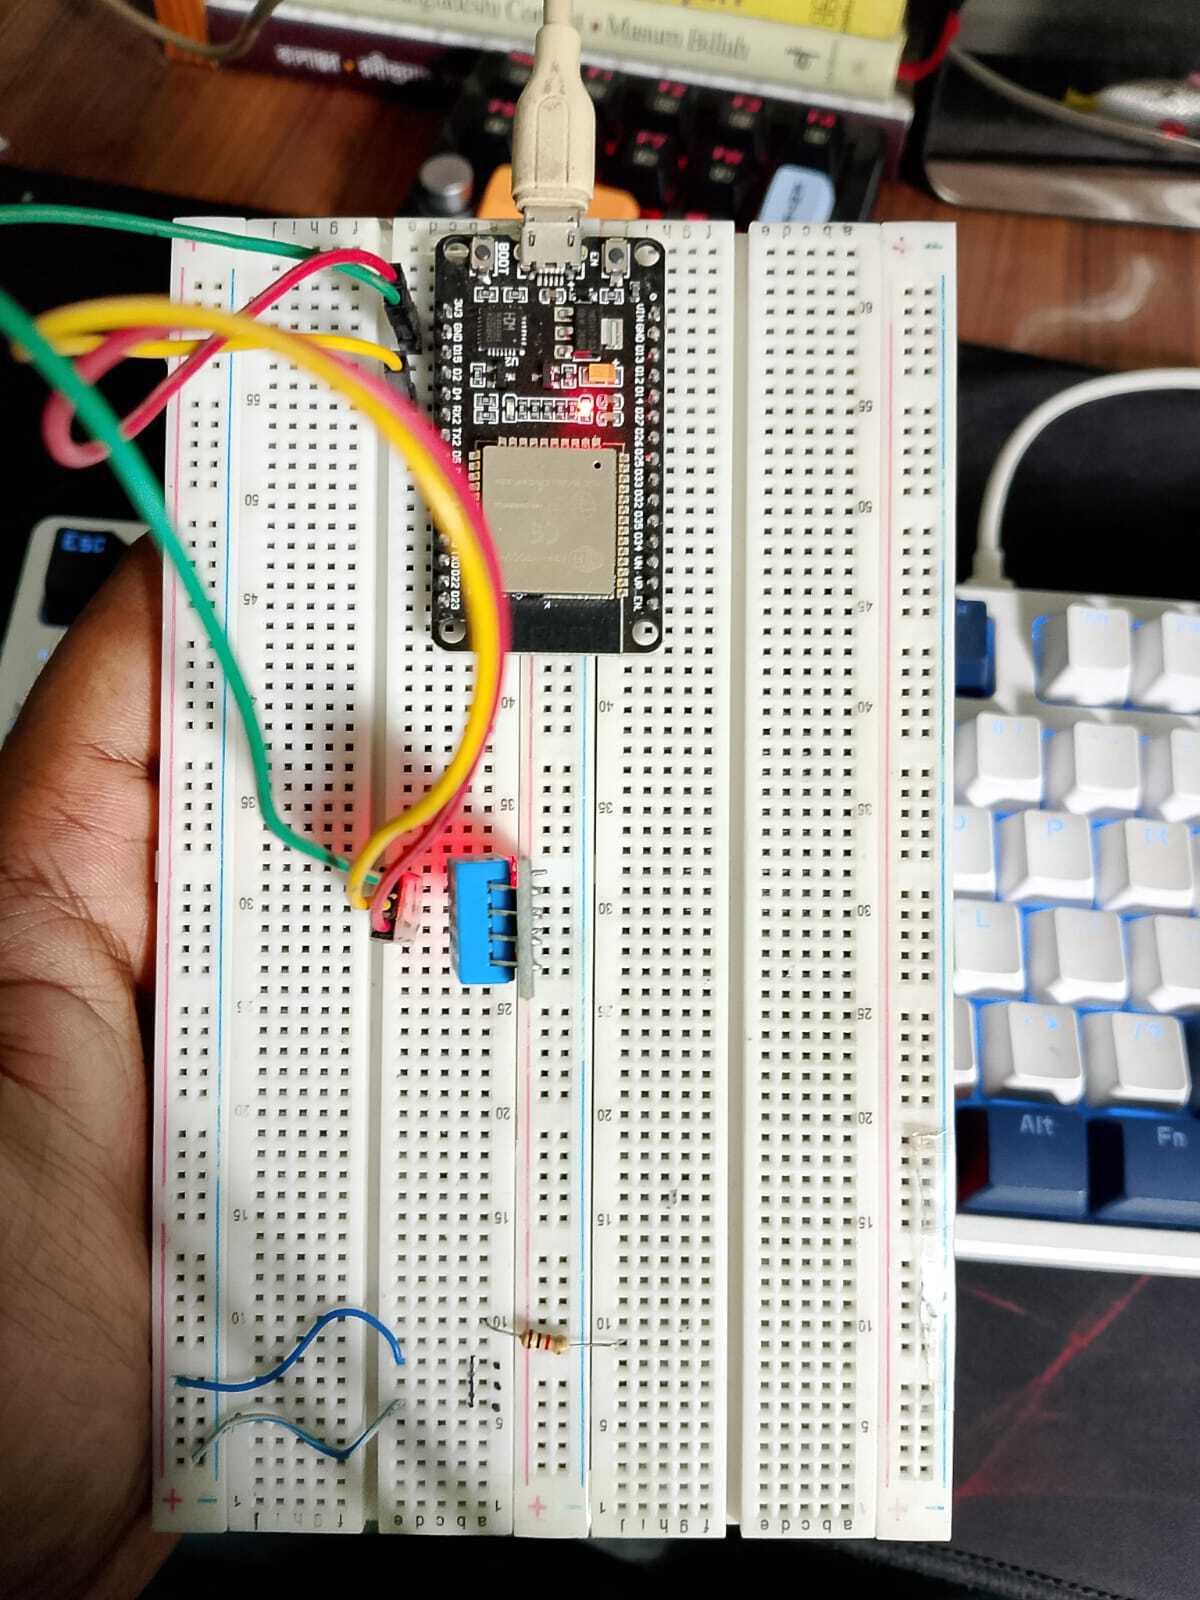
📐 Connection Diagram
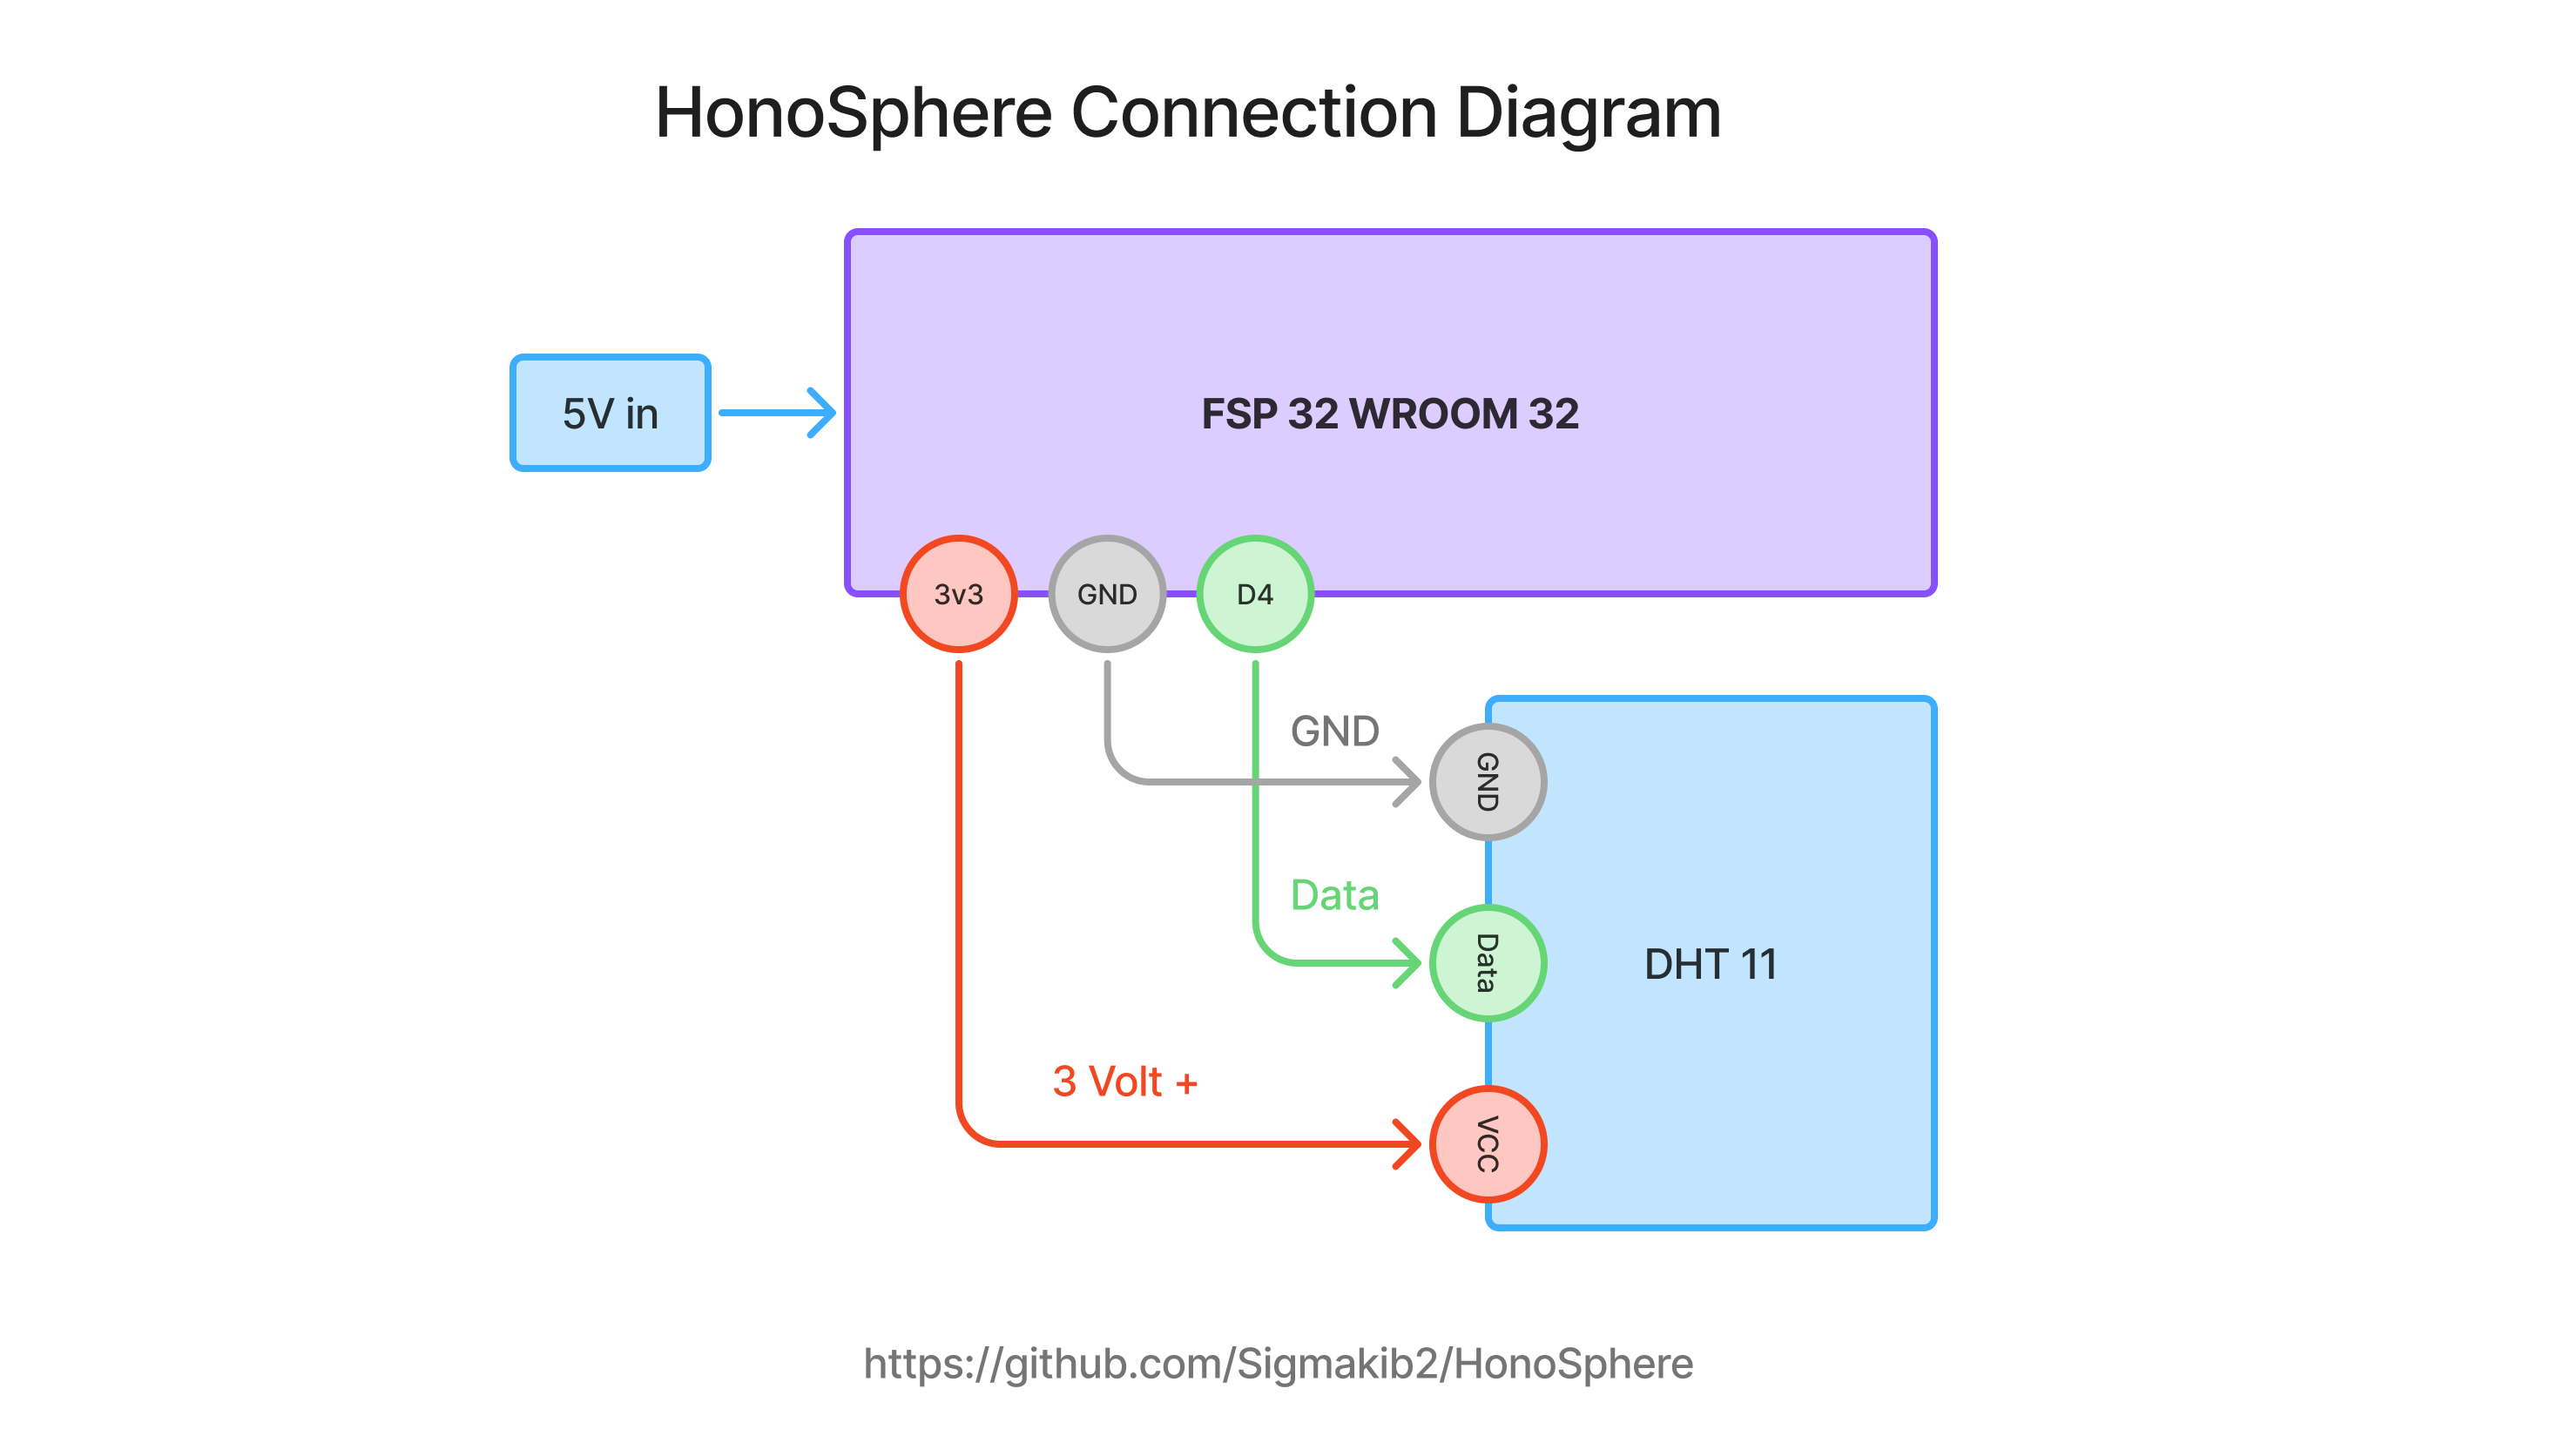
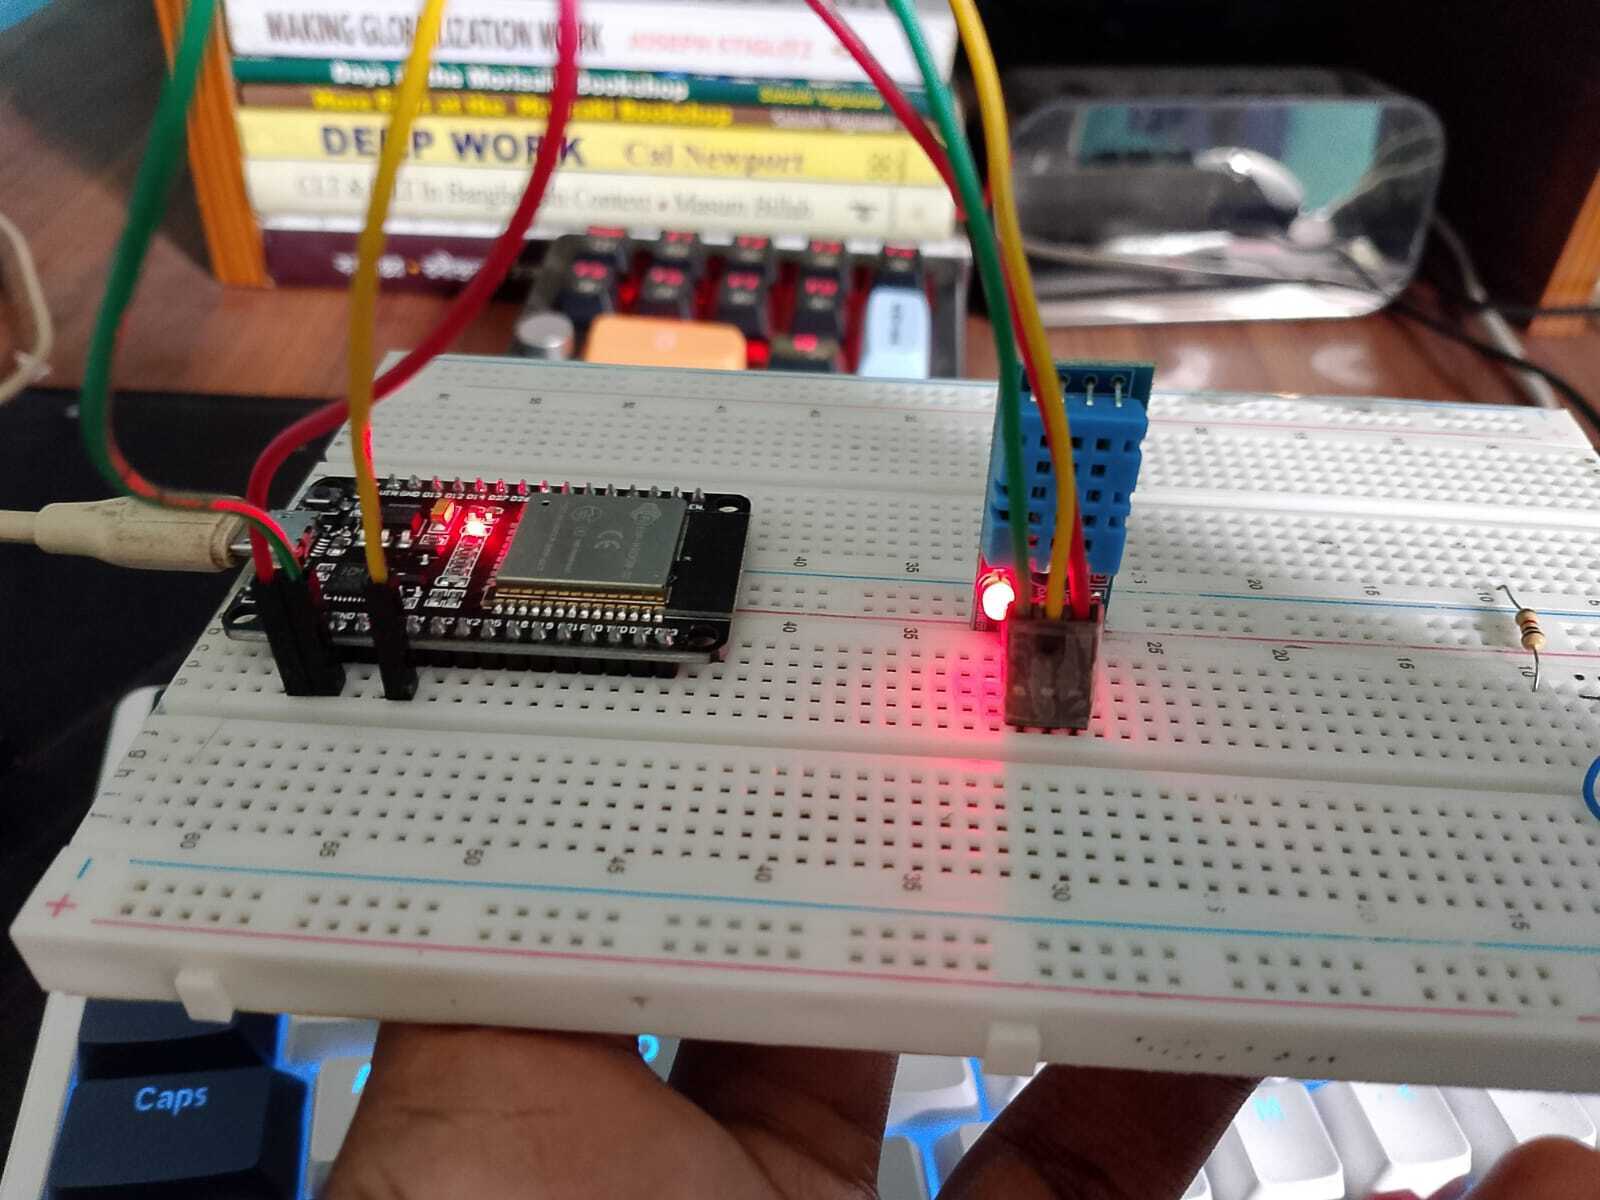
Follow the Connection Diagram to connect the ESP32 and DHT11 sensor.
- Navigate to the Firmware Directory:
cd esp32_firmware/sketch- Edit the
sketch.inoFile:
Open the file in the Arduino IDE (or your favorite editor) and update these settings:
// Wi-Fi Credentials
   const char* ssid = "Your_Wifi_SSID_or_Visible_name";
   const char* password = "Your_wifi_password";

   // Cloudflare Worker URL
   const char* serverURL = "https://cloudflare_worker..workers.dev/api/sensor";

   // API Key (must match Cloudflare Workers AUTH_KEY)
const char* apiKey = "YOUR_SECURE_API_KEY";- Upload the Firmware:
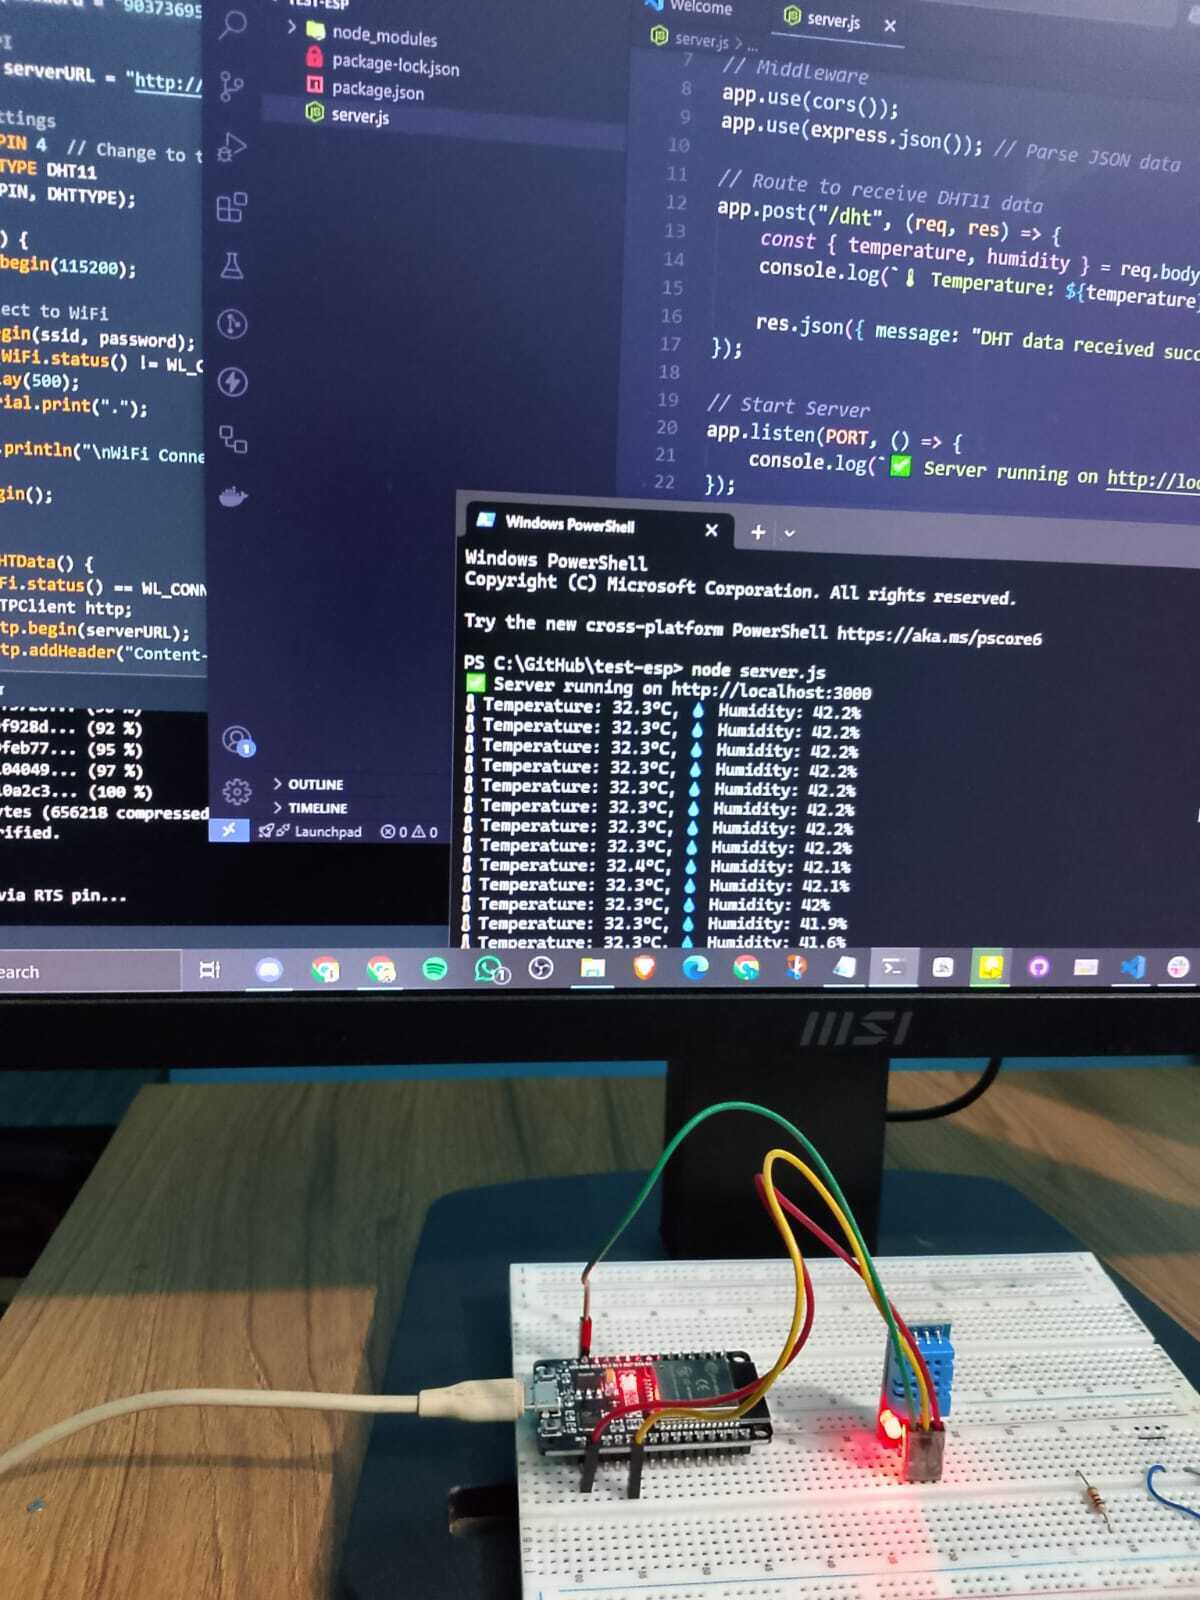
Compile and upload the sketch to your ESP32. Open the serial monitor and you should see messages like:
Connecting to WiFi...
Connected to WiFi ✅- Watch It Work:
Every 33 seconds, the onboard LED will blink to show that data is being sent. Check your Cloudflare D1 Database (under Storage & Databases → D1 SQL Database → honosphere → readings) to see your data logged.
API Endpoints
Your deployed Cloudflare Worker exposes the following API endpoints:
1. POST /api/sensor
What It Does:
Accepts sensor data from the ESP32 and stores it in the database.-
How to Use It:
- Headers:
-
x-api-key: Must match yourAUTH_KEY. - Body:
{ "temperature": 23.5, "humidity": 45 } -
Response:
- Success:
{ "status": "success" }- Failure (e.g., if the API key is wrong):
{ "error": "Unauthorized" }
2. GET /api/readings
What It Does:
Retrieves sensor readings, with optional filters.-
How to Use It:
Use query parameters such as:-
period(e.g.,'day','week', or'month') -
fromandto(custom timestamps in milliseconds) -
hoursorminutes(to get recent data)
-
Note: Use one filter type per request.
GET https://..workers.dev/api/readings?minutes=1- Response: Returns an array of sensor readings:
[
  {
    "id": 3652,
    "temperature": 33.9,
    "humidity": 48.9,
    "timestamp": 1742109887052
  },
  {
    "id": 3651,
    "temperature": 33.9,
    "humidity": 48.9,
    "timestamp": 1742109874901
  }
]- Error Handling: A 400 status code is returned for invalid parameters.
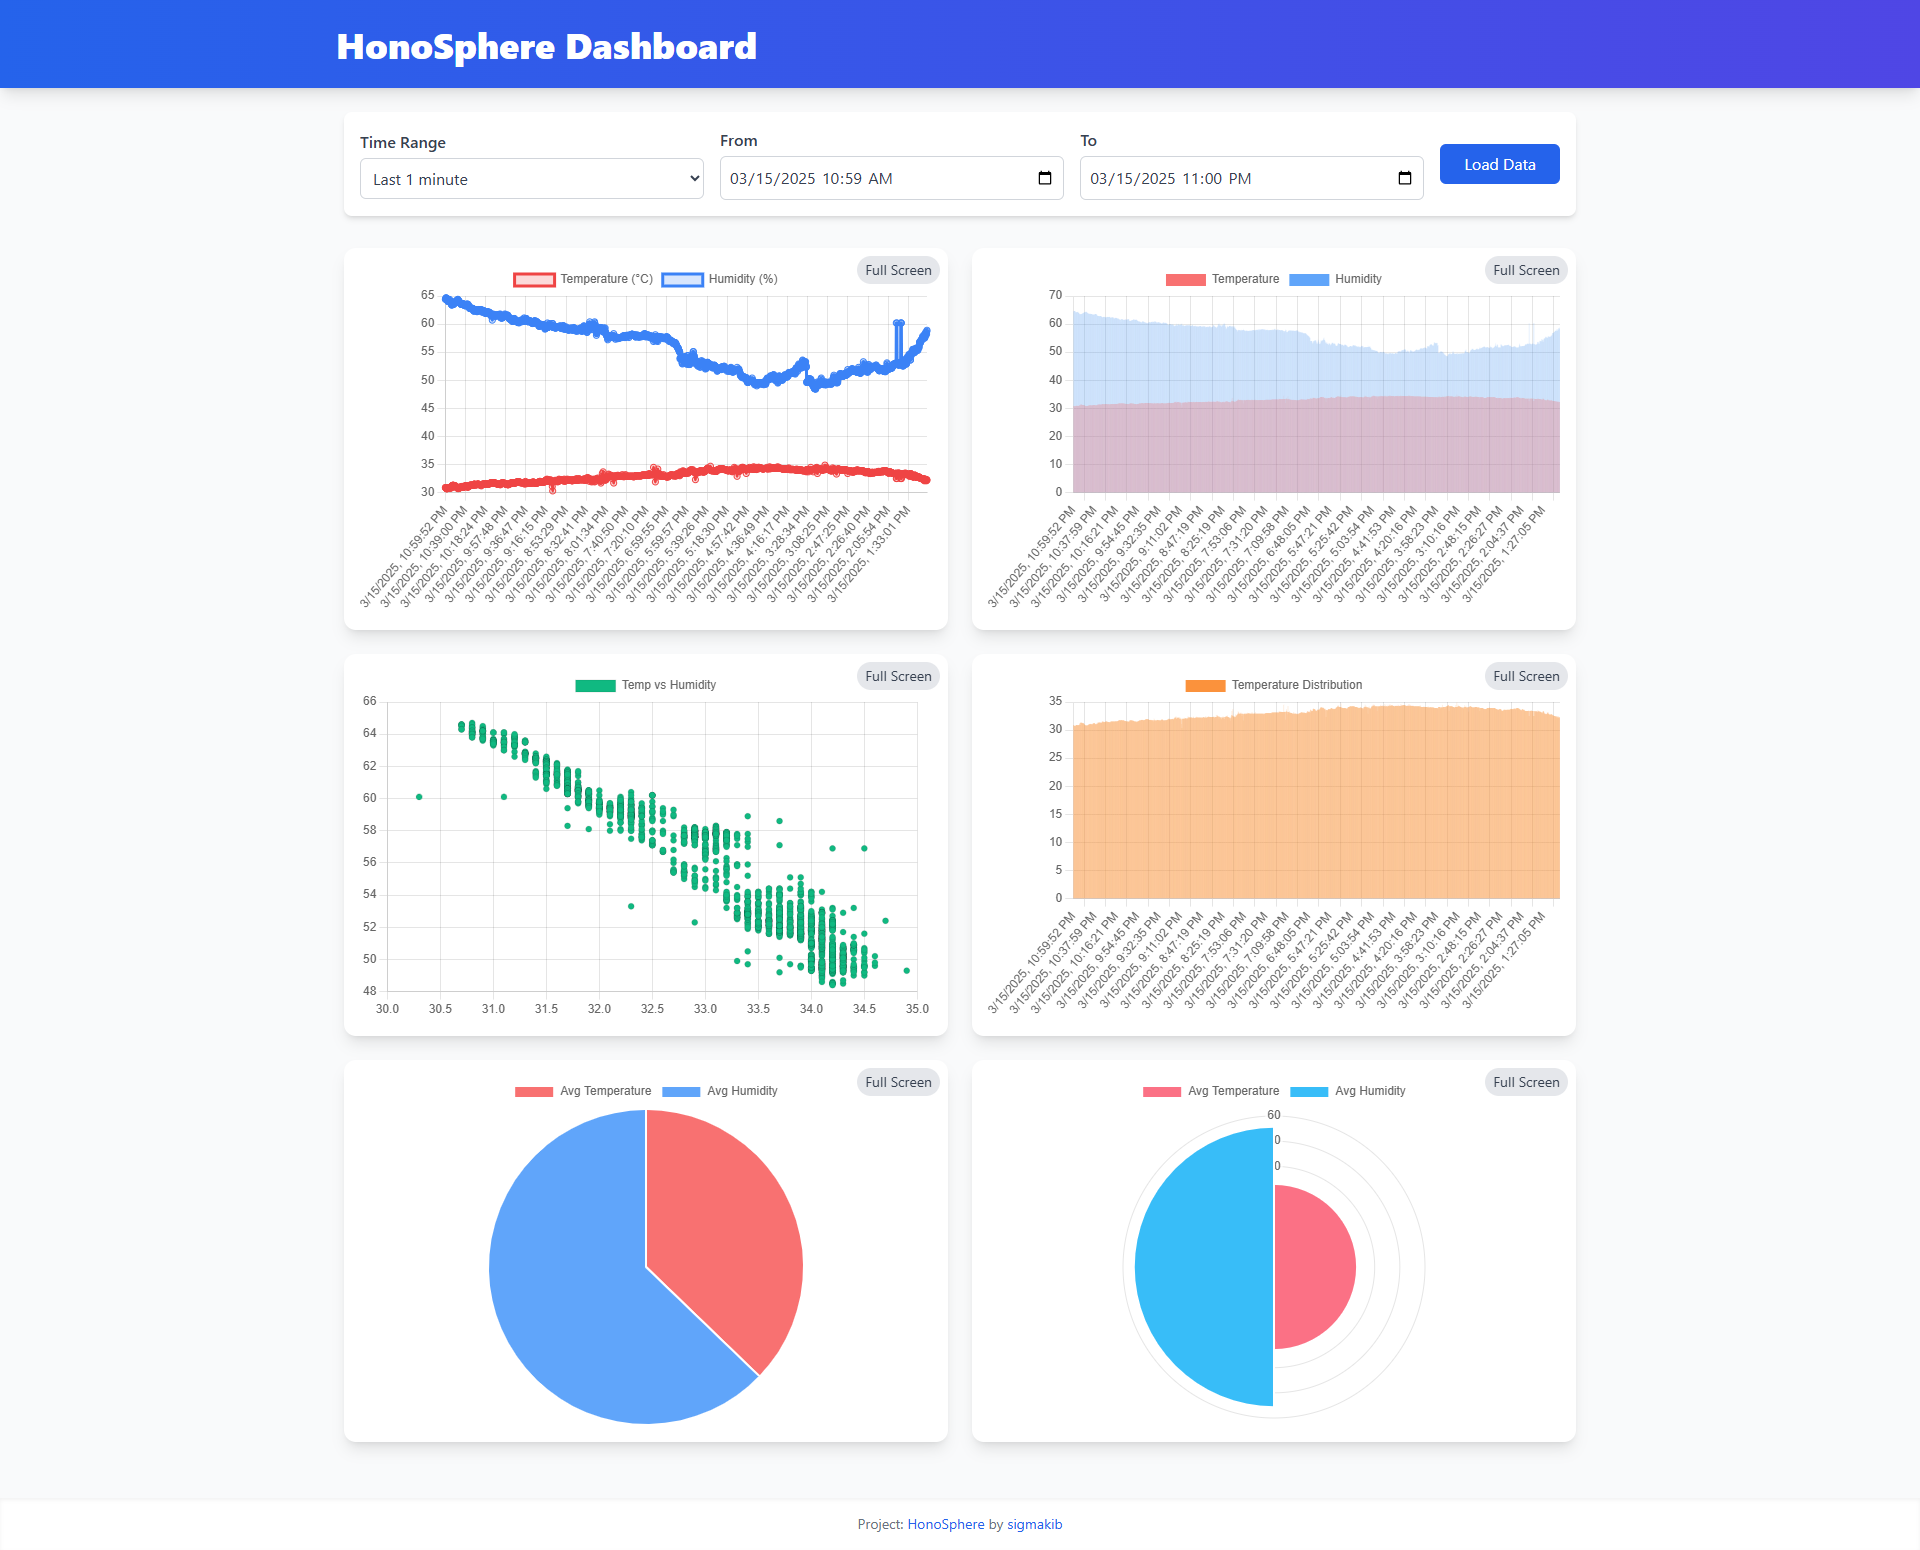
Dashboard
The HonoSphere Dashboard is a slick web interface that visualizes your sensor data through interactive charts like line, bar, scatter, histogram, pie, and polar.
Dashboard Setup
- Navigate to the Dashboard Directory:
cd dashboard- Update the Endpoint URL:
In the index.html file, find the script block that constructs the API URL and update the placeholder with your Cloudflare Worker endpoint:
async function fetchData() {
       let filter = document.getElementById('timeFilter').value;
       let fromDate = document.getElementById('fromDate').value;
       let toDate = document.getElementById('toDate').value;

       let url = `https://cloudflare_worker..workers.dev/api/readings?${filter}`;

       if (fromDate && toDate) {
           const fromTimestamp = new Date(fromDate).getTime();
           const toTimestamp = new Date(toDate).getTime();
           url = `https://cloudflare_worker..workers.dev/api/readings?from=${fromTimestamp}&to=${toTimestamp}`;
       }

       try {
           const res = await fetch(url);
           const data = await res.json();
           if (data.error) throw new Error(data.error);
           renderCharts(data);
       } catch (err) {
           alert('Error fetching data: ' + err.message);
       }
}- Launch the Dashboard:
Open the index.html file with a live server or your preferred method, and watch your data come to life in vibrant charts!
User Interaction Flow
- Select a Time Range: Choose a preset period (like last 1 minute, 1 hour, etc.) or set custom dates.
- Load Data: Click the Load Data button to fetch sensor readings.
- Visualize Charts: Your data is rendered in multiple charts—complete with zoom, pan, and full-screen features.
- Full-Screen Mode: Use the full-screen button on any chart for a closer look, and exit full-screen easily.
Plugins in Action
- Chart.js: Creates interactive, dynamic charts.
- chartjs-plugin-zoom: Enables smooth zooming and panning.
- Tailwind CSS: Ensures your dashboard looks sharp and responsive.
Additional Information
For a deeper dive, updates, or to contribute your own ideas, check out the HonoSphere GitHub repository. Enjoy exploring and monitoring your environment with HonoSphere—where tech meets nature in real-time!

Use Cases
HonoSphere’s versatility opens up a range of practical applications:
Home Automation:
Monitor your home’s climate and trigger smart devices like HVAC systems based on real-time data.Greenhouse Management:
Keep your plants happy by tracking and adjusting temperature and humidity levels for optimal growth.Office Environment Monitoring:
Maintain a healthy workspace by monitoring environmental conditions to reduce the risk of mold or discomfort.Remote Weather Station:
Set up a personal weather station to collect and share local weather data with your community or for educational projects.
Future Upgrades & Attachables
The journey doesn’t stop here! HonoSphere is designed to be expandable and upgradeable. Here are a few ideas for future enhancements:
Additional Sensors:
Integrate air quality, light intensity, or CO₂ sensors for a more comprehensive environmental analysis.Mobile App Integration:
Build a mobile app that delivers push notifications and real-time data visualization on the go.Machine Learning Analytics:
Use machine learning to predict trends and automate alerts when environmental conditions hit critical thresholds.Automated Actuators:
Connect devices like fans, humidifiers, or dehumidifiers that automatically adjust based on sensor data.Enhanced Dashboard Features:
Expand your dashboard with custom reports, historical data analysis, and more detailed filtering options.Community Data Sharing:
Create a platform for users to share and compare their environmental data, fostering a community of smart monitoring enthusiasts.
Wrapping Up
HonoSphere is more than just an IoT project—it’s a gateway to exploring the fascinating world of environmental monitoring, powered by the cost-effective and beginner-friendly capabilities of Cloudflare Workers. Whether you’re a hobbyist or a seasoned developer, HonoSphere provides an accessible platform to learn, innovate, and experiment with IoT technologies without breaking the bank.
For the full project details and source code, head over to the HonoSphere GitHub repository.
Happy coding, and here’s to building a smarter, more connected world!