Garmin devices collect an impressive amount of health and fitness data: heart rate, sleep, stress, respiration, SpO2, and more. But if you’re like me, you’ve probably wished for more flexibility in how that data is presented — and ideally, a way to combine it with other self-tracking sources.
So I built Garmin-Grafana: an open-source Python application that fetches Garmin data and feeds it into InfluxDB, so you can create rich, customizable health dashboards using Grafana. This script is available as a containerized docker application for easy deployment.
It’s free, open-source, and designed for people who love data — athletes, biohackers, or developers like me who want full control over their health visualizations.
What Garmin-Grafana Does
At its core, Garmin-Grafana automates the process of:
- Authenticating your Garmin account
- Fetching health, heart rate, sleep data, and activity data periodically
- Storing the data in InfluxDB database
- Visualizing the data using Grafana dashboards
You can track:
- Heart Rate Data
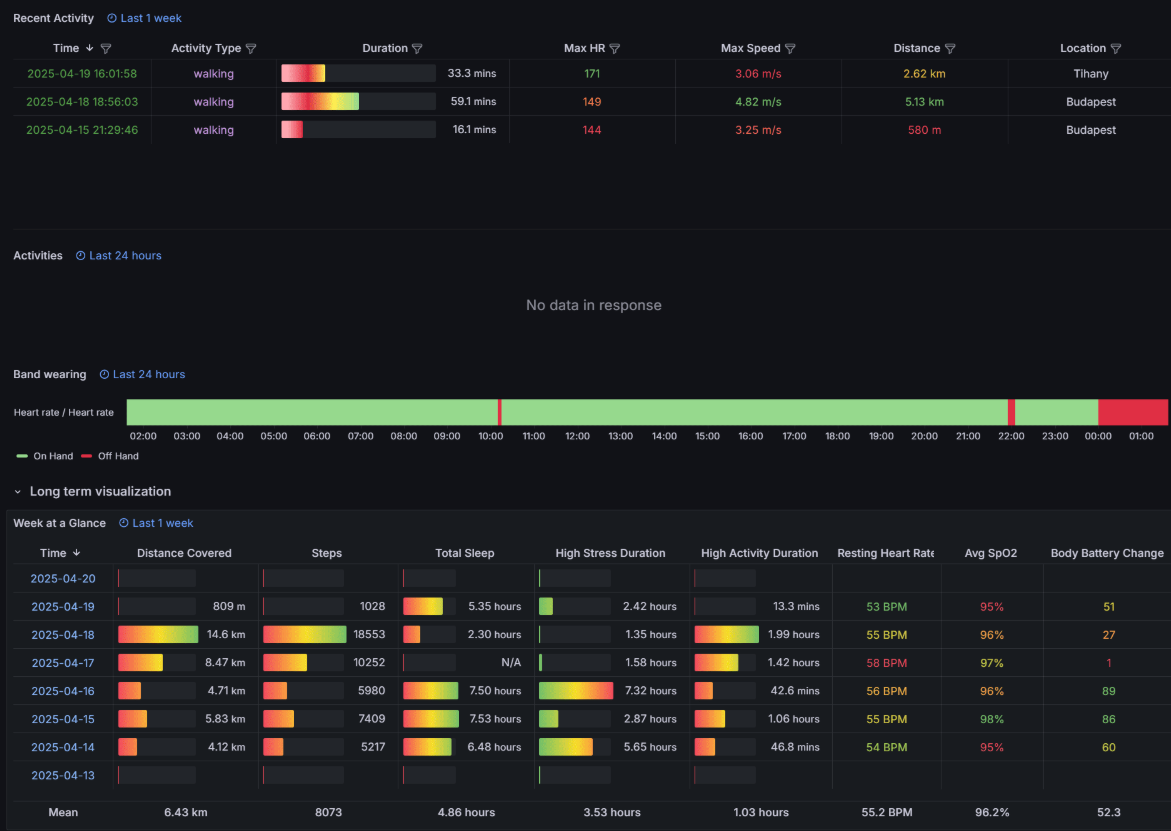
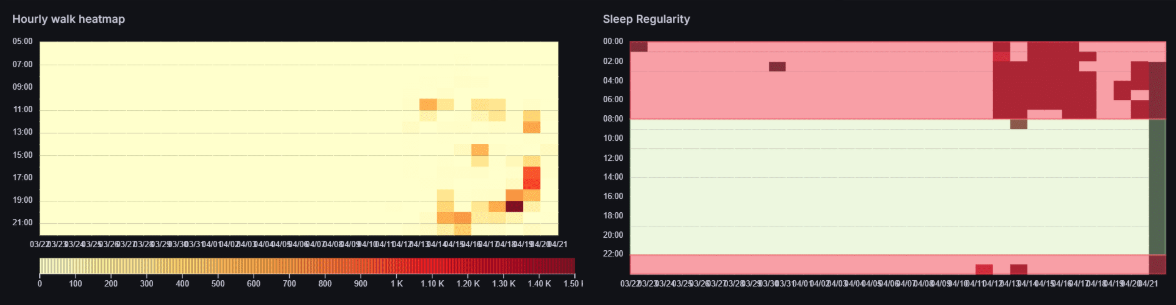
- Hourly steps Heatmap
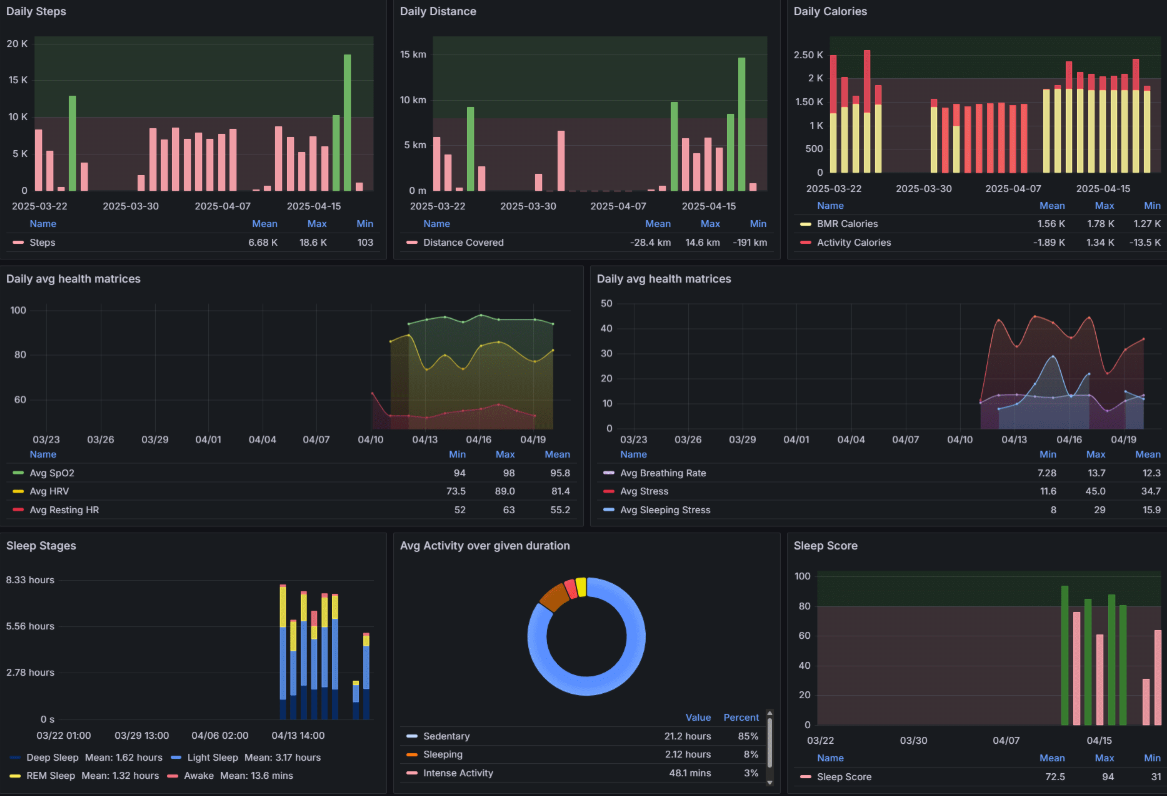
- Daily Step Count
- Sleep Data and patterns (SpO2, Breathing rate, Sleep movements, HRV)
- Sleep regularity heatmap (Visualize sleep routine)
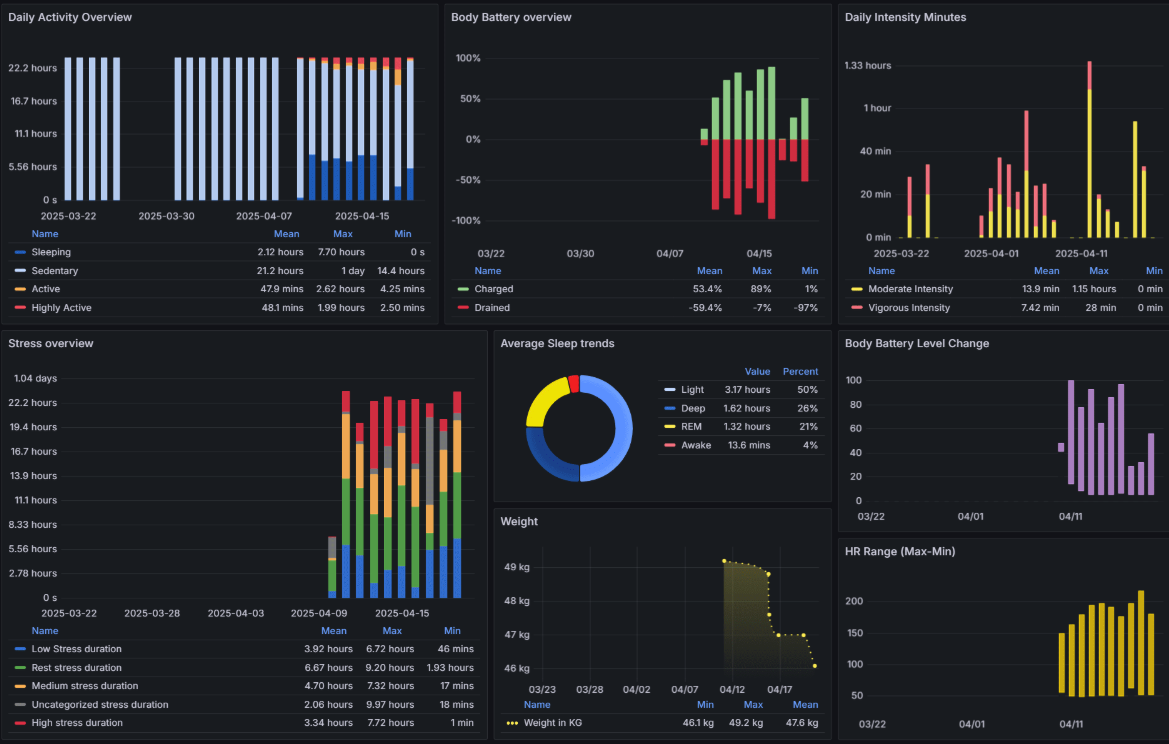
- Stress Data
- Body Battery data
- Calories
- Sleep Score
- Activity Minutes and HR zones
- Activity Timeline (workouts)
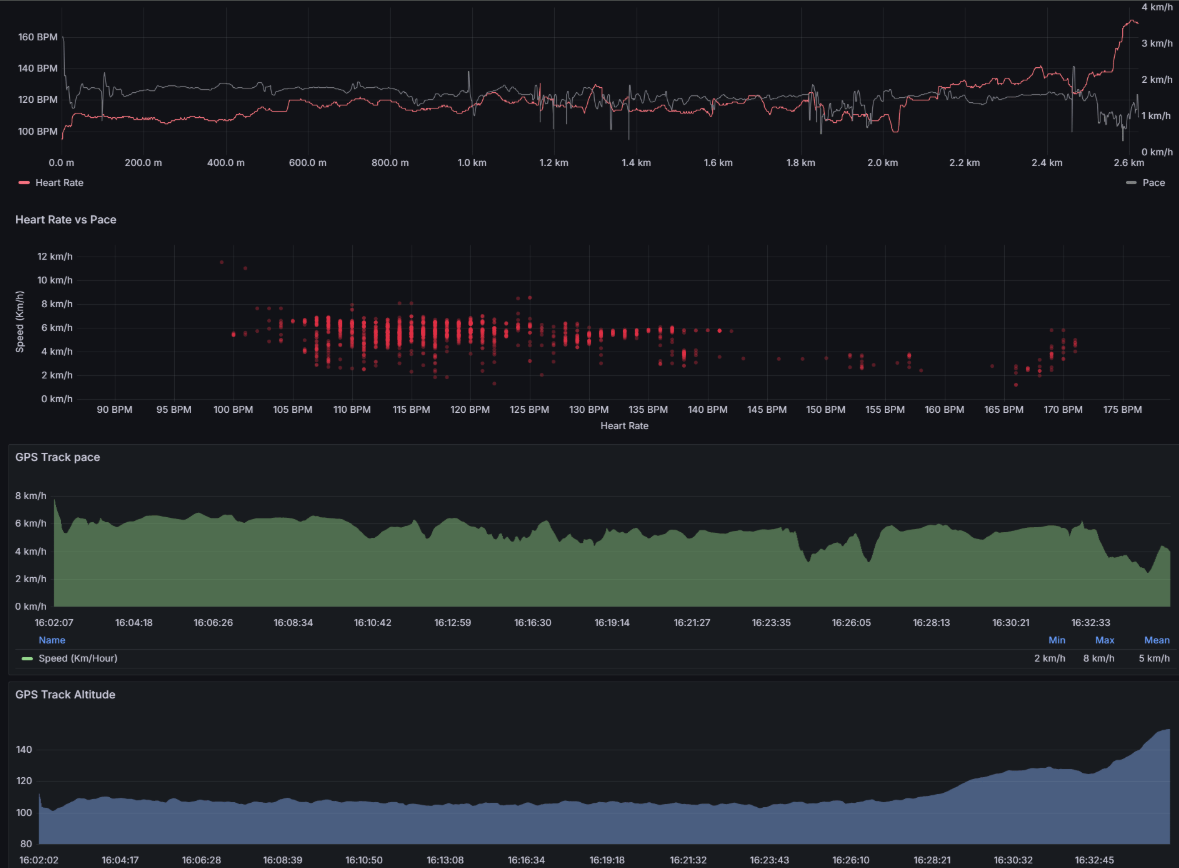
- GPS data from workouts (track, pace, altitude, HR)
- And more…
You can easily pull your past historical data using this tool, no matter how far it goes back. So if you are a long term Garmin user, this tool will serve you well.
Data is yours. Host it privately. Visualize it however you want.
Why I Built It
I wanted a personal health dashboard that could:
- Go beyond Garmin Connect’s limited graphs — the Grafana panels are infinitely customizable.
- Be fully open, self-hosted, and free of cloud lock-in
- Keep a local copy of my own health data for long term trend analysis
InfluxDB and Grafana are perfect for time-series data — but Garmin doesn’t provide a public API for personal health data access. So I wrote a workaround using the unofficial Garmin API that syncs the data on a schedule and populates it in the InfluxDB database.
How to Get Started
It’s surprisingly easy to set up if you’re familiar with Python and Docker. Otherwise, following the detailed guide will still get you there.
Please check out the GitHub project page for the installation instructions.
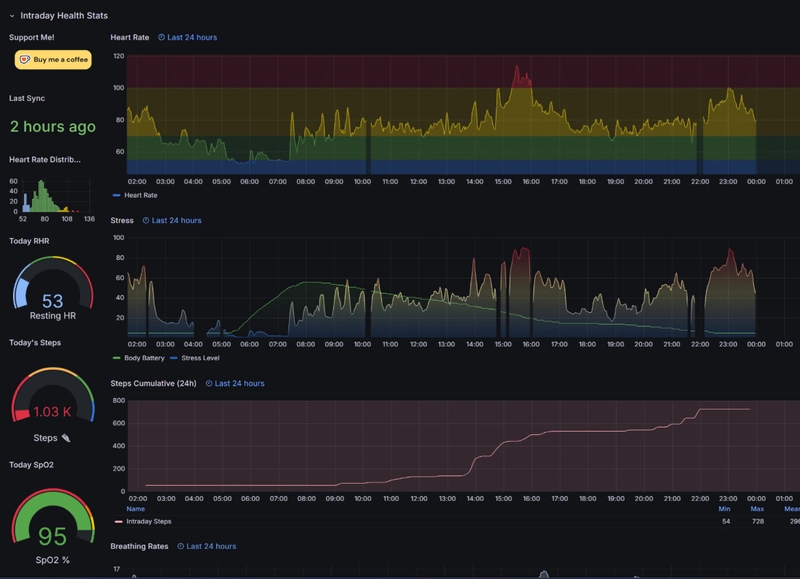
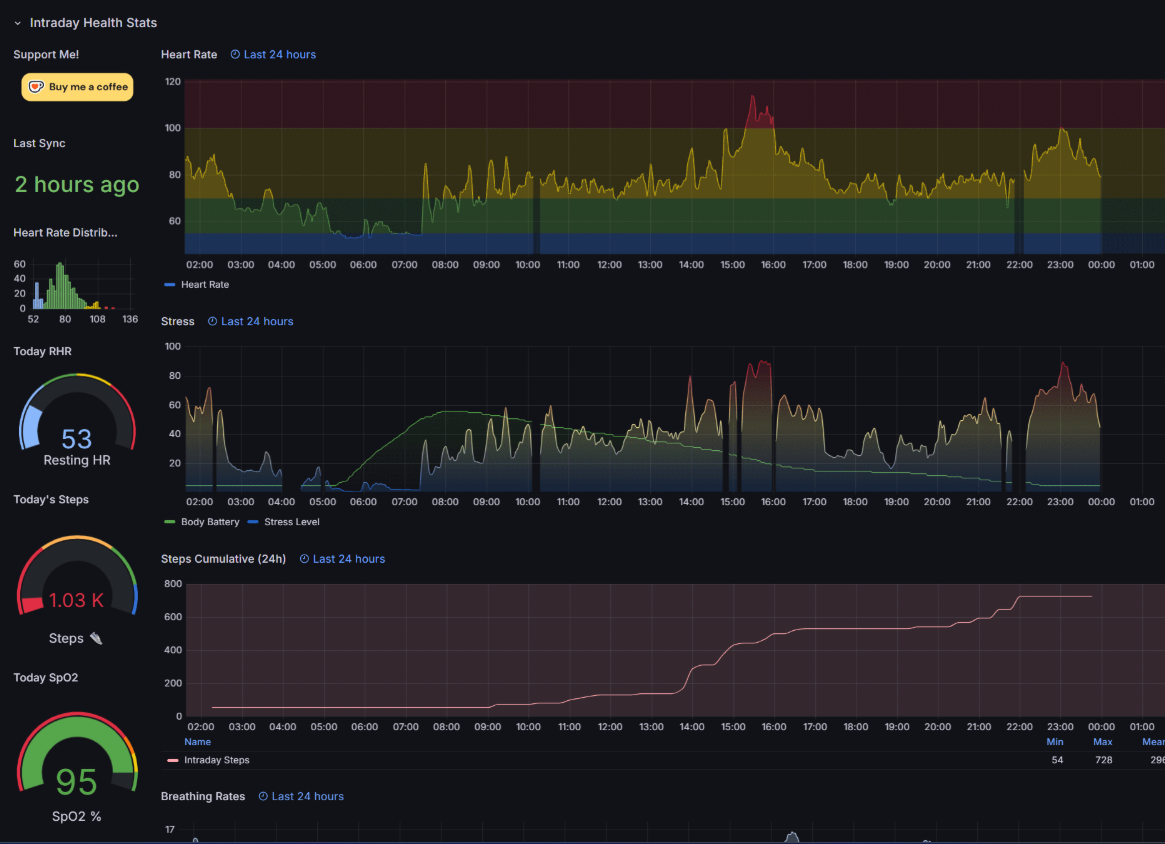
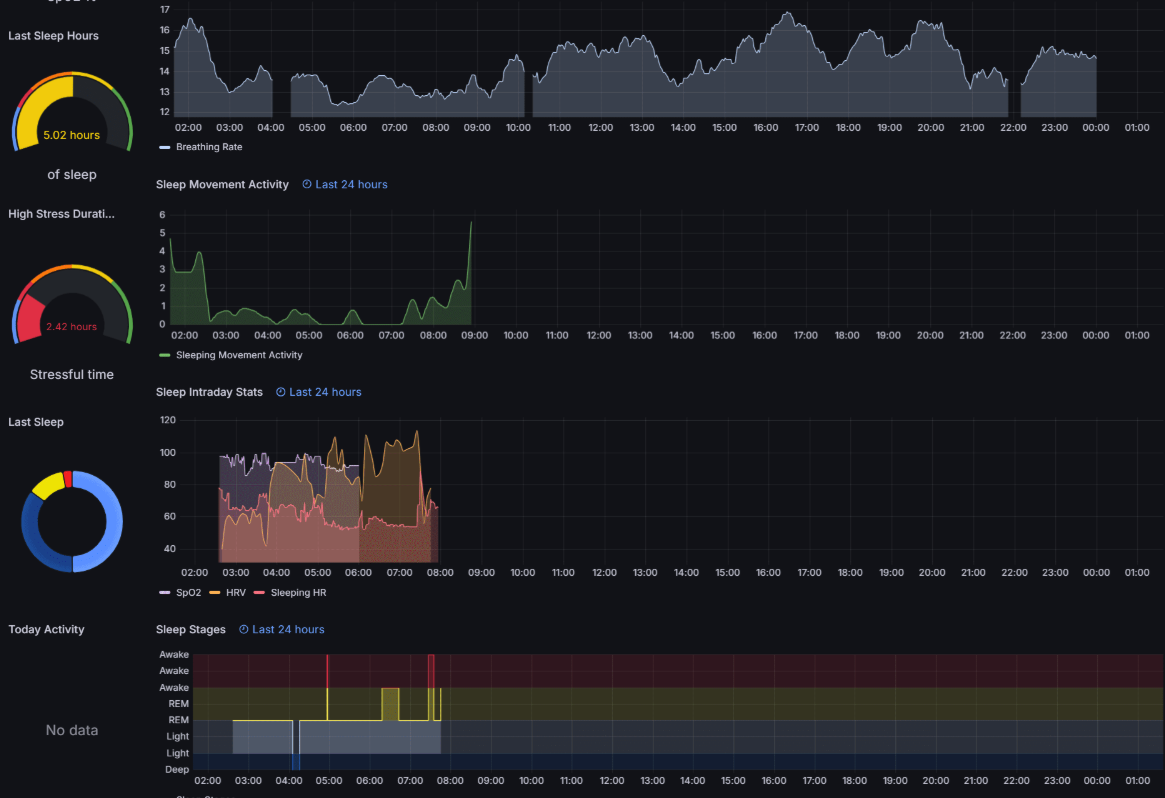
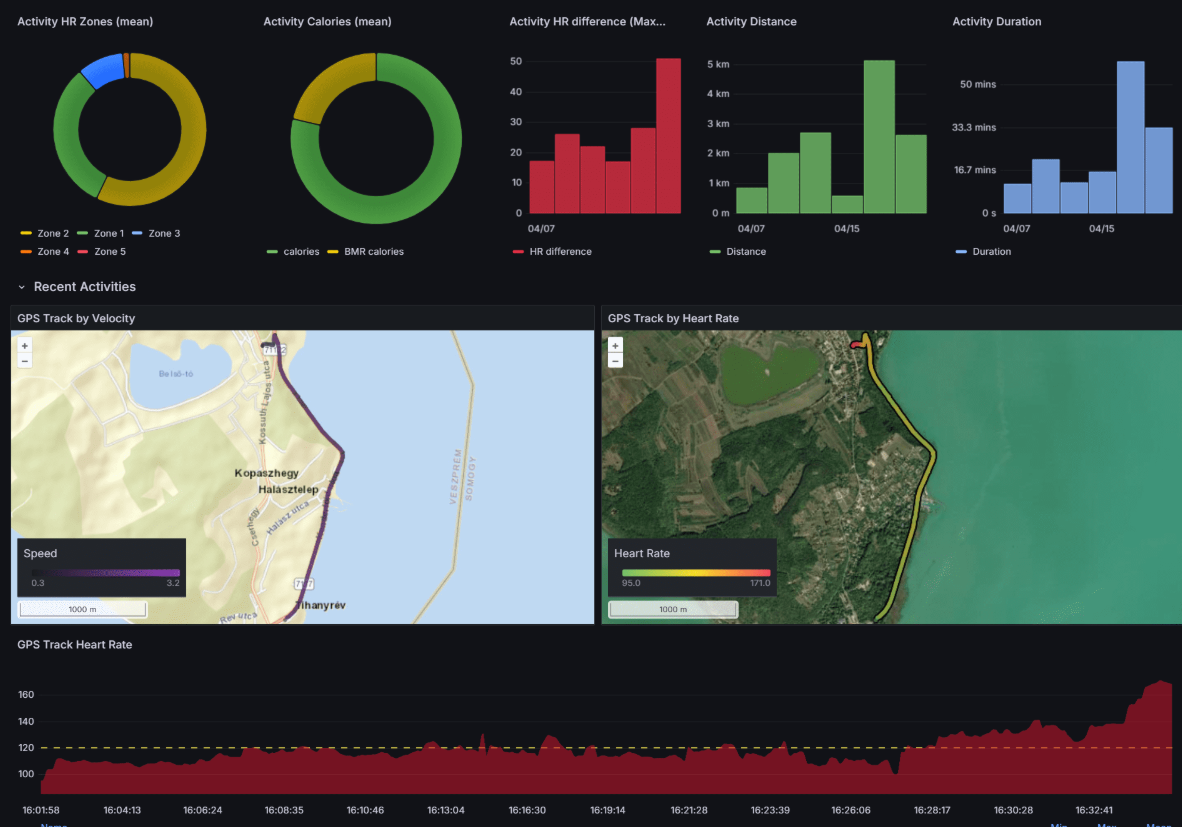
Example Dashboards
Here’s a quick look at what you can build. I have provided this sample dashboard JSON as a quick start.
Privacy First
Your health data stays local. No third-party services. No cloud sharing (You share it only with Garmin as they are the service provider). If you’re privacy-conscious or just want ownership over your data, this setup is for you.
Feedback or Collaboration?
I’d love to hear from you! Whether you’re using the tool, customizing it, or want to contribute — feel free to open an issue or drop me a message.
If you’re into self-tracking, open data, or wearable hacking, I hope this helps you dig deeper into your Garmin insights. Follow me for more open-source tools and personal data projects.
Let’s keep exploring what our devices can really tell us.