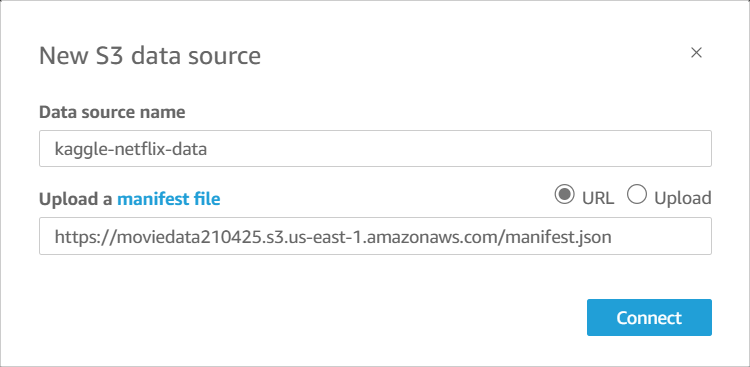
Upload your dataset and the 'manifest.json' file into S3
- S3 is used in this project to store my dataset and manifest.json file.
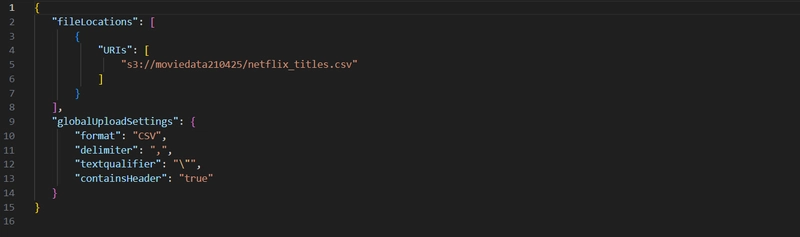
- I edited the manifest.json file by updating the S3 URL of my dataset.
- It's important to update this file so that the manifest.json file won't be pointing to the wrong address.
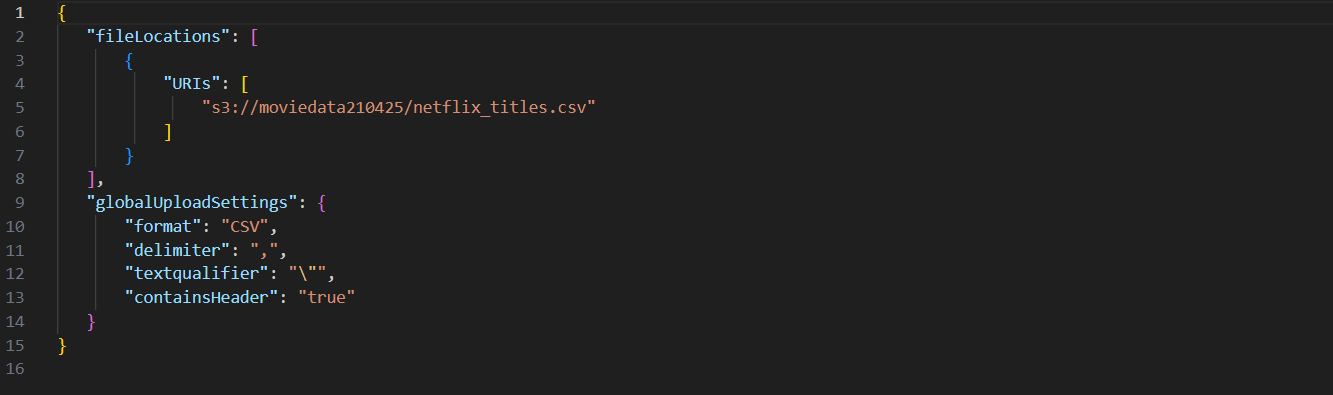
Updated manifest.json file.
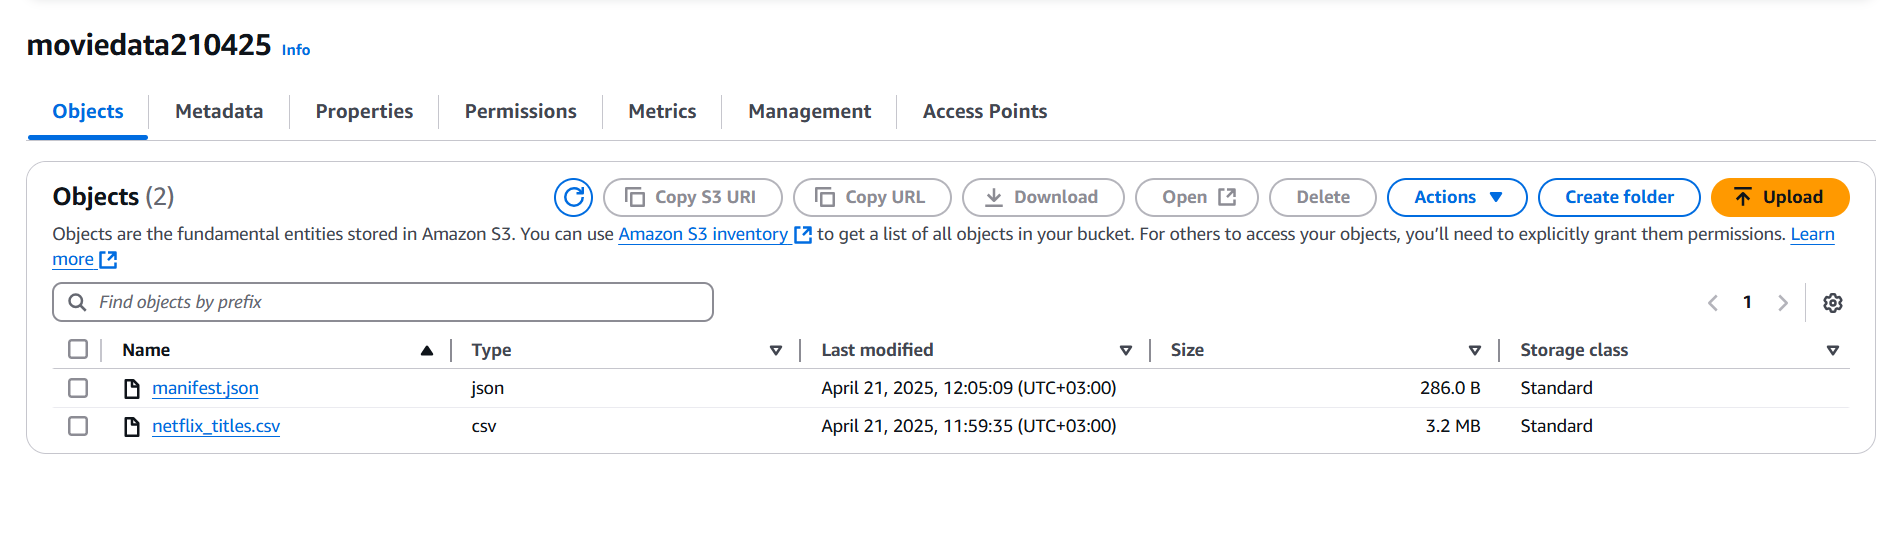
Here is my bucket with CSV and manifest files.
Create your Amazon QuickSight account
- QuickSight account is free to create and the free trial lasts for 30 days. It took about 2 minutes to create.
- I also had to enable QuickSight's access to S3 because my dataset is stored in a S3 bucket and specific access is required to access my dataset.
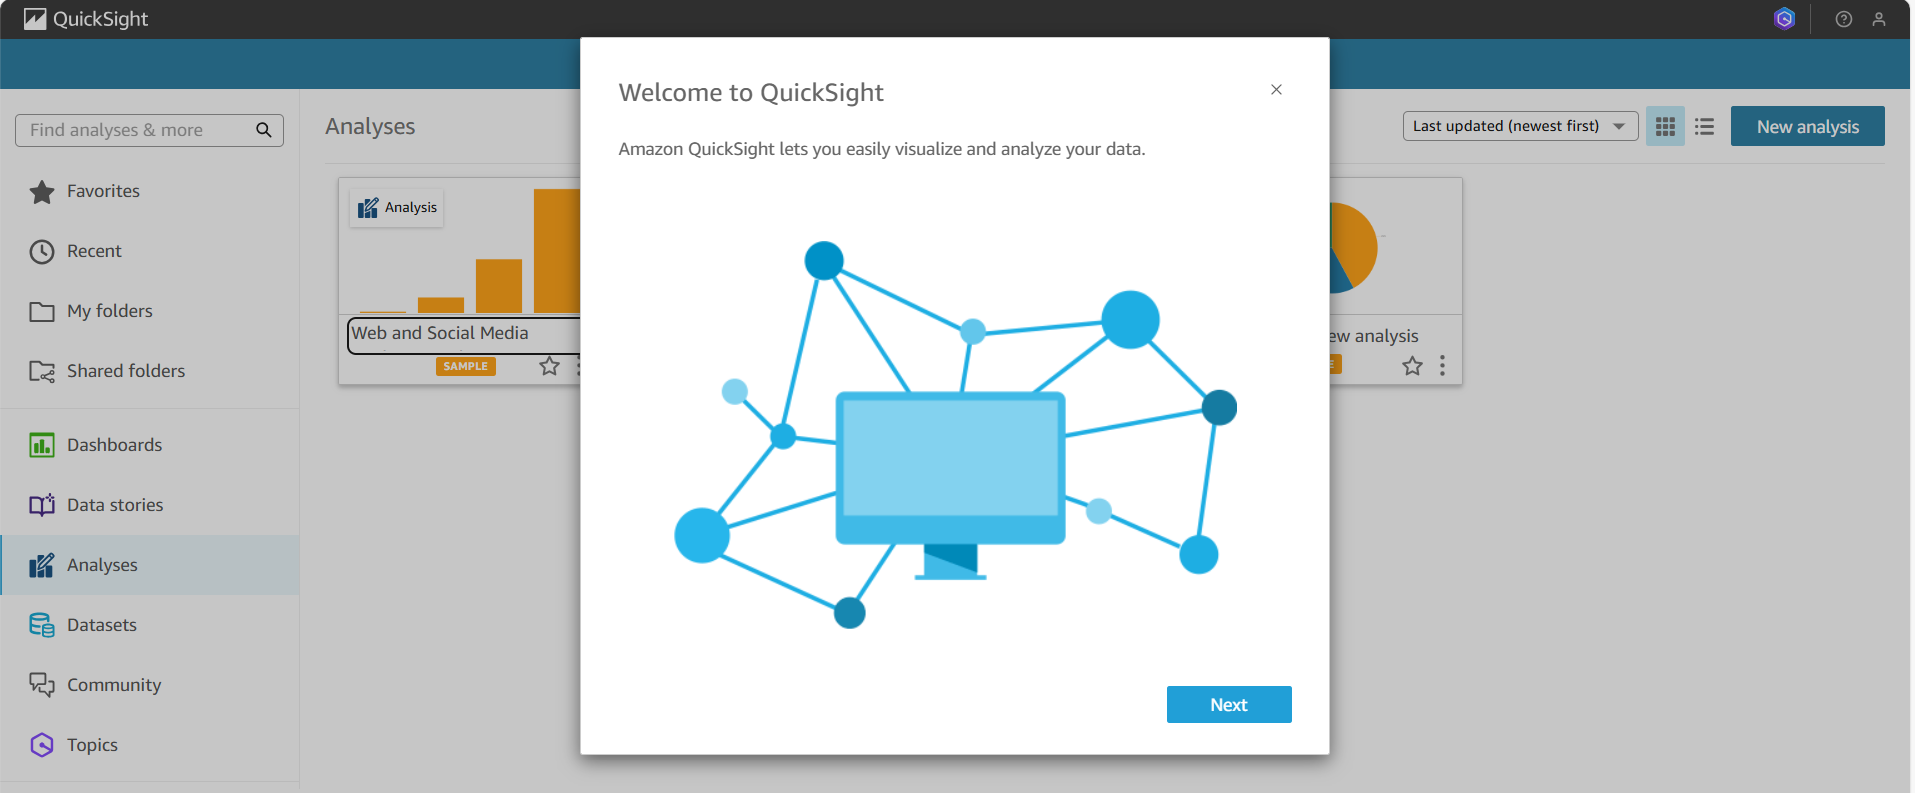
I created a QuickSight account
Why was the manifest file important
- The manifest.json file was important in this step because it acts as a map to guide QuickSight on where the file is located and how it should classify the data
Let's make visualizations
To create visualization on QuickSight you will have to drag fields you want to visualize into the QuickSight AutoGraph field.
The graph shown here is a breakdown of movies vs tv shows released each year. I created this graph putting the release year on the Y axis and making the type movie/tv show the grouping variable.

My first visualization
Using filters
Filter are useful for specifying data that you want to analyze. Here I added a filter by excluding movies and tv shows released before 2015.
This helped me create a visualization on movies released from 2015 onwards.
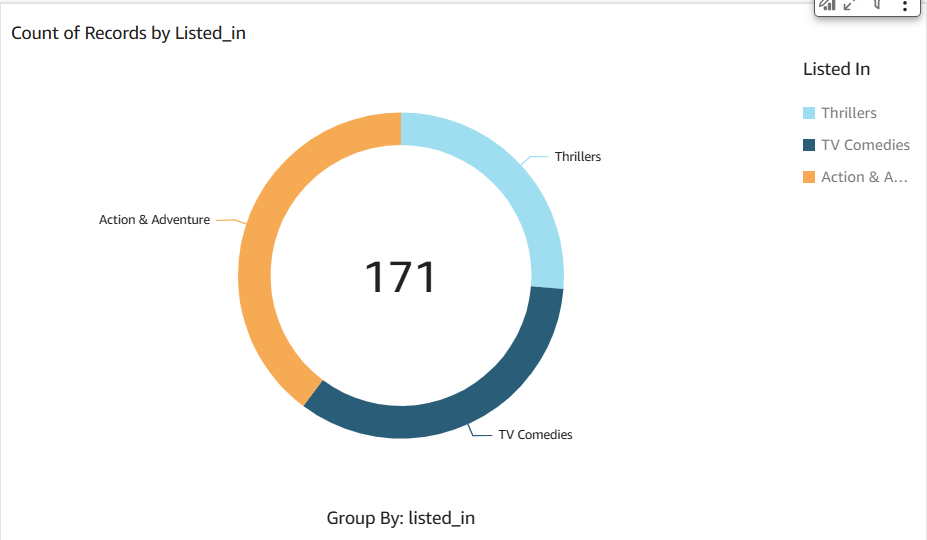
Visualization after filtering
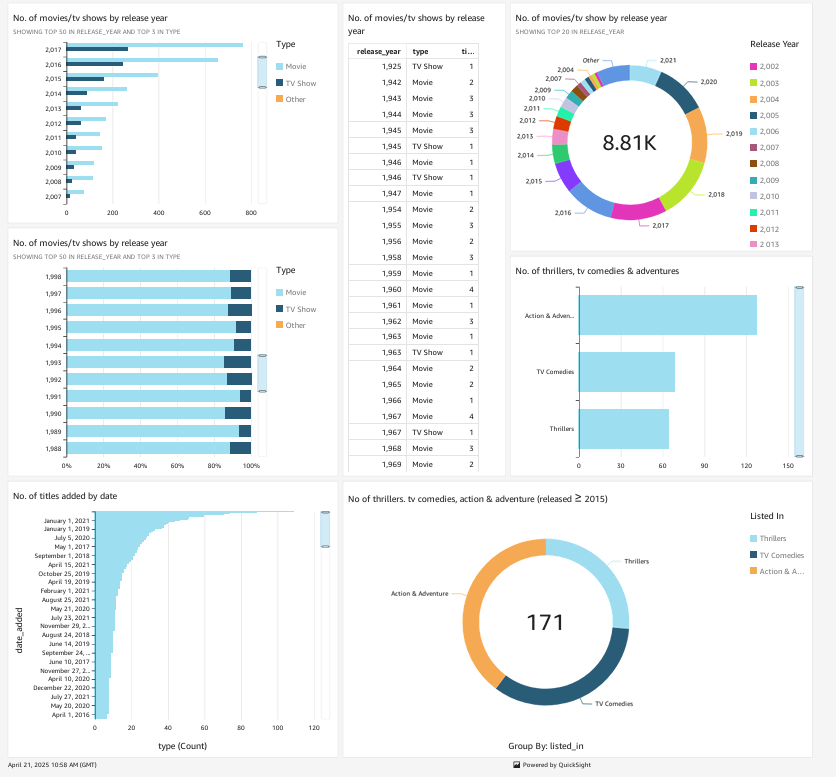
Set up your dashboard
As a finishing touch, I edited titles of my graph so that the charts are readable.
Did you know you could export your dashboard as a PDF file? I did this by publishing the dashboard and clicking the export function.
My Key Learnings
- QuickSight is a quick data visualization service.
- QuickSight makes data visualization easy especially using a drag and drop feature.
Final Thoughts
- Always clean up your project to keep it under free tier account :)
- Now that I know how to use QuickSight, in the future i'd use it to practice data visualization using other types of data.
- An area of data visualization i'd like to explore is making animated presentation with the data.