Have you ever stared at a massive JSON file and thought, "There’s got to be a better way to understand this"?
Yeah, me too.
Whether you’re working with API responses, complex configs, or nested schema definitions, turning raw JSON into a visual flowchart or diagram can save you tons of time and mental energy.
In this guide, I’ll show you how to turn any JSON data into a beautiful, interactive flow – in seconds.
No code required. 🙌
🚀 Step 1: Head over to jsonviewer.tool
It’s a free, powerful JSON visualization tool I’ve been working on that supports:
📂 Uploading JSON, YAML, or CSV
🌳 Tree view and Graph view
🔄 Flow direction toggle
✂️ Field removal for cleaner views
📸 Exporting diagrams as PNG
✨ Mind map and compact graph mode
📤 Step 2: Upload or Paste Your JSON
Drop your file or just paste your JSON into the editor.
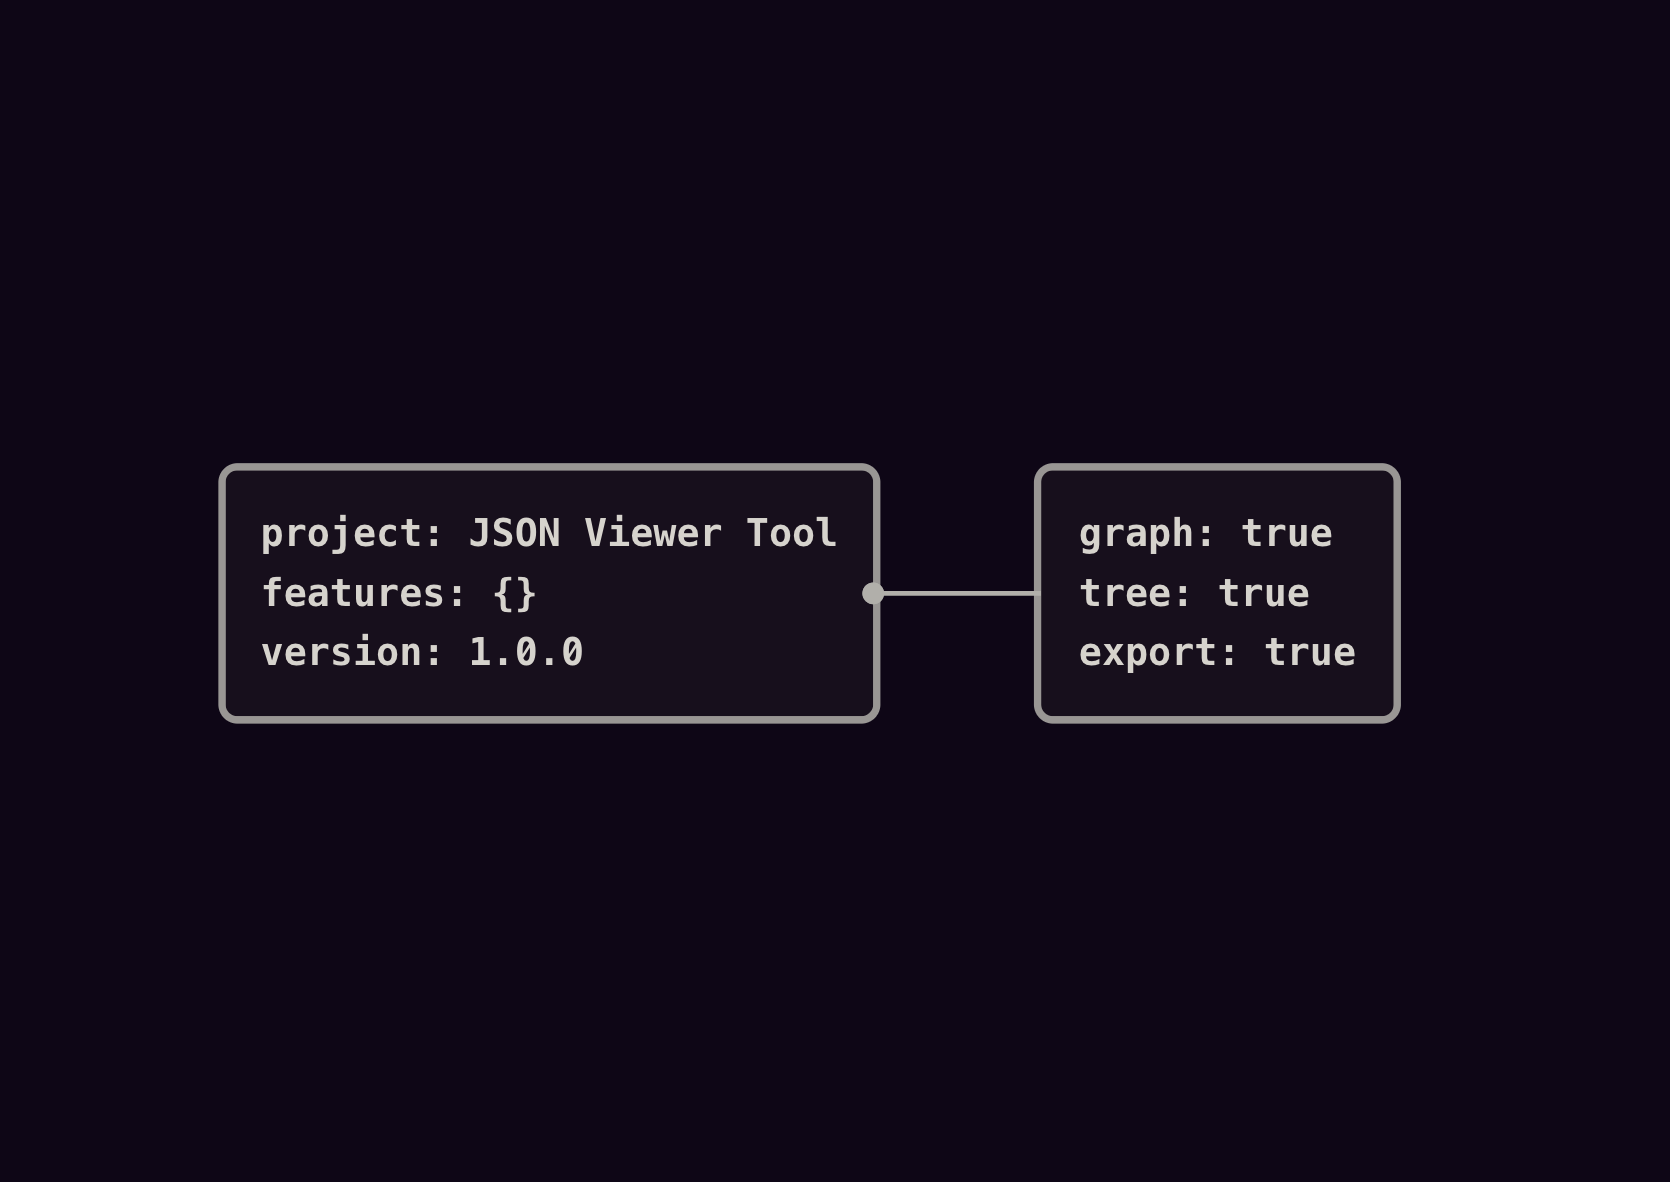
For example, here’s a simple JSON:
{

  "project": "JSON Viewer Tool",

  "features": {

    "graph": true,

    "tree": true,

    "export": true

  },

  "version": "1.0.0"

}
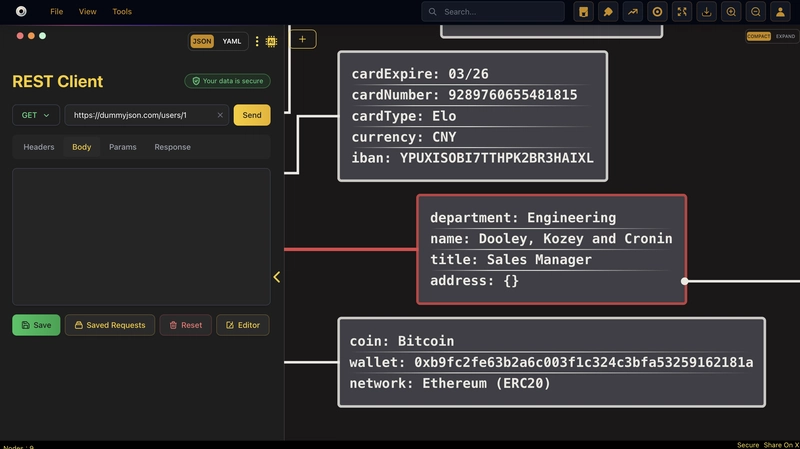
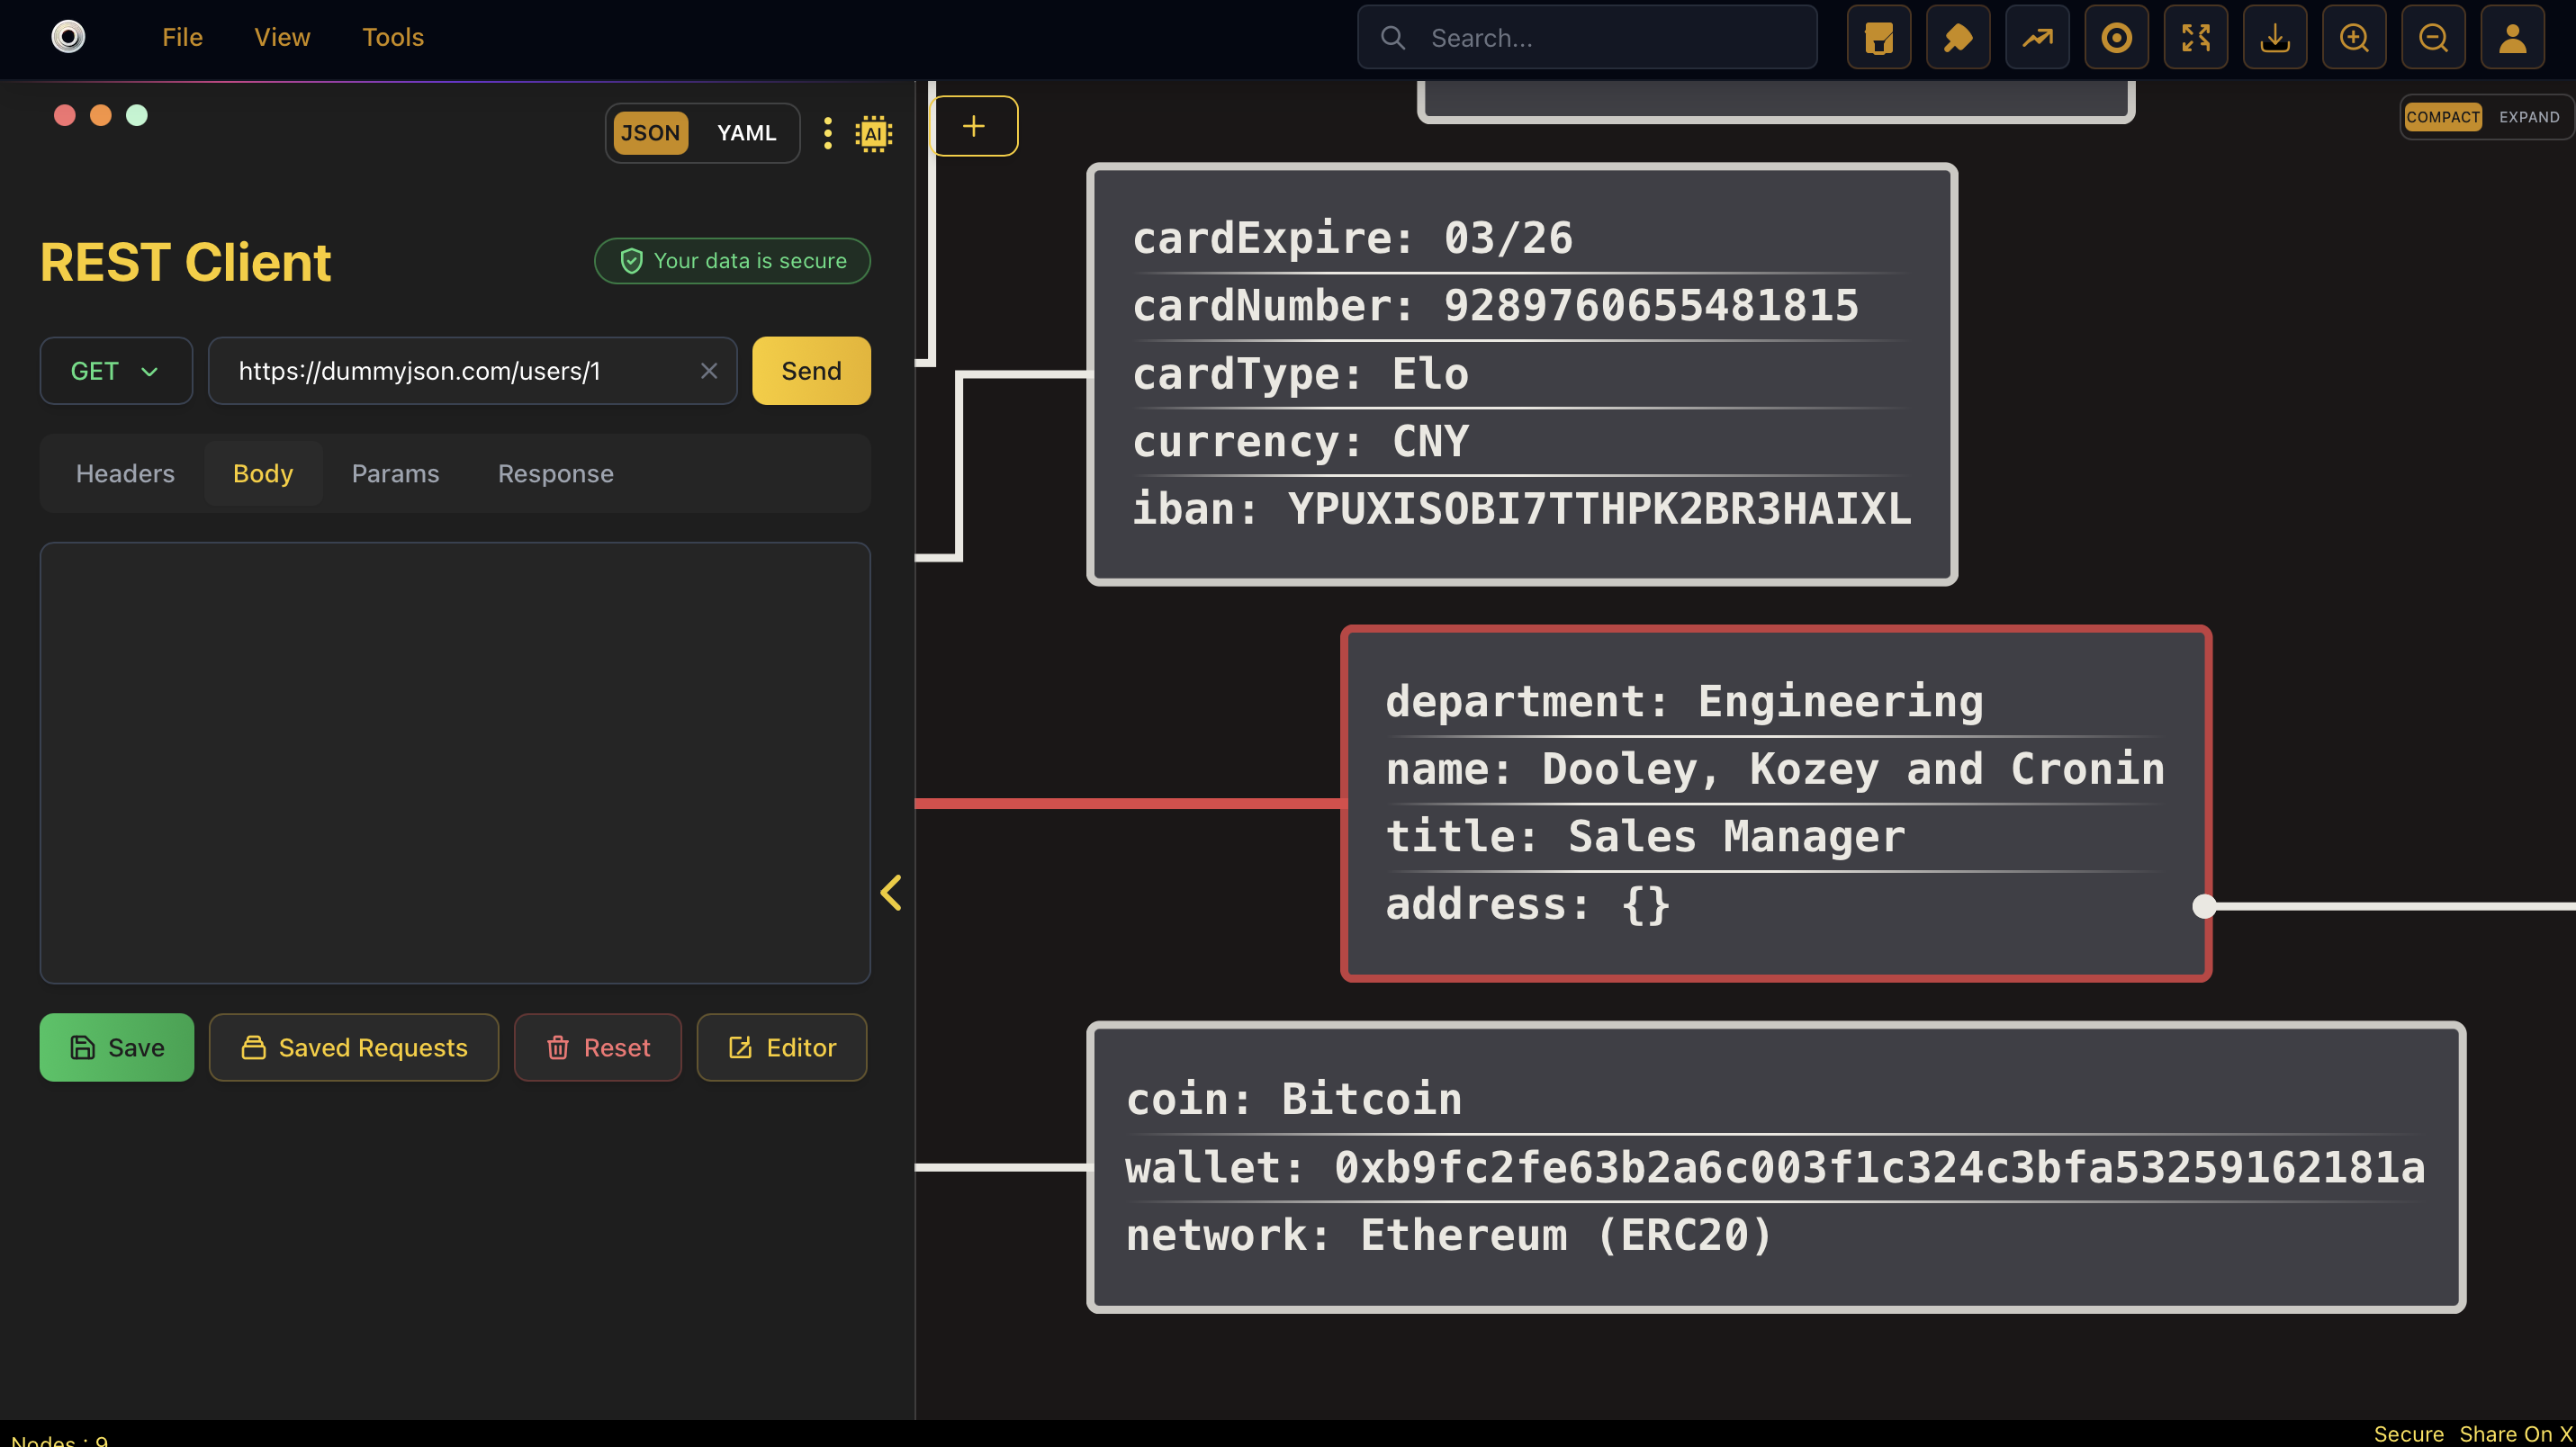
Once added, you’ll see both a tree representation and a graphical diagram instantly.
🎯 Step 3: Double-Click to Dive Deep
Double-click any key in the tree view, and boom – you’ll get a focused graph view of that node.
This makes debugging or understanding deeply nested objects effortless.
🛠 Pro Tips
Use the direction switch to toggle between vertical and horizontal flows.
Want a minimalist flow? Try the compact mode.
Need a PNG for documentation or a presentation? Hit Export as Image.
🧩 Use Cases
Designing flowcharts from backend configs
Visualizing API responses
Teaching or explaining nested data structures
👨💻 Built for Devs, by a Dev
I built jsonviewer.tools to make dev life easier. It’s completely ad-free and focused on being fast and simple to use for premium.