⚙️ Prerequisites:
- Docker installed and configured (I'm using wsl and ubuntu)
- Api using Elasticsearch for logging (I'm using Node.js)
Create a shared newtwork using Docker
docker network create monitoringStart the Elasticsearch container
docker run -d --name=elasticsearch --network=monitoring -p 9200:9200 \
  -e "discovery.type=single-node" \
  -e "xpack.security.enabled=false" \
  docker.elastic.co/elasticsearch/elasticsearch:8.12.0
Check if Elasticsearch is running
curl -X GET "http://localhost:9200"Start the Grafana container
docker run -d --name=grafana --network=monitoring -p 3003:3000 grafana/grafanaAccess Grafana using http:localhost:3003. The default user is "admin" and password is "admin" as well.
Check if Grafana can connect to Elasticsearch by following these steps:
docker exec -it grafana shcurl -X GET "http://elasticsearch:9200"If the DNS was not resolved, check the shared network again or try using Elasticsearch's IP instead of the DNS.
Now, you can configure Elasticsearch in Grafana using the interface (http:localhost:3003).
Go to: Configuration -> Data Sources -> Add data source -> Elasticsearch
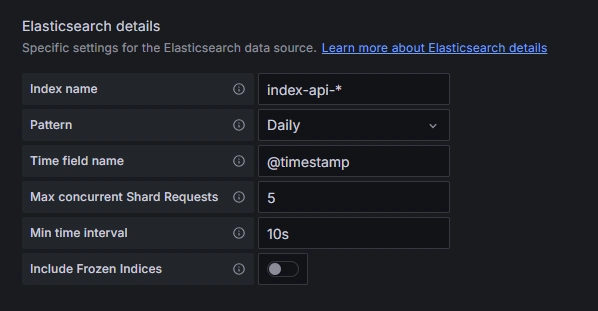
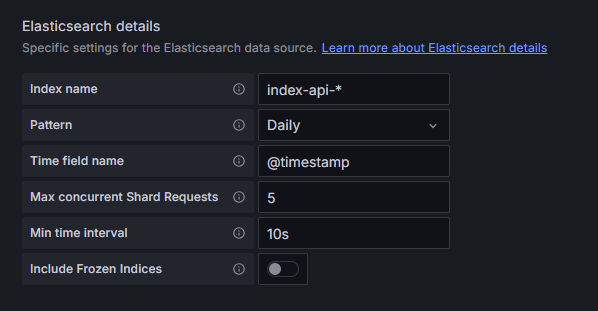
Fill in the information:
- URL Connection: http://elasticsearch:9200 or http://ip-addess:9200
- Elasticsearch details according to your API configuration. ⚠️Remember that you should run your API first to generate logs and to register an index.
✅ Ok! to view your logs, go to 'Explore' in Grafana.
❌ If problems happen, you can investigate:
You can check the available indexes in Elasticsearch using:
curl -X GET "http://localhost:9200/_cat/indices?v"To see your specific index configuration (replace with your API's index name):
curl -X GET "http://localhost:9200//_mapping?pretty"To see if logs are beeing registered in Elasticsearch:
http://localhost:9200/_all/_search?pretty