Clients Dashboard

Overview:
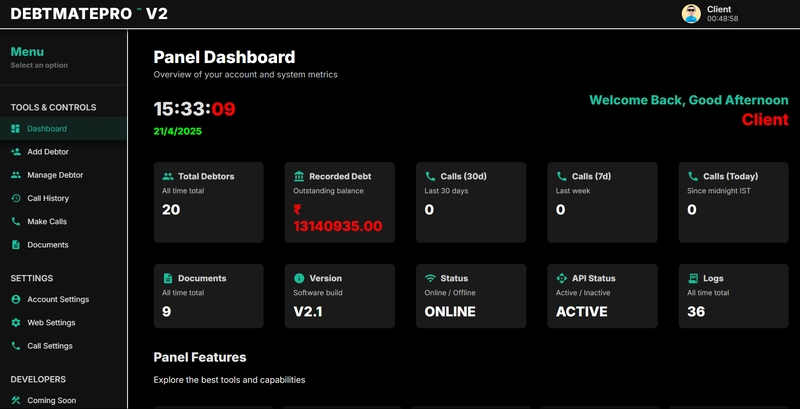
This page serves as a comprehensive and dynamic Panel Dashboard designed to provide real-time insight into key account and system metrics. It fuses modern design elements, smooth animations, and responsive layouts to deliver an exceptional user experience.
Greeting Section:
Dynamic Greeting & Date/Time:
A greeting block dynamically updates to display a personalized welcome message ("Welcome Back, Good [Morning/Afternoon/Evening]") based on the current IST time.
The current date is shown in bold green, while the time is segmented into hours/minutes and seconds—with seconds highlighted in red—offering a clear, real-time display.
Metric Cards Section:
Data Visualization:
The dashboard leverages a grid layout to present various data cards. Each card displays a specific metric (e.g., Total Debtors, Recorded Debt, Calls over various periods, Documents, Version, API Status, Logs).
Icons from Material Icons are used alongside each metric, providing a visual cue that complements the textual information.
Interactivity & Feedback:
Every card features a subtle shadow and 3D-tilt effect upon hover, improving the tactile feel of the dashboard.
A tooltip appears when hovering over a card, offering additional details about each metric (e.g., “Outstanding balance” for Recorded Debt).
Some metrics (like Recorded Debt) are conditionally styled with specific colors (e.g., red for critical values) to attract user attention.
Panel Features Section:
Real-Time Data & Updates:
Asynchronous Fetching:
The dashboard fetches analytics data asynchronously from a backend API endpoint at regular intervals (every 6 seconds) ensuring that the displayed metrics remain up-to-date.
Scheduled Time Updates:
A JavaScript function updates the IST date and time every second, ensuring that users always see the current time without having to refresh the page.
