
Hey Devs & Data Scientists! 👋
I just released a new open-source tool called B-Vista — a full-stack, real-time Exploratory Data Analysis (EDA) interface for pandas.
If you've ever wished pandas.DataFrame had a modern, interactive UI like Excel or Observable notebooks — this is for you.
🎯 What is B-Vista?
B-Vista connects a Flask + WebSocket backend to a React frontend and lets you:
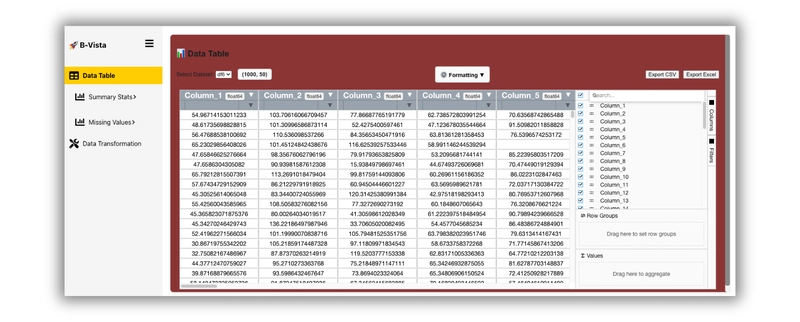
- View your DataFrame in an interactive grid
- Perform inline cell editing — updates sync live via WebSocket
- Detect missing values, outliers, and correlations visually
- Impute, transform, clean your data with no code
- Load live datasets from COVID-19, stock markets, and more
🔥 Features
✅ Descriptive statistics, distributions & outliers
✅ Correlation matrix explorer (Pearson, MI, robust, etc.)
✅ Missing data: heatmaps, dendrograms, MCAR/MAR inference
✅ Smart data cleaning — impute, drop, cast, transform
✅ Live-editable grid UI with fast filtering & grouping
✅ Built-in datasets + plug-and-play API connectors
✅ Built for notebooks and browser sessions
🚀 Quick Demo
import bvista
import pandas as pd

df = pd.read_csv("your_data.csv")
bvista.show(df)
No config needed. It launches a local server and opens your data in a browser or notebook iframe.
📦 Installation
pip install bvistaor with Docker:
docker pull baciak/bvista:latest🔗 Links
- GitHub: github.com/Baci-Ak/b-vista
- PyPI: pypi.org/project/bvista
- Docker: hub.docker.com/r/baciak/bvista
- Hacker News: Discussion thread
🙏 Feedback Welcome!
This is still v1.1.1 — I’d love your thoughts, feedback, bug reports, or PRs 🙌
Labelled good-first-issue for folks who want to contribute.
Also open to ideas for datasets, integrations, or UI tools!
Thanks for reading, and happy exploring!
— Baci