INTRODUCTION
METRICS is a lightweight, user-friendly, CLI-based system monitoring tool designed to provide clear and accessible insights into system performance.
My inspiration for this project came from when I was using WSL to work with my Ubuntu Distro. In such a system it is really hard to monitor the system when there are no GUI or better, lightweight application is provided.
It comes with a choice to either use traditional monitoring commands as mentioned before such as htop or top, but they don’t provide much clear info, or we can use high-fi tools such as Node Exporter, Grafana or Prometheus, which again requires some prior learning of how to use it and also gets somewhere complex to use.
Hence, I wanted to make something that can provide a better understanding of the System’s metrics for day-to-day life. It promotes to not to use any fancy tools which can actually be much overwhelming for a normal user and may also come with steep learning curve.
For simple system such as using a WSL, or a small server setup in Linux, it is more beneficial to make small and lightweight applications to monitor the system.
Key Highlights:
Lightweight & Minimal Setup: No complex configurations or dependencies.
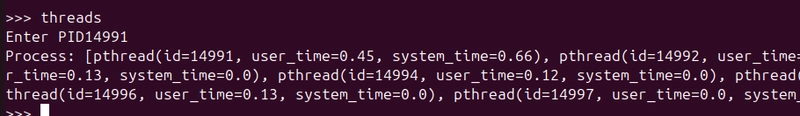
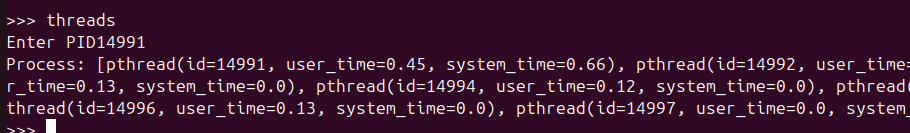
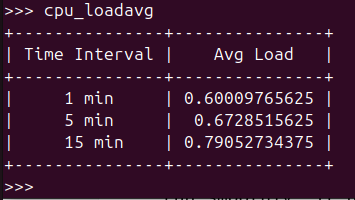
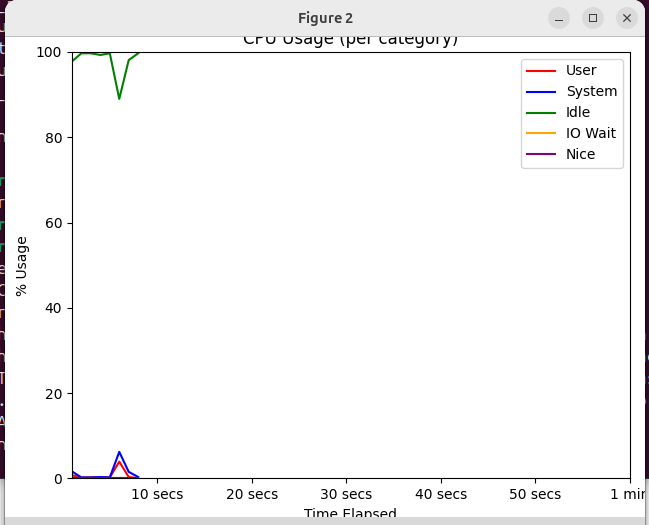
Clear Visualizations: Offers resource insights through tables, concise text output, and simple CLI-based graphs.
Beginner-Friendly: Intuitive to use without sacrificing functionality.
Whether you're managing a small server or working within WSL, METRICS is your go-to tool for efficient, maintainable system monitoring—without the bloat.
How to run it?
To get METRICS in your system, you need to follow the given steps:
- For ease of use, create a directory:
mkdir METRICS
cd METRICS
Then type:
git clone https://github.com/vak-rashu/METRICS.gitAfter doing the git clone, follow the given steps:
cd METRICS
cd packages
source packages.sh
This will activate the virtual environment and will install the necessary pip requirements.
- Now go to the parent directory by typing
cd ..and run the following commands:
source metrics_cli.shNow your METRICS CLI will start working and you can start tracking your system resources. 🌟
Important Note:
- Make sure you have python3 downloaded, if not download it from here:
sudo apt update
sudo apt install python3- Make sure you have required setup downloaded for the graphs to run smoothly, if not run the following command:
sudo apt-get install tcl-dev tk-dev python3-tkResult Analysis
It would be great to see you all also using METRICS to monitor your system resources.
Do also share your thoughts or reviews about this project. 😄