Daily, it is estimated that the world produces approximately 5 billion gigabytes of data. This data has to be processed using data analytics tools to deduce useful insights. In the age of data science and data analytics, where Python, R, and SQL often steal the spotlight, Microsoft Excel might seem like a relic of the past and an outdated tool. Yet, Excel remains one of the most powerful, versatile, and widely used tools in data analytics. While many seasoned data professionals migrate to more advanced platforms, it's important to acknowledge one undeniable fact: most data analysts began their journey with Excel.
As perceived by many, Microsoft Excel isn't just a spreadsheet software for data entry and record keeping but a full-fledged analytical tool that, when wielded with the right skill, can be very useful to deliver deep insights, automated processes, and creation of interactive dashboards. All without writing a single line of code, just functions and formulas.
The Gateway Tool: Why Excel is the First Step for Many
If you ask any group of data analysts how they started, a majority will say Excel. It is approachable, pre-installed on most Windows based laptops/PC's, and doesn't require technical setup or coding knowledge. Whether it’s a financial report, inventory management, a marketing dashboard, or a patient records analysis in healthcare, Excel often serves as the default environment for data manipulation by most beginners.
Most professionals who develop skills in data analytics/data science likely started in Excel. It is typically the first tool we are exposed to to manage data and develop reporting and insight from the data.
– Don Tomoff, Data Analytics Advisor
What Makes Excel Powerful for Data Analytics?
- Data Exploration and Cleaning Made Easy From simple filters to Power Query, Excel allows analysts to clean and transform data easily. Tasks that would require multiple lines of Python or R can often be completed in minutes with Excel’s Graphical user interface. To clean data in Excel, follow these steps:
- Identify and remove duplicates: Use the Remove Duplicates feature to eliminate duplicate entries.
- Handle missing values: Use the
IFERRORorIFBLANKfunctions to replace missing values with a specific value or a calculated result. - Standardize data formats: Use the Text to Columns feature to convert text to a standard format for dates, numbers, and other data types.
- Remove unnecessary characters: Use the
TRIMandSUBSTITUTEfunctions to remove leading/trailing spaces and unwanted characters. - Validate data: Use formulas and conditional formatting to identify invalid or inconsistent data.
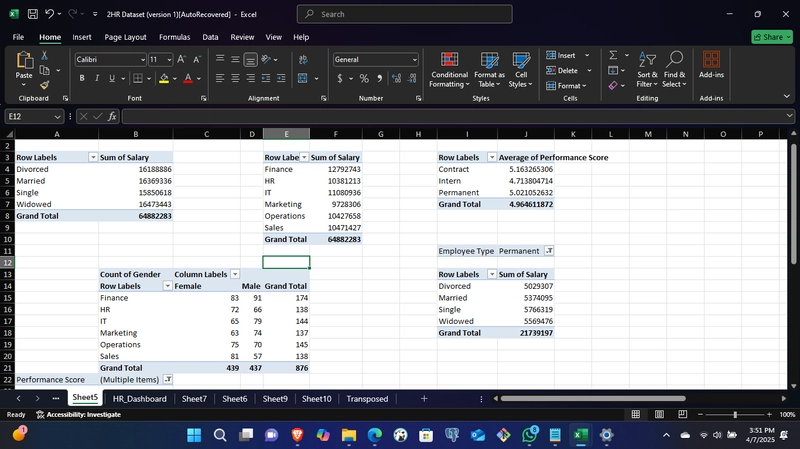
PivotTables: A Non-Technical Data Engine
With just a few clicks, users can summarize thousands of rows of data, calculate aggregates, and uncover trends with no programming knowledge required. Below is a sample of pivot tables from an HR dataset.

Formula and function Ecosystem
Excel’s function library rivals many scripting languages. Conditional logic (IF, IFS, AND, OR), lookups (VLOOKUP, HLOOKUP, INDEX + MATCH), and new dynamic array functions (FILTER, UNIQUE) make data wrangling both powerful and readable.Power Pivot and DAX
For users working with multiple tables or large datasets, Power Pivot and DAX (Data Analysis Expressions) enable relational modeling and advanced calculations — similar to what you’d find in SQL or Power BI.
5._ Dashboards and Visualization_
Slicers, pivot tables, and pivot charts allow users to create dynamic dashboards. These can be shared directly in Excel files or embedded in reports, making insights easily accessible to stakeholders and also easy to understand.
Excel Meets Artificial Intelligence
As part of AI taking over the world by storm and Microsoft being part of the evolution, Excel is undergoing a major transformation powered by AI, machine learning, and natural language processing.
- Excel Copilot (Microsoft Copilot for Excel) Microsoft Copilot is a game-changer for productivity. It integrates generative AI directly into Excel, enabling users to:
Ask natural language questions like: “What are the top-selling
regions in Q1?”Automatically generate formulas, charts, and summaries based on your
dataset.Translate technical formulas into plain English (and vice versa)
Example Use Case: Instead of writing=IF(AND(A2>12, A2<=19),, you can simply type:
"Teenager", "")
“Label all patients aged between 13 and 19 as Teenagers.”
Copilot will handle the logic and apply it.
Suggested Patterns & Smart Fill
Excel now intelligently recognizes repetitive patterns and suggests completions (beyond Flash Fill), using machine learning to spot logic across columns.Data Insights with Natural Language Queries
Tools like Analyze Data in Excel empower you to understand your data through natural language queries that allow you to ask questions about your data without having to write complicated formulas. In addition, Analyze Data provides high-level visual summaries, trends, and patterns. Excel can summarize your spreadsheet and even generate pivot tables or charts in response to plain language prompts. This makes exploratory data analysis more accessible to non-technical users.
4._ Deep Integration with Power BI and Power Platform_
Excel can now serve as a front-end interface to Power BI datasets and Power Apps. You can pull live data, manipulate it with Excel’s familiar tools, and sync changes back to a shared workspace — bridging self-service analytics and enterprise BI.
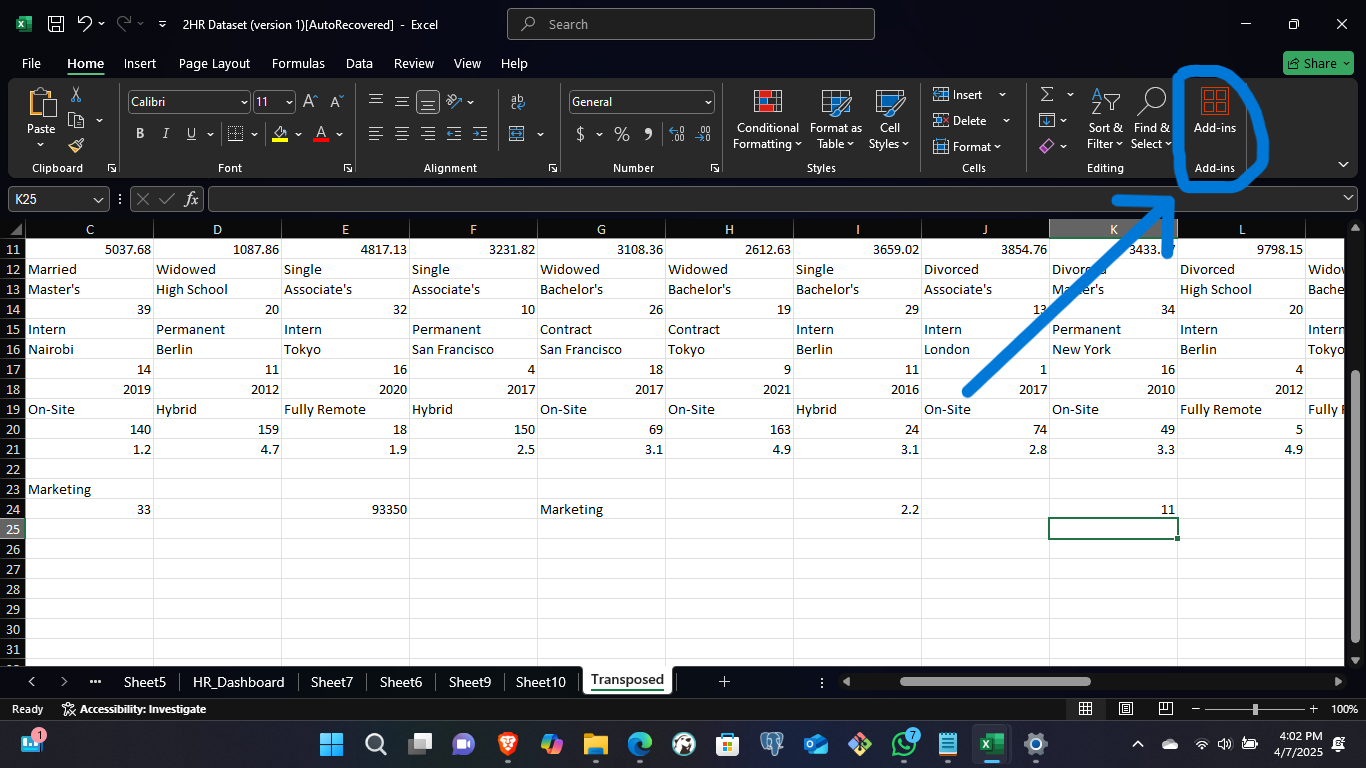
5._ Introduction of Add-Ins/Extensions_
Excel add-ins are like extra tools that help automate tasks, analyze data better, and even connect to other apps or databases. They’re great for saving time, especially with repetitive work or complex analysis that regular formulas can’t handle easily. Plus, they make Excel more user-friendly with custom buttons and features you can reuse across different files or share with your team.
Real-World Relevance
From hospital administrators tracking diagnoses to small businesses analyzing monthly sales, Excel continues to empower decision-makers in diverse fields. For many professionals, especially in resource-constrained environments, Excel is not just the easiest tool, it’s the only one.
The Limitations of Excel
Despite its power, Excel has real limitations:
_ Scalability_
Excel begins to struggle with performance when handling very large datasets (>1 million rows) or when complex formulas/functions are overused.
Version Compatibility
Some AI features (like Copilot or dynamic arrays) require the latest version of Microsoft 365 — not available to all users.
Risk of Human Error
Without strict data governance, Excel sheets can become error-prone, difficult to audit, and risky for enterprise-critical tasks.
Limited Reproducibility
Analytical workflows in Excel are harder to version control and automate compared to scripting languages.
Tips for Maximizing Excel's Analytical Capabilities
- Use Named Ranges and Tables for dynamic referencing
- Learn Power Query for repeatable data transformation
- Explore Power Pivot + DAX to handle large and relational datasets
- Take advantage of Analyze Data and Copilot if available, but be aware that AI is sometimes error-prone.
- Use INDEX + MATCH instead of VLOOKUP and HLOOKUP for performance and flexibility since VLOOKUP and HLOOKUP search values vertically and horizontally, respectively.
When to Supplement Excel with Other Tools
Excel is great for prototyping, EDA (exploratory data analysis), and reporting. But for production analytics pipelines or real-time dashboards, pair it with:
- SQL for scalable querying and joins
- Python/R for advanced statistical modeling and automations
- Power BI/Tableau for interactive visualizations
Conclusion: Excel Isn’t Going Anywhere, It’s Evolving
Microsoft Excel has stood the test of time by constantly adapting to the needs of its users. With the integration of AI-powered tools like Copilot, Excel is no longer just a spreadsheet, it’s a smart analytics assistant.
Whether you’re a beginner working on your first dataset or an advanced user building dynamic dashboards, Excel deserves its place in the data analytics toolbox. It's fast, powerful, and deeply embedded in business workflows. And now, with the rise of AI, it’s smarter than ever.