This is a Plain English Papers summary of a research paper called MLLMs Uncover Hidden Visual Trends in Millions of Images. If you like these kinds of analysis, you should join AImodels.fyi or follow us on Twitter.
Discovering Visual Trends at Scale
Analyzing massive image collections to find meaningful patterns has always been a challenge for computer vision. A new approach leverages Multimodal Large Language Models (MLLMs) to discover visual trends across millions of images without requiring labeled training data or predetermined categories.
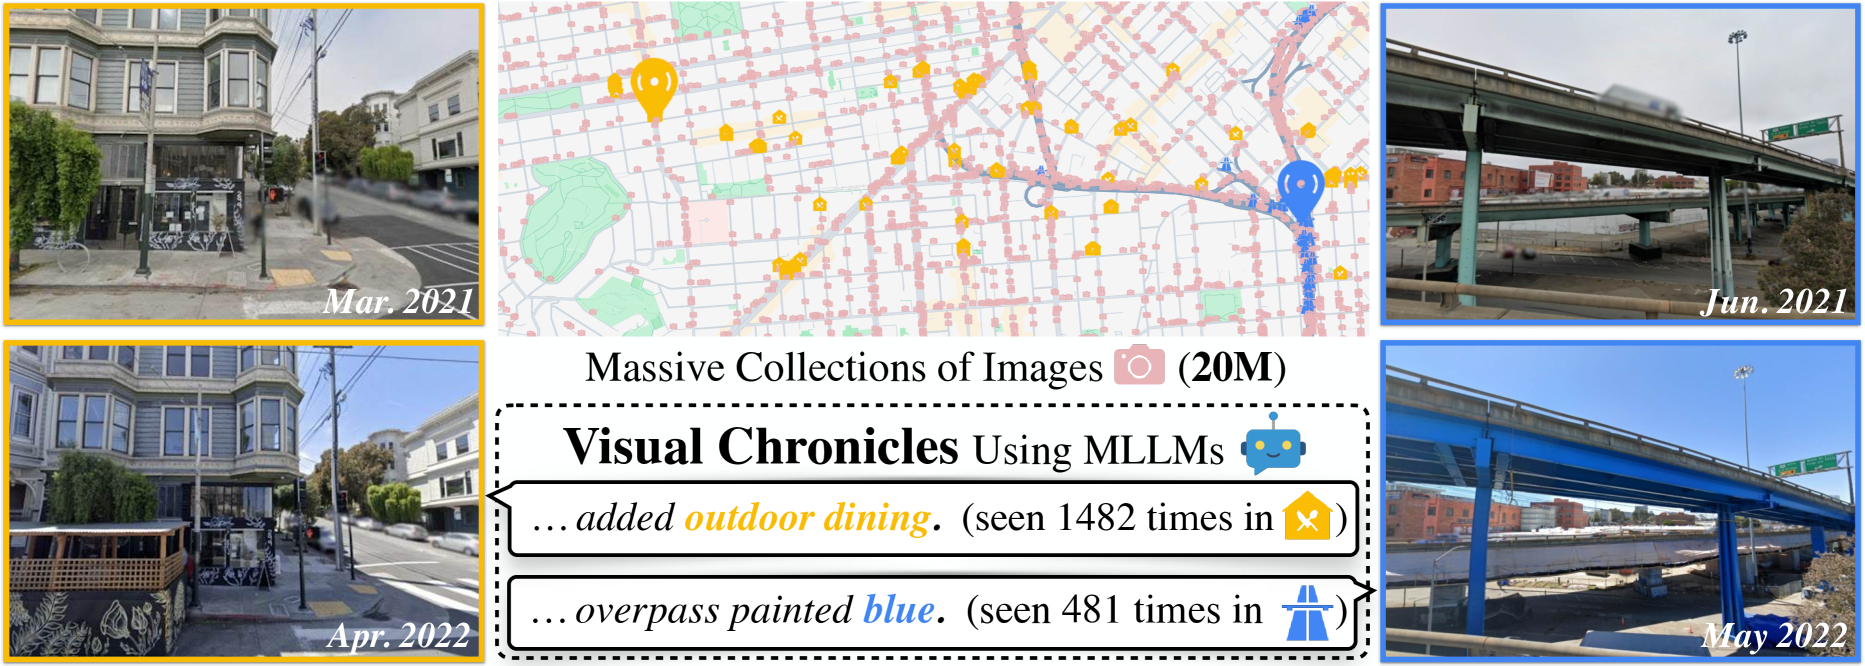
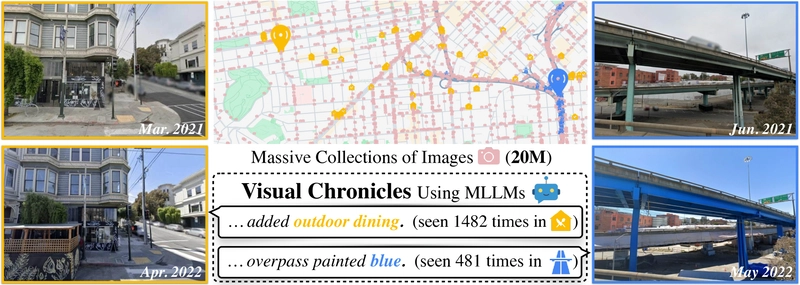
Visual Trend Discovery from Massive-Scale Collections of Images. The system discovers both expected and surprising visual trends in San Francisco—e.g. outdoor dining areas were added to many storefronts, and miles of overpass was painted blue, both with visual evidence.
Traditional methods for analyzing large image collections typically require specific target categories (like faces or cars) or labeled training data. The new approach differs by answering open-ended questions about visual changes in cities over time, enabling discoveries that would otherwise be impossible to find efficiently.
Multimodal large language models for bioimage analysis have shown promise in specialized domains, but this research expands their application to urban-scale visual analysis, creating a powerful new tool for understanding how our environments change over time.
The Challenge of Large-Scale Image Analysis
Previous approaches to analyzing large visual datasets typically focus on specific elements like visual styles, demographic information, or urban perceptions. These methods often rely on image-driven techniques such as clustering visual elements, interconnecting images through shared structure, or using recognition models trained on specific categories.
For temporal analysis, earlier methods either required predetermined target categories or labeled training data. For example, some studies tracked the evolution of facial expressions in yearbook photos over a century, while others predicted urban change by analyzing street view imagery with trained models.
Vision-Language Models have evolved significantly, from simple image captioning systems to powerful MLLMs like Gemini and ChatGPT. While these models integrate extensive understanding with visual inputs, enabling sophisticated visual reasoning, their application to large-scale visual analysis has been limited by context window constraints.
Recent work like explaining multi-modal large language models has focused more on understanding how these models work rather than applying them to analyze massive image collections.
A Two-Step Solution for Massive-Scale Analysis
The research addresses a specific task: identifying and describing trends of visual changes over time in image collections, with interpretable text descriptions accompanied by visual evidence. Each collection contains approximately 20 million posed and timestamped street-level images from 2011 to 2023.
The primary challenge is that MLLMs cannot directly process millions of images due to context limitations. Instead, the researchers developed a bottom-up approach that decomposes the problem into smaller, tractable sub-problems.
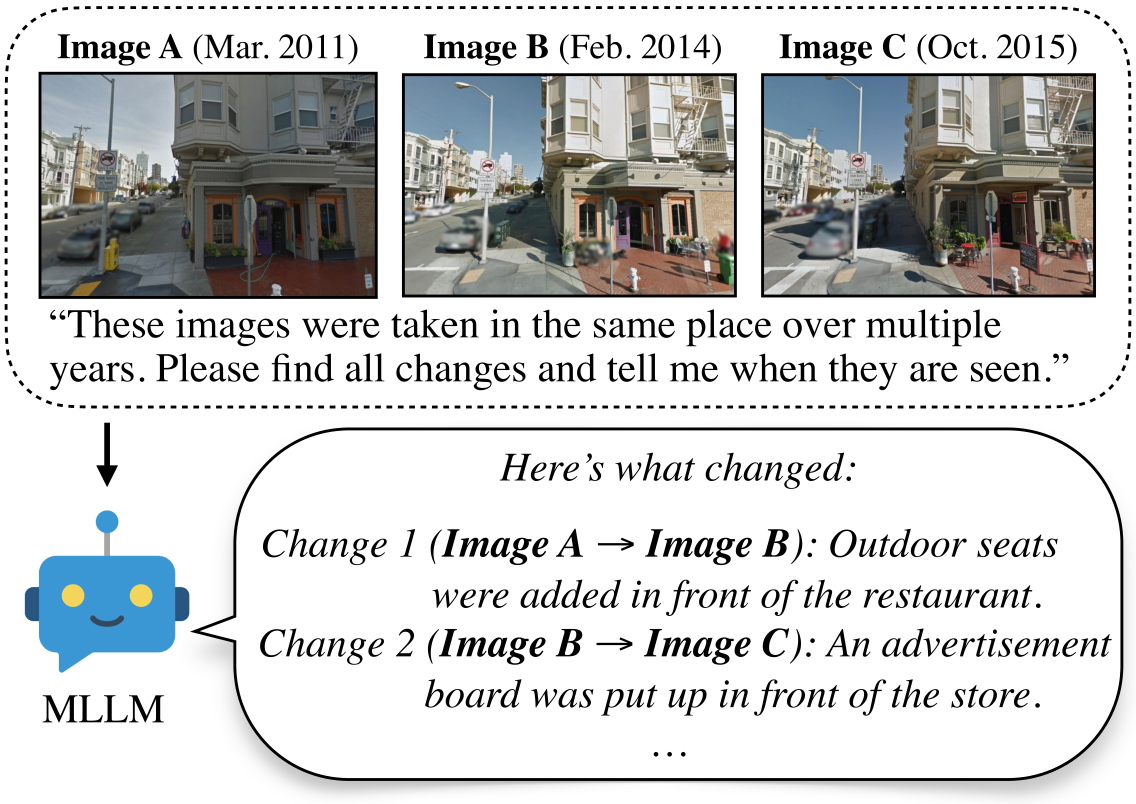
Using MLLMs for Visual Change Detection. Given a set of images captured from nearby views at different timestamps (top row), the system uses an MLLM as a visual analyst to detect changes.
During early experiments, the researchers discovered MLLMs excel at describing subtle changes within temporal image sequences from the same perspective. MLLMs can detect meaningful changes while ignoring trivial variations like time of day or season, and they identify exactly where changes occur in a sequence.
This led to a two-step system:
- Local change detection: MLLMs analyze small sets of images from approximately the same viewpoint at different times.
- Trend discovery: The system finds patterns among the detected local changes.
For trend discovery, the researchers developed a hybrid algorithm that combines text embeddings with MLLM verification:
Algorithm 1: Using MLLMs for Trend Discovery
1: Trend T, set of changes C, parameters k, N
2: Is T a real trend or not?
3: Encode T and each ci∈C using TextEmb
4: Compute distances di between T and each ci
5: Select k nearest ci based on di as set Ck
6: Use MLLM to determine if each cj∈Ck belongs to T
7: Let Npos be the number of positive responses
8: if Npos≥N then
9:     return Trend T is positive
10: else
11:     return Trend T is negative
This approach significantly reduces computational costs while maintaining high accuracy. For example, with N=500 (the minimum frequency for a trend) and k=1500 (the number of nearest neighbors to verify), the computational cost is reduced by 2000× compared to exhaustive verification.
Explainable search and discovery for visual cultural heritage collections shares similar goals of extracting insights from large visual collections, but this approach scales to millions of images and focuses specifically on detecting temporal changes.
Performance Evaluation
The researchers evaluated their system against several alternatives and baseline approaches.
First, they compared against naive MLLM solutions:
- MLLMs predicting trends without seeing any images: These produced abstract, general answers lacking specific details.
- MLLMs processing random subsets of 8K images: Due to severe undersampling, only extremely frequent trends were found.
For local change detection, the system was compared against various unsupervised methods using a dataset of 200 locations with 3,036 images:
| HoG [11] | C-Hist [51] | R-Sensing [40] | CLIP [44] | NV-Emb [29] | Gemini [45] | |
|---|---|---|---|---|---|---|
| AP | 16.44% | 16.76% | 18.51% | 26.52% | 23.75% | 76.56% |
Table 1: Evaluating Visual Change Detection. Gemini detects visual changes with significantly higher average precision (AP) than baselines based on image features (HoG, C-Hist), remote sensing (R-Sensing), and semantic embeddings (CLIP, NV-Emb).
For trend discovery, they compared different representation types:
| Representation | Type | Scalable | Average Precision |
|---|---|---|---|
| Random | - | - | 47.70% |
| CLIP | ImgEmb | ✓ | 54.78% |
| NV-Emb | TxtEmb | ✓ | 73.13% |
| Gemini | MLLM | ✗ | 86.63% |
Table 2: Evaluating Trend Discovery. The MLLM discovers trends with significantly higher average precision (AP) than baselines based on embedding distances, but is not scalable due to expensive inference.
The hybrid verification method combining embedding-based retrieval with MLLM verification showed superior performance:
| Method | AllTrue | NV-Emb | RandMLLM | Hybrid (Ours) |
|---|---|---|---|---|
| Acc.@50 | 72.7% | 77.9% | 31.8% | 93.9% |
| Acc.@100 | 54.1% | 69.6% | 49.9% | 94.6% |
| Acc.@200 | 28.9% | 81.8% | 74.9% | 98.3% |
Table 3: Evaluating Change-Trend Classifiers. AllTrue is predicting positive for all. The hybrid algorithm is significantly more accurate at verifying change-trend pairs than scalable alternatives.
Additional ablations showed that using a self-critic strategy in local change detection significantly improved precision (from 57.83% to 81.74%) with minimal impact on recall. The researchers also tested different MLLMs, finding that smaller models like LLAVA still perform decently while being slightly less accurate than Gemini.
Visualization literacy with multimodal LLMs similarly leverages the visual interpretation capabilities of MLLMs, though for analyzing visualizations rather than detecting changes in urban environments.
Discovering Urban Visual Trends
When applied to 20 million images each from New York City and San Francisco, the system discovered numerous interesting visual trends.
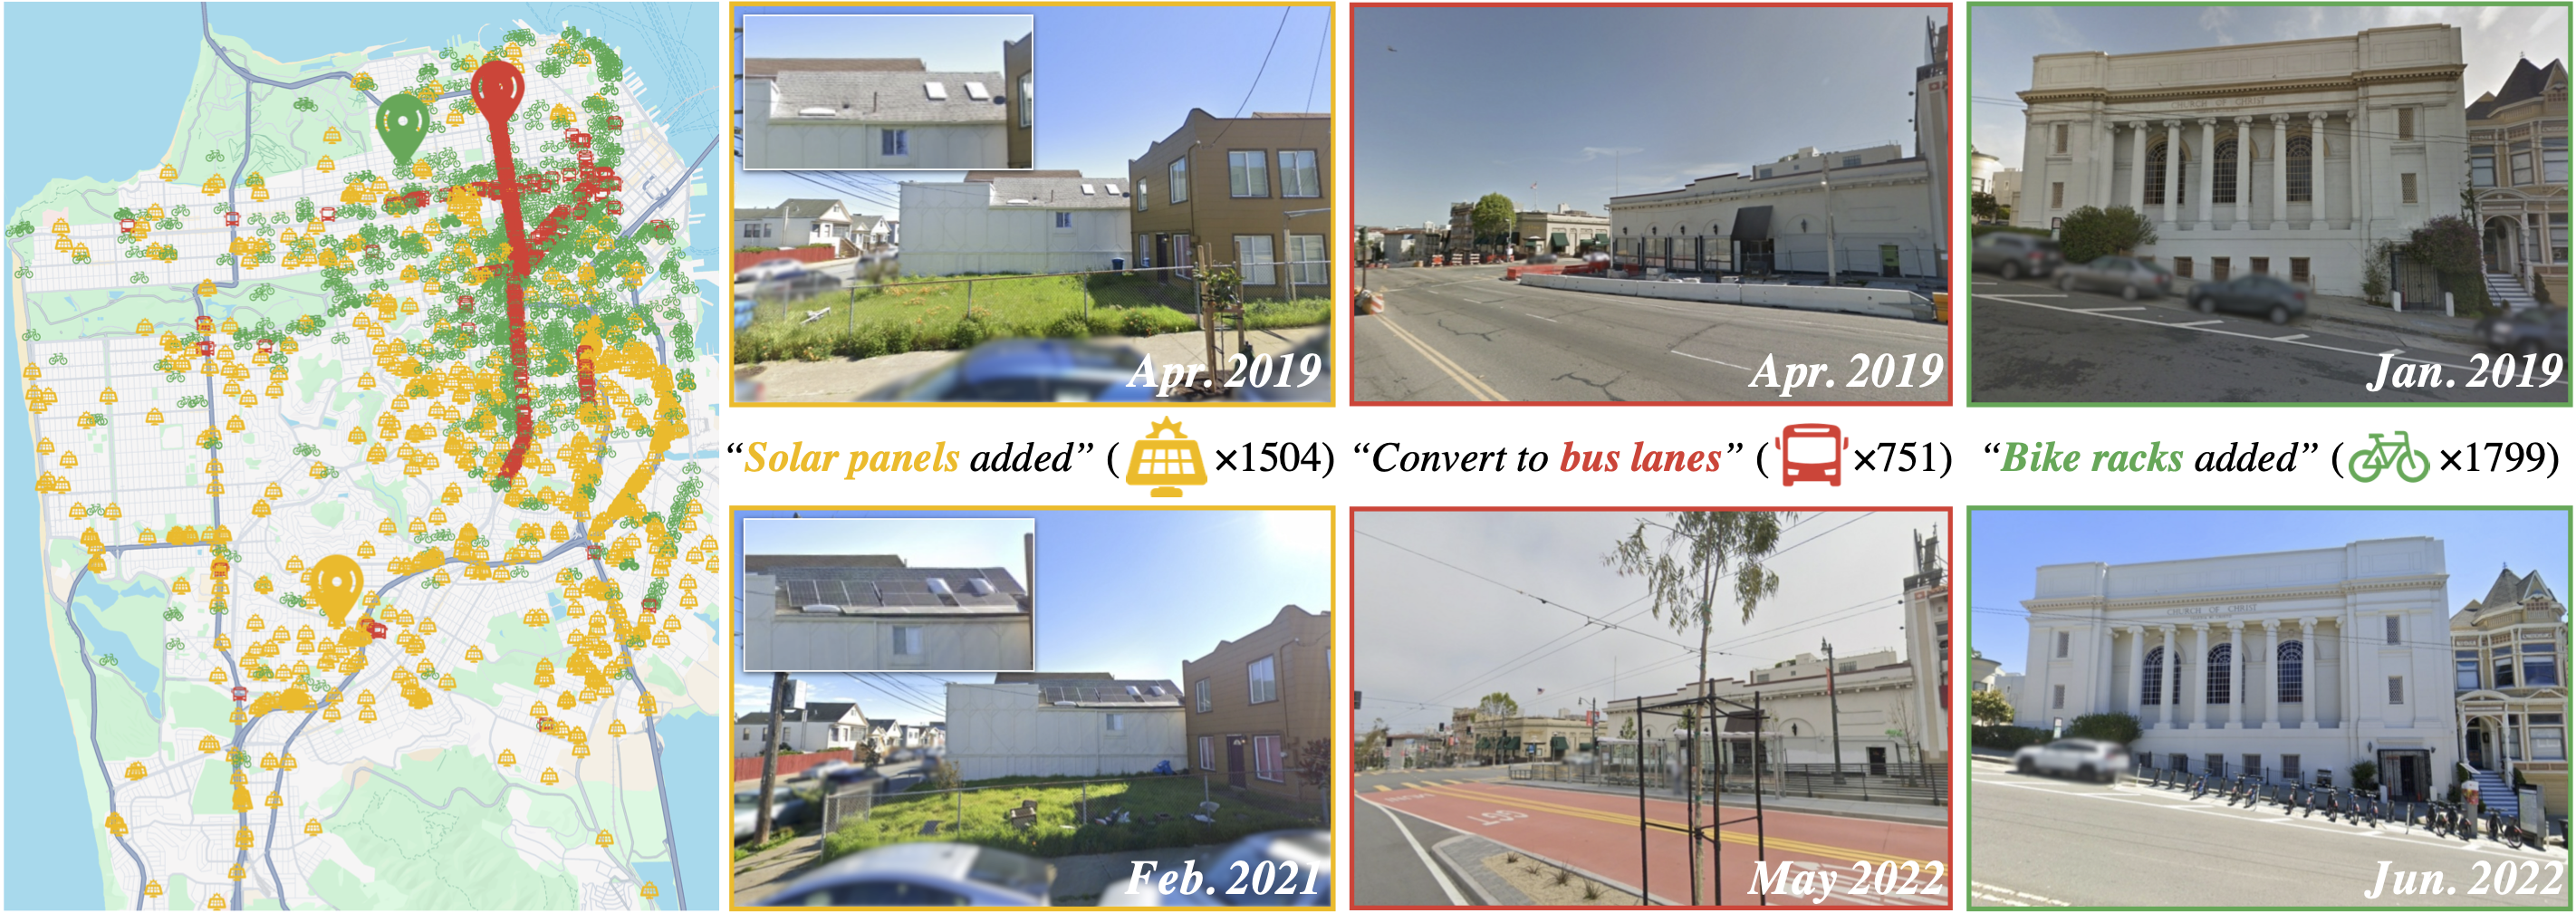
Trends of the Decade in San Francisco. In San Francisco, the system discovered 1504 new solar panels (mostly in residential areas), 751 bus lanes conversions (mostly along a few major roads), and 1799 new bike racks (mostly near downtown).
Post-2020 Changes in San Francisco
The system can also analyze specific time periods. For San Francisco from 2020-2022, it discovered a significant increase in outdoor dining:
"The storefront added tables and chairs outside" - 1,482 occurrences in 2020-2022 compared to 668 in 2017-2019.
An unexpected finding was: "The support of the overpass was painted blue" - observed 481 times since 2020 (versus only 5 times before 2020). Internet searches revealed this was part of a $31 million paint job of the Central Freeway.
Retail Trends in New York City
The system supports subject-specific searches, such as trends related to retail stores:

NYC Retail Visual Trends. By conditioning on "a retail store has changed," the system discovered visual trends related to the opening and closing of types of retail stores in New York.
These included both openings (bakeries, juice shops) and closings (bank branches, grocery stores).
Non-Temporal Queries and Spatial Insights
Beyond temporal changes, the system can analyze individual images for unusual features:
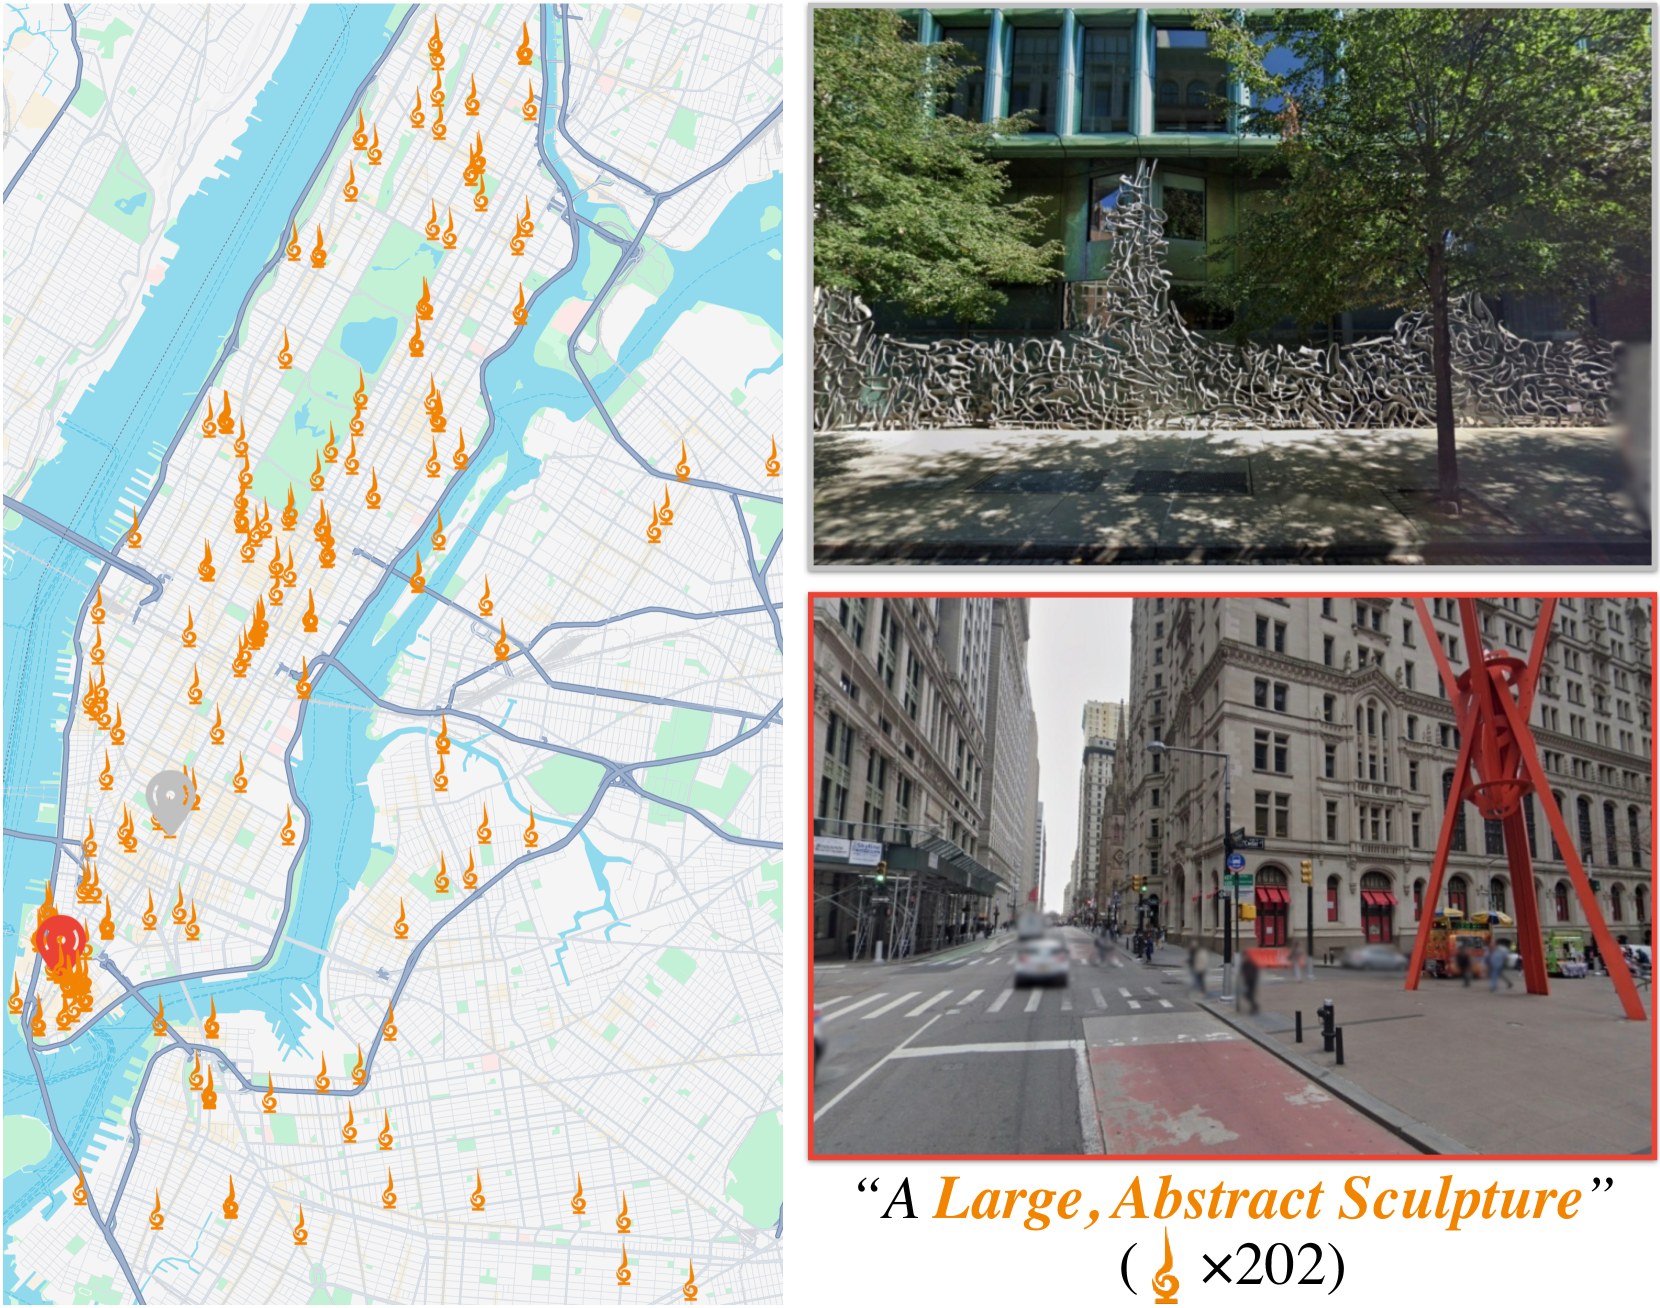
Unusual Things on the Streets of NYC. Beyond temporal queries, the system can also analyze individual images for non-temporal open-ended queries. Findings included many unusual "large, abstract" sculptures in NYC.
The system can also map the spatial distribution of trends:

Where are new buildings in NYC? Plotting all locations where "A lot now has a multi-story building constructed on it" reveals notable clustering in Brooklyn, Long Island City, and Hudson Yards.
Other interesting findings included a significant increase in graffiti in San Francisco after 2020:
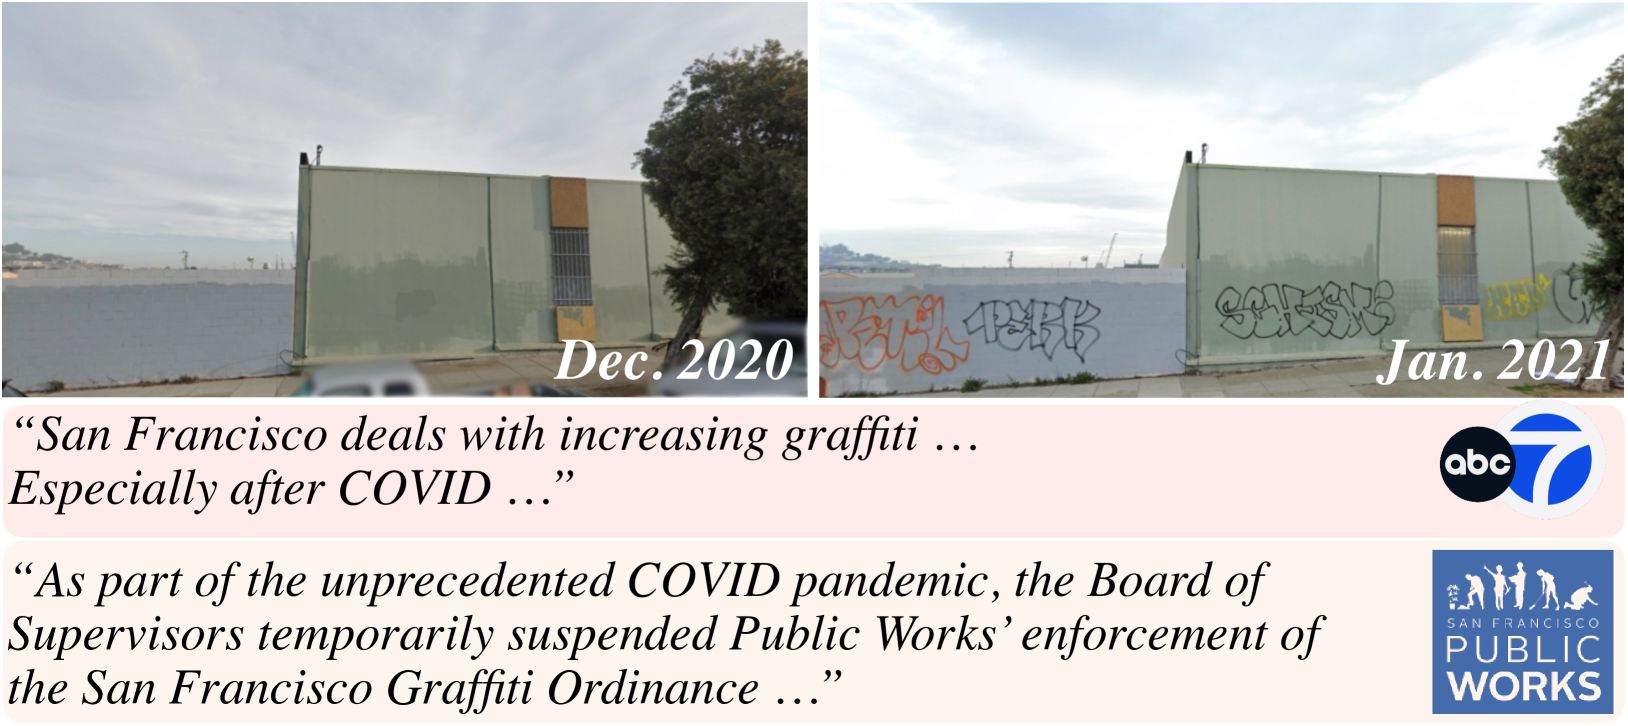
Many Graffiti Observed, 2020–2022. In SF since 2020, many new graffiti appeared. Local news and policy changes help explain this trend - during COVID, San Francisco paused enforcement of regulations requiring building owners to remove graffiti promptly.
The system found many additional trends, with sample results shown in the paper:
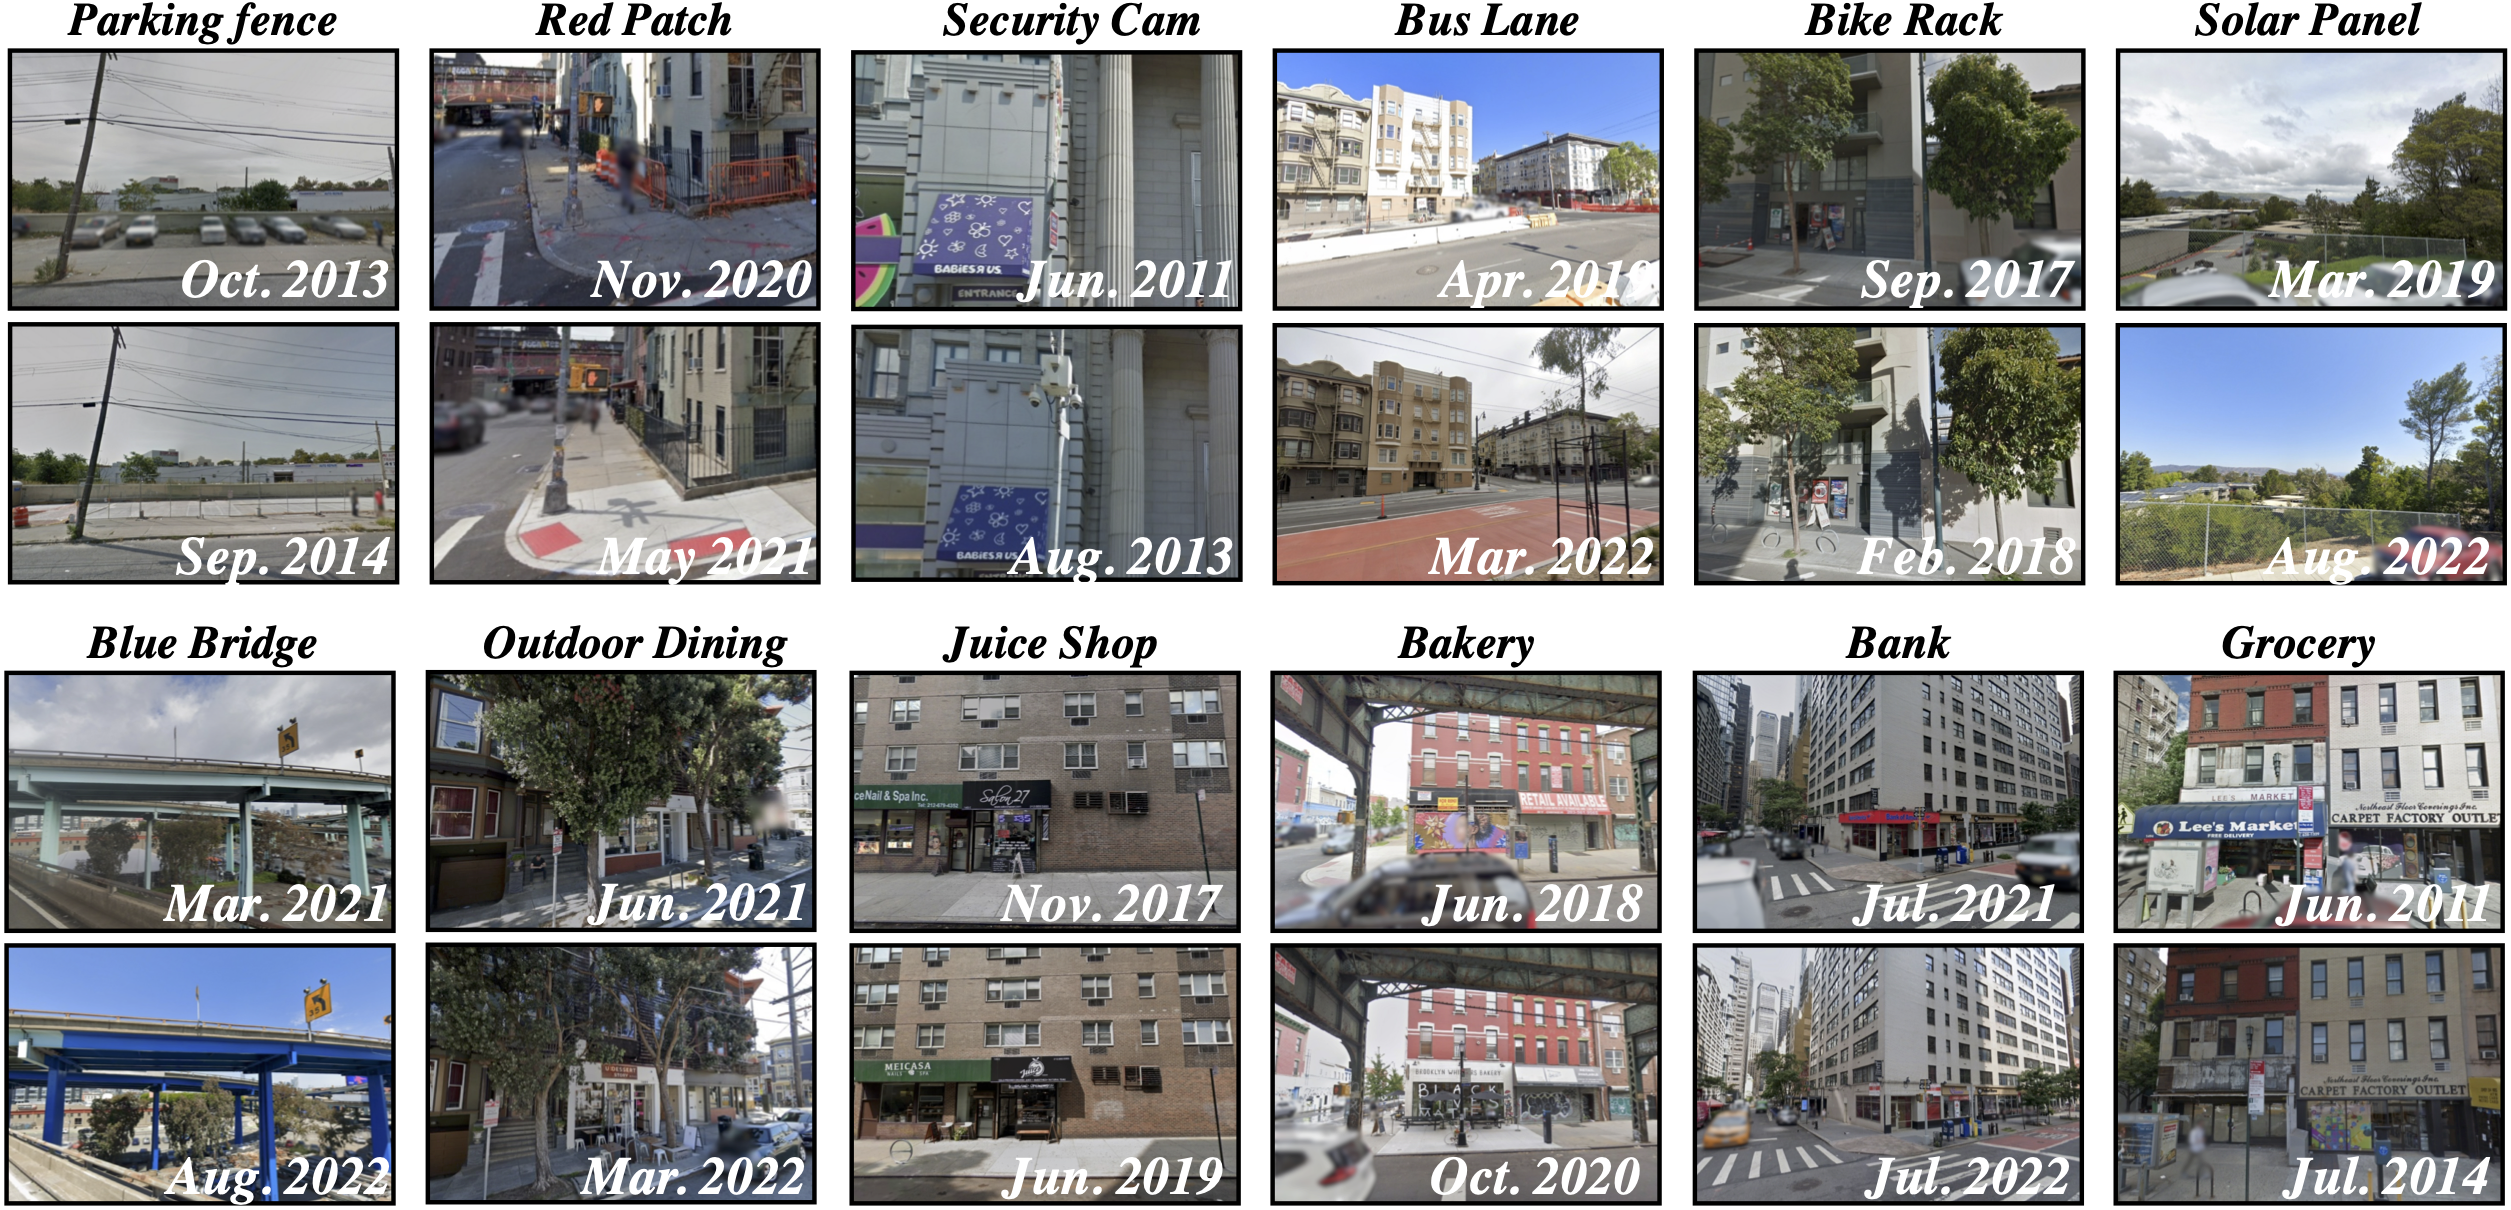
More Images of Shown Trends. Additional visual evidence for previously shown trends demonstrates the variation in the visual data.
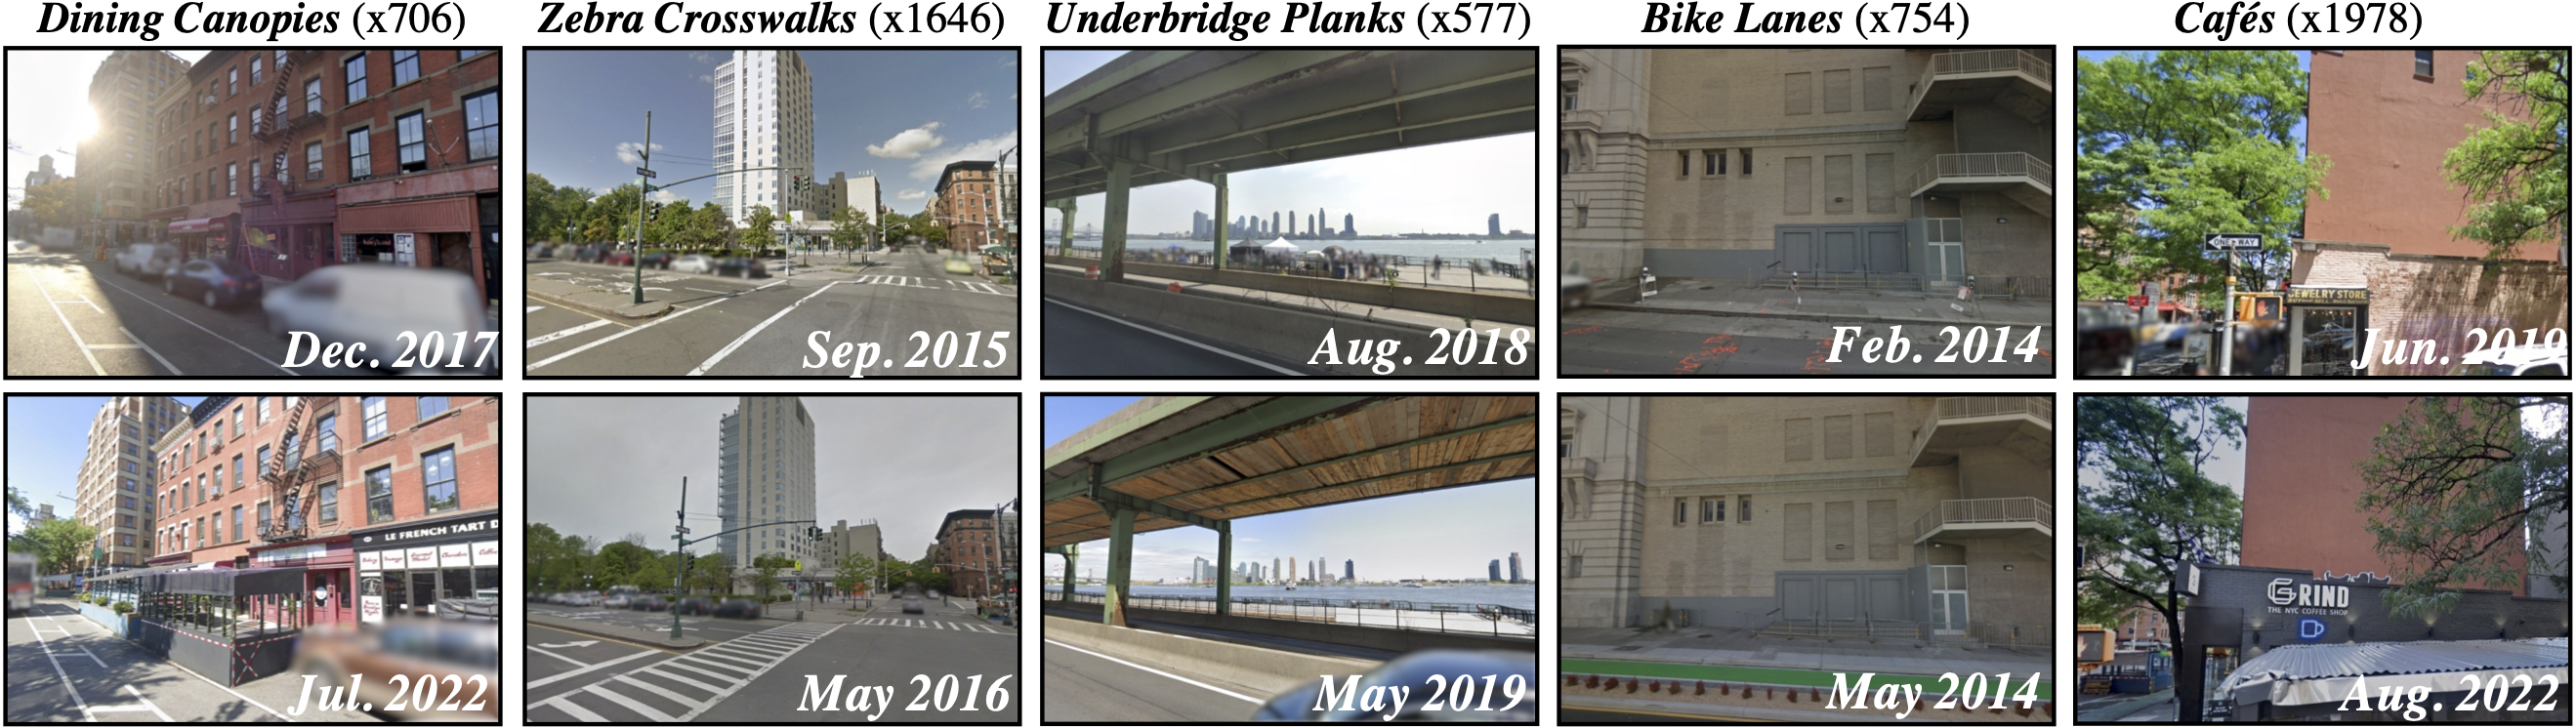
More Trends in Images. Additional trends found include canopied outdoor dining in NYC, new zebra crosswalks, under-bridge wooden planks, green bike lanes, and new cafés.
The complete list of trends with their frequencies illustrates the range of changes detected:
| Trend Description | |
|---|---|
| Fig. 1 | (×1483) The storefront added tables and chairs outside. (×481) The support of the overpass was painted blue. |
| Fig. 3 | (×745) Security cameras became visible on the light poles. (×509) The parking lot in front of the building now has a fence enclosing it. (×519) The crosswalk had its marking changed from white to red. |
| Fig. 4 | (×1504) Solar panels were added to the roof of one of the buildings in the background. (×751) The street has been reconfigured from a standard two-way configuration to a configuration with a dedicated bus lane. (×1799) Bike racks were added in front of a building. |
| Fig. 5 | (×318) A juice shop opened at the storefront. (×512) There is a bakery newly opened at the storefront. (×1614) The bank branch at the storefront closed. (×741) The grocery store on the street closed. |
| Fig. 7 | (×1693) A lot now has a multi-story building constructed on it. |
| Fig. 8 | (×3152) New graffiti were added to the wall. |
| Fig. 10 | (×706) An outdoor seating area with a canopy was added in front of the buildings. (×1646) The crosswalk changed from having solid white painted lines to zebra-striped painted lines. (×577) Portions of the underside of the overpass structure are covered with wooden planks, where it was primarily metal beams and supports before. (×754) A green bike lane was added to the street in front of a building. (×1978) The storefront changed into a cafe. |
Full Texts for Trends in Various Figures, showing the complete descriptions and frequencies of discovered trends.
Visual Chronicles using multimodal LLMs represents a breakthrough in using MLLMs to analyze visual data at unprecedented scale, opening new possibilities for understanding how our environments change over time.
Limitations and Future Directions
This research should be considered an initial proof-of-concept for applying MLLMs to massive image collections. Several limitations provide avenues for future work:
- The current approach works best when the input collection can be decomposed into sets of images from nearby viewpoints, but may not be suitable for detecting global changes.
- Care must be taken when interpreting results, as sampling biases in the data collection can affect conclusions. For example, solar panels might appear more frequently in images taken from elevated freeways.
- The system doesn't account for reverse changes or the fraction of times a change happens for a particular starting state, potentially leading to the detection of transient activities rather than true trends.
- The current implementation relies on simple prompts to guide MLLMs, which may need refinement for different applications.
Future research could integrate MLLM analysis into more robust statistical frameworks that account for biases and sampling irregularities. The methods could also be applied to other kinds of visual datasets, including video footage, and to different types of queries beyond temporal changes.
With a computation cost under $10K for analyzing 20 million images from a city, this approach is already economically viable for city-scale analysis projects. As MLLM capabilities continue to evolve, this research represents just the beginning of what's possible for massive-scale visual analysis using these powerful models.