Hi builders.
Been a while i posted an article here. I've been so consumed with an internship program (HNG tech), where we're actually building a real-world product. Sneak peak: it's an AI grading system that schools and educational organisations can use. When it's out, i'll tell y'all about it :)
But today, i'll be talking about monitoring your web applications, which will save you time and money (application downtime will make you lose money).
This guide will walk you through building a powerful monitoring ecosystem that not only alerts you when things break but helps you understand why they break and how to improve your development practices.
🔍 Introduction: Why Monitoring Matters
A robust monitoring system is very important as it aids in:
Providing real-time visibility into system health
Alerting teams before small issues become major outages
Offering actionable insights for continuous improvement
Enabling data-driven decisions about infrastructure and development practices
By the end of this guide, you'll have implemented a comprehensive monitoring solution leveraging industry-standard tools like Prometheus, Grafana, and cutting-edge DORA metrics to transform how you understand and improve your applications.
📋 Prerequisites
Before diving in, ensure you have:
A Linux-based cloud server (I used Ubuntu 20.04, but any other linux distro works too)
Root or sudo access
Basic command line knowledge
GitHub Actions configured for your repositories
Firewall configured to allow necessary ports (22, 3000, 9090, etc.)
A Slack workspace
🏗️ The Architecture: Understanding Our Monitoring Stack
Our monitoring system consists of these tools:
Prometheus: To collect and store all our metrics
Grafana: Makes pretty, customizable dashboards that'll help you visualize your metrics
Node Exporter: Collects hardware server metriks (like CPU, memory, disk)
Blackbox Exporter: Checks if endpoints are actually responding. Will also check for SSL validity
DORA Metrics Exporter: Tracks development performance on our github repos using industry-standard metrics
AlertManager: Manages alert routing and delivery to Slack
┌───────────────────────────────────────────────────────────────┐
│                    Monitored Infrastructure                   │
│                                                               │
│  ┌────────────────┐    ┌────────────────┐   ┌──────────────┐  │
│  │ Node Exporter  │    │ Blackbox Probe │   │    GitHub    │  │
│  │(Server Metrics)│    │ (Website Tests)│   │(DORA Metrics)│  │
│  └───────┬────────┘    └───────┬────────┘   └───────┬──────┘  │
└──────────┼─────────────────────┼────────────────────┼─────────┘
           │                     │                    │
           └─────────┬───────────┴────────────────────┘
                     │
                     ▼
            ┌─────────────────┐
            │    Exporters    │
            │(Data Collectors)│
            └────────┬────────┘
                     │
                     ▼
           ┌───────────────────┐
           │    Prometheus     │
           │(Metrics Database) │────────────────┐
           └─────┬─────────────┘                │
                 │                              │
        ┌────────▼─────┐                        │
        │ AlertManager │                        │
        │  (Alerts)    │                        │
        └────────┬─────┘                        │
                 │                              │
                 │                              │
        ┌────────▼──────┐                       │
        │   Slack       │                       │
        │(Notifications)│                       │
        └───────────────┘                       │
                                                │
                                                ▼
            ┌────────────────────────────────────────────────────┐
            │                 Grafana Dashboards                 │
            │  ┌───────────┐  ┌───────────┐  ┌───────────────┐   │
            │  │  System   │  │  Website  │  │ DORA Metrics  │   │
            │  │ Dashboard │  │ Dashboard │  │   Dashboard   │   │
            │  └───────────┘  └───────────┘  └───────────────┘   │
            └────────────────────────┬───────────────────────────┘
                                     │
                                     ▼
                            ┌─────────────────┐
                            │   Developers    │
                            │  & Operations   │
                            └─────────────────┘
🧠 Why I Chose These Specific Monitoring Tools
Our monitoring stack wasn't assembled randomly; each component was carefully selected to fulfil specific requirements in a modern infrastructure. Let's talk a bit about each of them.
Prometheus: The Foundation of Our Stack
I chose Prometheus as our core monitoring tool for several practical reasons:
Pull-based approach: Prometheus collects metrics by reaching out to our systems, which simplifies setup and improves reliability.
Simple yet powerful queries: PromQL lets us create meaningful alerts and visualizations without complex coding.
Built-in alerting: Prometheus detects issues based on our defined thresholds, sending these to AlertManager for notification.
Easy metric filtering: I can quickly analyze metrics by server, application, or any other label we've defined.
Perfect fit for our infrastructure: Works seamlessly with both our servers and web applications.
Grafana: Visualization That Drives Insights
I chose Grafana for visualization because it excels at:
Multi-source dashboards: Can combine Prometheus data with other sources like logs or traces.
Rich visualization options: From time-series graphs to heatmaps and histograms.
Alerting capabilities: Though I primarily use AlertManager, Grafana's alerting can provide an additional layer.
Annotation support: Allows marking deployments, incidents, and other events directly on dashboards.
User-friendly interface: Makes it accessible for both technical and non-technical stakeholders.
Node Exporter: Server-Level Insights
I implemented Node Exporter to:
Monitor system resources: Track CPU, memory, disk, and network usage on our servers.
Identify bottlenecks: Quickly pinpoint which resources are constraining performance.
Track system health: Get early warnings about server issues before they affect users.
Collect detailed metrics: Access hundreds of system-level data points for thorough analysis.
Blackbox Exporter: External Endpoint Monitoring
Blackbox Exporter was specifically chosen to monitor external endpoints and provides:
Uptime monitoring: Detects when websites and APIs are unavailable
Response time tracking: Measures latency that could affect user experience
SSL certificate validation: Alerts before certificates expire to prevent security warnings
HTTP status verification: Ensures services are returning proper response codes
Basic content validation: Can verify that responses contain expected content
AlertManager: Intelligent Alert Routing
AlertManager wasn't chosen merely for sending notifications, but for its sophisticated handling of alerts:
Grouping and deduplication: Prevents alert storms during major outages.
Silencing and inhibition: Reduces noise by temporarily muting alerts during maintenance or when a higher-priority alert is already firing.
Multiple receivers: Routes different alerts to appropriate teams or channels.
Templating: Creates rich, context-aware notifications that speed up troubleshooting.
DORA Metrics Exporter: Connecting Technical and Business Performance
This custom component bridges the gap between operational metrics and development performance, allowing teams to make data-driven decisions about process improvements.
📊 The Importance of Tracking DORA Metrics
DORA (DevOps Research and Assessment) metrics identifies four key metrics:
- Deployment Frequency (DF): How often code is successfully deployed to production
- Lead Time for Changes (LTC): The time it takes for a commit to reach production
- Mean Time to Restore (MTTR): How quickly service can be restored after an incident
- Change Failure Rate (CFR): The percentage of deployments that cause a failure
Our setup doesn't just passively collect these metrics — it makes them actionable:
Real-time visibility: Dashboards show current performance on all four metrics
Historical trends: Track improvements over time with historical data
Proactive alerts: Get notified when metrics fall outside healthy ranges
Correlation with system metrics: Understand how infrastructure affects delivery performance
For example, if your Change Failure Rate rises above a threshold, you'll be alerted before it becomes a serious problem. Similarly, if Mean Time to Restore grows too long, you can focus efforts on improving incident response.
By integrating DORA metrics into your monitoring system, you create a feedback loop that continuously improves both technical operations and business outcomes.
🚨 How Alerts Transform System Reliability
Now let's talk about alerting.
Alerts are far more than just notifications — they are a critical component of a reliability strategy that shifts teams from reactive to proactive operations. A well-configured alerting system fundamentally changes how teams approach reliability.
Here's what I mean. We'll compare the traditional approach (proactive alerts) and modern approach (with our system)
The Traditional Approach (Without Proactive Alerts)
- System fails completely
- Users report problems
- Engineers scramble to diagnose unfamiliar issues
- Teams work under pressure to restore service
- Business impact accumulates during downtime
The Modern Approach (With Our Alert System)
- System begins showing early warning signs
- Alerts trigger before users are affected
- Engineers investigate with detailed context already provided
- Problems are resolved during their early stages
- Many outages are prevented entirely
The alerts we've configured in this guide do more than just notify—they transform how teams interact with systems:
1. Context-Rich Notifications
Our alerts include:
- Precise timing information
- System relationships
- Impact assessments
- Historical context
- Actionable next steps
This means engineers can begin addressing issues immediately rather than spending critical time gathering basic information.
2. Progressive Severity Levels
By distinguishing between warnings and critical alerts, the system creates a natural progression:
Warnings: Address during normal working hours to prevent future problems
Critical alerts: Require immediate attention to restore service
This tiered approach ensures appropriate response without creating false urgency.
Enough talk. Now let's roll up our sleeves and get these tools live and up and running on our servers (was that just tautology lol)
🔧 Part 1: Building the Foundation
Let's start by creating the directory structure and installing our components.
Directory Setup
sudo mkdir -p /etc/prometheus /etc/prometheus/rules /etc/alertmanager /etc/blackbox_exporter
sudo mkdir -p /var/lib/prometheus /var/lib/grafana /var/lib/alertmanager
sudo mkdir -p /opt/dora-exporter
Component Installation
Prometheus: Your Metrics Database
Install Prometheus (I'm using v2.47.0, but use whatever's current):
wget https://github.com/prometheus/prometheus/releases/download/v2.47.0/prometheus-2.47.0.linux-amd64.tar.gz
tar xvfz prometheus-*.tar.gz
sudo mv prometheus-2.47.0.linux-amd64/prometheus /usr/local/bin/
sudo mv prometheus-2.47.0.linux-amd64/promtool /usr/local/bin/
AlertManager: Your Alert Orchestrator
wget https://github.com/prometheus/alertmanager/releases/download/v0.26.0/alertmanager-0.26.0.linux-amd64.tar.gz
tar xvfz alertmanager-*.tar.gz
sudo mv alertmanager-0.26.0.linux-amd64/alertmanager /usr/local/bin/
Node Exporter: Hardware & OS Metrics
Install Node Exporter for server metrics:
wget https://github.com/prometheus/node_exporter/releases/download/v1.6.1/node_exporter-1.6.1.linux-amd64.tar.gz
tar xvfz node_exporter-*.tar.gz
sudo mv node_exporter-1.6.1.linux-amd64/node_exporter /usr/local/bin/
Blackbox Exporter: External Monitoring
Run these commands:
wget https://github.com/prometheus/blackbox_exporter/releases/download/v0.24.0/blackbox_exporter-0.24.0.linux-amd64.tar.gz
tar xvfz blackbox_exporter-*.tar.gz
sudo mv blackbox_exporter-0.24.0.linux-amd64/blackbox_exporter /usr/local/bin/
DORA Metrics Exporter: Engineering Performance
For the DORA metrics exporter, we'll be using some custom scripts from this repo github.com/NonsoEchendu/dora-metrics (please follow me on github ;) ) that collects key performance metrics from GitHub repositories.
Clone the repo into your server:
git clone https://github.com/NonsoEchendu/dora-metricsCopy all its contents to the /opt/dora-exporter directory I created.
sudo cp dora-metrics/* /opt/dora-exporter
cp .env.example .env
sudo cp .env /etc/default/dora-metrics
Create and edit the .env file:
cp .env.example .env
sudo cp .env /etc/default/dora-metrics
sudo nano /etc/default/dora-metrics
Create and prepare virtual environment where the dora-metrics python script will run:
sudo apt-get update
sudo apt-get install python3-venv
sudo python3 -m venv /opt/dora-exporter/venv
sudo chown -R dora:dora /opt/dora-exporter/venv
sudo -u dora /opt/dora-exporter/venv/bin/pip install -r requirements.txt
Grafana: Your Visualization Platform
Let's install grafana now. Run these commands:
sudo apt-get install -y apt-transport-https software-properties-common wget
wget -q -O - https://packages.grafana.com/gpg.key | sudo apt-key add -
echo "deb https://packages.grafana.com/oss/deb stable main" | sudo tee -a /etc/apt/sources.list.d/grafana.list
sudo apt-get update
sudo apt-get install grafana
User Creation & Permissions
Security best practice: each component runs as its own user with limited permissions.
sudo useradd --no-create-home --shell /bin/false prometheus
sudo useradd --no-create-home --shell /bin/false alertmanager
sudo useradd --no-create-home --shell /bin/false node_exporter
sudo useradd --no-create-home --shell /bin/false blackbox
sudo useradd --no-create-home --shell /bin/false dora
sudo useradd --no-create-home --shell /bin/false grafana

sudo chown -R prometheus:prometheus /etc/prometheus /var/lib/prometheus
sudo chown -R alertmanager:alertmanager /etc/alertmanager /var/lib/alertmanager
sudo chown -R blackbox:blackbox /etc/blackbox_exporter
sudo chown -R grafana:grafana /var/lib/grafana
sudo chown -R dora:dora /opt/dora-exporter
🚀 Part 2: Service Configuration
Now let's configure each service to run automatically at startup.
Prometheus Service
Create (/etc/systemd/system/prometheus.service) and write into it with this:
[Unit]
Description=Prometheus
Wants=network-online.target
After=network-online.target

[Service]
User=prometheus
Group=prometheus
ExecStart=/usr/local/bin/prometheus \
  --config.file=/etc/prometheus/prometheus.yml \
  --storage.tsdb.path=/var/lib/prometheus \
  --web.console.libraries=/usr/share/prometheus/console_libraries \
  --web.console.templates=/usr/share/prometheus/consoles \
  --web.enable-lifecycle

Restart=always

[Install]
WantedBy=multi-user.target
AlertManager Service
Create and write into this /etc/systemd/system/alertmanager.service
[Unit]
Description=Alertmanager
Wants=network-online.target
After=network-online.target

[Service]
User=alertmanager
Group=alertmanager
ExecStart=/usr/local/bin/alertmanager \
  --config.file=/etc/alertmanager/alertmanager.yml \
  --storage.path=/var/lib/alertmanager \
  --log.level=debug

Restart=always

[Install]
WantedBy=multi-user.target
Node Exporter Service
Create and write into this /etc/systemd/system/node-exporter.service:
[Unit]
Description=Node Exporter
Wants=network-online.target
After=network-online.target

[Service]
User=node_exporter
Group=node_exporter
ExecStart=/usr/local/bin/node_exporter \
  --collector.filesystem.ignored-mount-points="^/(sys|proc|dev|host|etc)($$|/)"

Restart=always

[Install]
WantedBy=multi-user.target
Blackbox Exporter Service
Create /etc/systemd/system/blackbox-exporter.service and write inti it with this:
[Unit]
Description=Blackbox Exporter
Wants=network-online.target
After=network-online.target

[Service]
User=blackbox
Group=blackbox
ExecStart=/usr/local/bin/blackbox_exporter \
  --config.file=/etc/blackbox_exporter/blackbox.yml

Restart=always

[Install]
WantedBy=multi-user.target
DORA Metrics Service
Create /etc/systemd/system/dora-metrics.service and write inti it with this:
[Unit]
Description=DORA Metrics Exporter
After=network.target

[Service]
User=dora
Group=dora
EnvironmentFile=/etc/default/dora-metrics
WorkingDirectory=/opt/dora-exporter
ExecStart=/opt/dora-exporter/venv/bin/python3 /opt/dora-exporter/main.py
Restart=always

[Install]
WantedBy=multi-user.target
📝 Part 3: Configuration Files
Time to set up the actual monitoring configuration. This is where I tell our stack what to monitor and how to alert.
Prometheus Configuration
Create /etc/prometheus/prometheus.yml and write into it with this:
global:
  scrape_interval: 15s
  evaluation_interval: 15s

# Alertmanager configuration
alerting:
  alertmanagers:
    - static_configs:
      - targets: ['localhost:9093']

# Load rules once and periodically evaluate them
rule_files:
  - "rules/node_exporter_alerts.yml"
  - "rules/blackbox_alerts.yml"
  - "rules/dora_alerts.yml"

scrape_configs:
  - job_name: 'prometheus'
    static_configs:
      - targets: ['localhost:9090']

  - job_name: 'node_exporter'
    scrape_interval: 10s
    static_configs:
      - targets: ['localhost:9100']

  # PM2 metrics from host (for NextJS apps)
  - job_name: 'pm2'
    scrape_interval: 10s
    static_configs:
      - targets: ['localhost:9209']

  # Blackbox exporter for HTTP/HTTPS uptime and SSL monitoring
  - job_name: 'blackbox_http'
    metrics_path: /probe
    params:
      module: [http_2xx]  # Look for a HTTP 200 response
    static_configs:
      - targets:
        - https://website-url
        # Add more URLs as needed
    relabel_configs:
      - source_labels: [__address__]
        target_label: __param_target
      - source_labels: [__param_target]
        target_label: instance
      - target_label: __address__
        replacement: localhost:9115  # Blackbox exporter's address

  # Blackbox exporter for SSL monitoring
  - job_name: 'blackbox_ssl'
    metrics_path: /probe
    params:
      module: [tls]  # Use the TLS probe
    static_configs:
      - targets:
        - website-url:443
    relabel_configs:
      - source_labels: [__address__]
        target_label: __param_target
      - source_labels: [__param_target]
        target_label: instance
      - target_label: __address__
        replacement: localhost:9115

  - job_name: 'dora-metrics'
    static_configs:
      - targets: ['localhost:8000']
Alert Rules
Server Health Alerts
Create /etc/prometheus/rules/node_exporter_alerts.yml and write into it with this:
groups:
- name: node-exporter
  rules:
  - alert: HighCPULoad
    expr: 100 - (avg by(instance) (irate(node_cpu_seconds_total{mode="idle"}[5m])) * 100) > 80
    for: 2m
    labels:
      severity: warning
    annotations:
      summary: "High CPU load (instance {{ $labels.instance }})"
      description: "CPU load is > 80%\n  VALUE = {{ $value }}%\n  LABELS: {{ $labels }}"

  - alert: HighMemoryLoad
    expr: (node_memory_MemTotal_bytes - (node_memory_MemFree_bytes + node_memory_Buffers_bytes + node_memory_Cached_bytes)) / node_memory_MemTotal_bytes * 100 > 80
    for: 2m
    labels:
      severity: warning
    annotations:
      summary: "High memory load (instance {{ $labels.instance }})"
      description: "Memory load is > 80%\n  VALUE = {{ $value }}%\n  LABELS: {{ $labels }}"

  - alert: HighDiskUsage
    expr: (node_filesystem_size_bytes{fstype!~"tmpfs|fuse.lxcfs|squashfs|vfat"} - node_filesystem_free_bytes{fstype!~"tmpfs|fuse.lxcfs|squashfs|vfat"}) / node_filesystem_size_bytes{fstype!~"tmpfs|fuse.lxcfs|squashfs|vfat"} * 100 > 85
    for: 5m
    labels:
      severity: warning
    annotations:
      summary: "High disk usage (instance {{ $labels.instance }})"
      description: "Disk usage is > 85%\n  VALUE = {{ $value }}%\n  LABELS: {{ $labels }}"
Website Availability Alerts
Create /etc/prometheus/rules/blackbox_alerts.yml and write into it with this:
groups:
- name: blackbox-exporter
  rules:
  - alert: EndpointDown
    expr: probe_success == 0
    for: 1m
    labels:
      severity: critical
    annotations:
      summary: "Endpoint down (instance {{ $labels.instance }})"
      description: "Endpoint {{ $labels.instance }} is down\n  VALUE = {{ $value }}\n  LABELS: {{ $labels }}"

  - alert: SlowResponseTime
    expr: probe_duration_seconds > 1
    for: 5m
    labels:
      severity: warning
    annotations:
      summary: "Slow response time (instance {{ $labels.instance }})"
      description: "Response time is > 1s\n  VALUE = {{ $value }}s\n  LABELS: {{ $labels }}"

  - alert: SSLCertExpiringSoon
    expr: probe_ssl_earliest_cert_expiry - time() < 86400 * 30
    for: 5m
    labels:
      severity: warning
    annotations:
      summary: "SSL certificate expiring soon (instance {{ $labels.instance }})"
      description: "SSL certificate expires in less than 30 days\n  VALUE = {{ $value }} days\n  LABELS: {{ $labels }}"

  - alert: SSLCertExpired
    expr: probe_ssl_earliest_cert_expiry - time() <= 0
    for: 1m
    labels:
      severity: critical
    annotations:
      summary: "SSL certificate expired (instance {{ $labels.instance }})"
      description: "SSL certificate has expired\n  VALUE = {{ $value }}\n  LABELS: {{ $labels }}"
DORA Performance Metrics
Create /etc/prometheus/rules/dora_alerts.yml and write into it with this:
groups:
- name: dora-metrics
  rules:
  - alert: HighChangeFailureRate
    expr: (sum(increase(github_deployment_failed_total[7d])) / sum(increase(github_deployment_total[7d]))) * 100 > 15
    for: 1h
    labels:
      severity: warning
    annotations:
      summary: "High change failure rate"
      description: "Change failure rate is > 15% over the last 7 days\n  VALUE = {{ $value }}%"

  - alert: LongMeanTimeToRestore
    expr: avg(github_incident_mttr_seconds) / 60 > 60
    for: 1h
    labels:
      severity: warning
    annotations:
      summary: "Long mean time to restore"
      description: "Mean time to restore is > 60 minutes\n  VALUE = {{ $value }} minutes"

  - alert: LowDeploymentFrequency
    expr: sum(increase(github_deployment_total[7d])) < 3
    for: 1d
    labels:
      severity: warning
    annotations:
      summary: "Low deployment frequency"
      description: "Less than 3 deployments in the last 7 days\n  VALUE = {{ $value }} deployments"
AlertManager Configuration
In creating the alertmanager file, we need to have the slack webhook url. Now we can actually pass the url directly into the config file, but that's a huge security risk; and Slack will deactivate it after a while.
So what we'll do instead is to save the webhook url into a file, give it needed permissions and pass the file into our alertmanager config file.
Create /etc/alertmanager/slack_api_url and write ONLY your webhook url into it.
Next give the file only read permissions for users:
chmod 644 /etc/alertmanager/slack_api_urlNext, create /etc/alertmanager/alertmanager.yml and write into it with this:
global:
  resolve_timeout: 5m
  slack_api_url_file: '/etc/alertmanager/slack_api_url'

route:
  group_by: ['alertname', 'instance', 'job']
  group_wait: 30s
  group_interval: 5m
  repeat_interval: 4h
  receiver: 'slack-notifications'
  routes:
    - match:
        severity: critical
      receiver: 'slack-critical'
    - match:
        severity: warning
      receiver: 'slack-warning'

receivers:
  - name: 'slack-notifications'
    slack_configs:
      - send_resolved: true
        channel: '#devops-alerts'
        title: '{{ if eq .Status "firing" }}🔴 ALERT{{ else }}🟢 RESOLVED{{ end }}: {{ .CommonLabels.alertname }}'
        text: |
          {{ if eq .Status "firing" }}*SYSTEM ALERT*{{ else }}*SYSTEM RECOVERED*{{ end }}

          {{ range .Alerts }}
          *{{ .Annotations.summary }}*
          {{ .Annotations.description }}

          *⏰ Incident Details:*
          • Started: {{ .StartsAt }}
          • Status: {{ .Status | toUpper }}

          *🔍 Technical Information:*
          • System: {{ .Labels.instance }}
          • Job: {{ .Labels.job }}
          • Severity: {{ .Labels.severity }}

          *👥 Impact Assessment:*
          • Users affected: {{ if eq .Labels.job "blackbox_http" }}Website visitors{{ else }}Service users{{ end }}

          *👥 Team to Notify:* @devops-team
          {{ end }}
        icon_emoji: '{{ if eq .Status "firing" }}:red_circle:{{ else }}:green_circle:{{ end }}'

  - name: 'slack-critical'
    slack_configs:
      - send_resolved: true
        channel: '#devops-alerts'
        title: '{{ if eq .Status "firing" }}🔴 CRITICAL{{ else }}🟢 RESOLVED{{ end }}: {{ .CommonLabels.alertname }}'
        text: |
          {{ if eq .Status "firing" }}*CRITICAL SYSTEM ALERT*{{ else }}*SYSTEM RECOVERED*{{ end }}

          {{ range .Alerts }}
          *{{ .Annotations.summary }}*
          {{ .Annotations.description }}

          *⏰ Incident Details:*
          • Started: {{ .StartsAt }}
          • Status: {{ .Status | toUpper }}

          *🔍 Technical Information:*
          • System: {{ .Labels.instance }}
          • Job: {{ .Labels.job }}
          {{ if eq .Labels.job "blackbox_http" }}• Error: Connection failed
          • HTTP Status: No response{{ end }}

          *👥 Impact Assessment:*
          • Severity: Critical
          • User Impact: {{ if eq .Labels.job "blackbox_http" }}All website users affected{{ else }}Service degradation{{ end }}

          *🚨 Attention:* <@U089ZLRDV1N> <@U08BD88M87J> <@U08AN9DLDMH> <@U08AQNQVC8L> <@U08B8JT5RAN> <@U08ANPWRP9Q> <@U08A81WGZHV> <@U08A8QAN2P9> <@U08AP0AGQ9Z> <@U08AMPHCPSN>
          {{ end }}
        icon_emoji: '{{ if eq .Status "firing" }}:fire:{{ else }}:white_check_mark:{{ end }}'
        link_names: true

  - name: 'slack-warning'
    slack_configs:
      - send_resolved: true
        channel: '#devops-alerts'
        title: '{{ if eq .Status "firing" }}⚠️ WARNING{{ else }}🟢 RESOLVED{{ end }}: {{ .CommonLabels.alertname }}'
        text: |
          {{ if eq .Status "firing" }}*WARNING ALERT*{{ else }}*WARNING RESOLVED*{{ end }}

          {{ range .Alerts }}
          *{{ .Annotations.summary }}*
          {{ .Annotations.description }}

          *⏰ Incident Details:*
          • Started: {{ .StartsAt }}
          • Status: {{ .Status | toUpper }}

          *🔍 Technical Information:*
          • System: {{ .Labels.instance }}
          • Job: {{ .Labels.job }}
          {{ if eq .Labels.alertname "SlowResponseTime" }}• Response Time: {{ if eq .Labels.job "blackbox_http" }}Slow{{ end }}{{ end }}
          {{ if eq .Labels.alertname "SSLCertExpiringSoon" }}• Certificate Expires: Soon{{ end }}
          {{ if eq .Labels.alertname "HighCPULoad" }}• CPU Load: High{{ end }}
          {{ if eq .Labels.alertname "HighMemoryLoad" }}• Memory Use: High{{ end }}
          {{ if eq .Labels.alertname "HighDiskUsage" }}• Disk Usage: High{{ end }}

          *👥 Impact Assessment:*
          • Severity: Warning
          • User Impact: Potential performance degradation

          *💡 Recommended Actions:*
          {{ if eq .Labels.alertname "SlowResponseTime" }}Check database queries or high backend resource usage.{{ else if eq .Labels.alertname "SSLCertExpiringSoon" }}Renew SSL certificate before expiration.{{ else if eq .Labels.alertname "HighCPULoad" }}Identify CPU-intensive processes and optimize.{{ else if eq .Labels.alertname "HighMemoryLoad" }}Check for memory leaks or increase available memory.{{ else if eq .Labels.alertname "HighDiskUsage" }}Clean up disk space or expand storage.{{ end }}

          *🚨 Attention:* <@U089ZLRDV1N> <@U08BD88M87J> <@U08AN9DLDMH> <@U08AQNQVC8L> <@U08B8JT5RAN> <@U08ANPWRP9Q> <@U08A81WGZHV> <@U08A8QAN2P9> <@U08AP0AGQ9Z> <@U08AMPHCPSN>
          {{ end }}
        icon_emoji: '{{ if eq .Status "firing" }}:warning:{{ else }}:white_check_mark:{{ end }}'
        link_names: true
Blackbox Exporter Configuration
Create /etc/blackbox_exporter/blackbox.yml and write into it with this:
modules:
  http_2xx:
    prober: http
    timeout: 5s
    http:
      valid_http_versions: ["HTTP/1.1", "HTTP/2.0"]
      valid_status_codes: [200]
      method: GET
      follow_redirects: true
      preferred_ip_protocol: "ip4"
      tls_config:
        insecure_skip_verify: false

  http_post_2xx:
    prober: http
    timeout: 5s
    http:
      method: POST
      preferred_ip_protocol: "ip4"

  tcp_connect:
    prober: tcp
    timeout: 5s

  tls:
    prober: tcp
    timeout: 5s
    tcp:
      tls: true
      preferred_ip_protocol: "ip4"
      tls_config:
        insecure_skip_verify: false
🔔 Part 4: Integrating with Slack
Real-time notifications are crucial for fast incident response. Let's set up Slack integration:
- Create a Slack App:
Go to Slack API Apps
Click "Create New App" → "From scratch"
Name your app (e.g., "DeploymentMonitor")
Select your workspace
2. Enable Incoming Webhooks:
Navigate to "Incoming Webhooks" in the sidebar
Toggle "Activate Incoming Webhooks" to ON
Click "Add New Webhook to Workspace"
Select the channel for receiving alerts
Copy the Webhook URL and replace the placeholder in your alertmanager.yml
3. Configure Alert Formatting:
Our configuration creates informative, well-formatted alerts
Critical alerts use 🔴 while resolved alerts use 🟢
Alerts include relevant links and contextual information
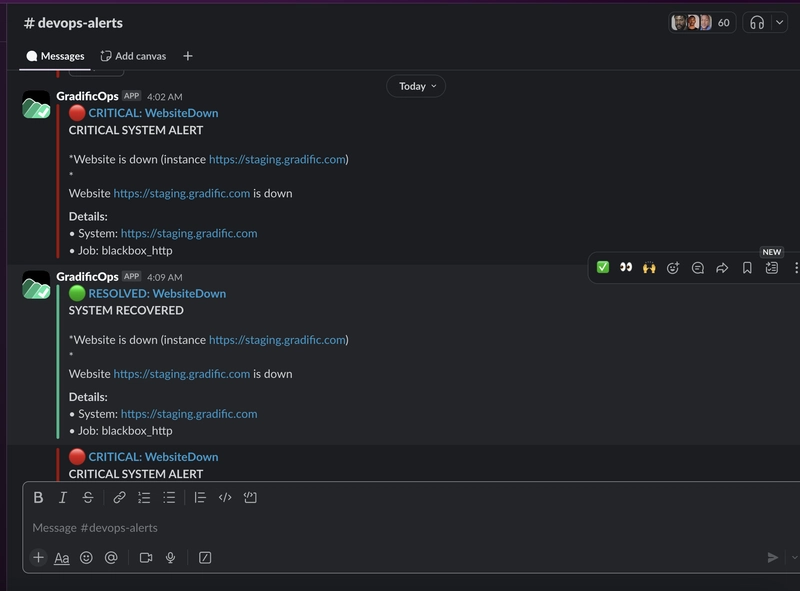
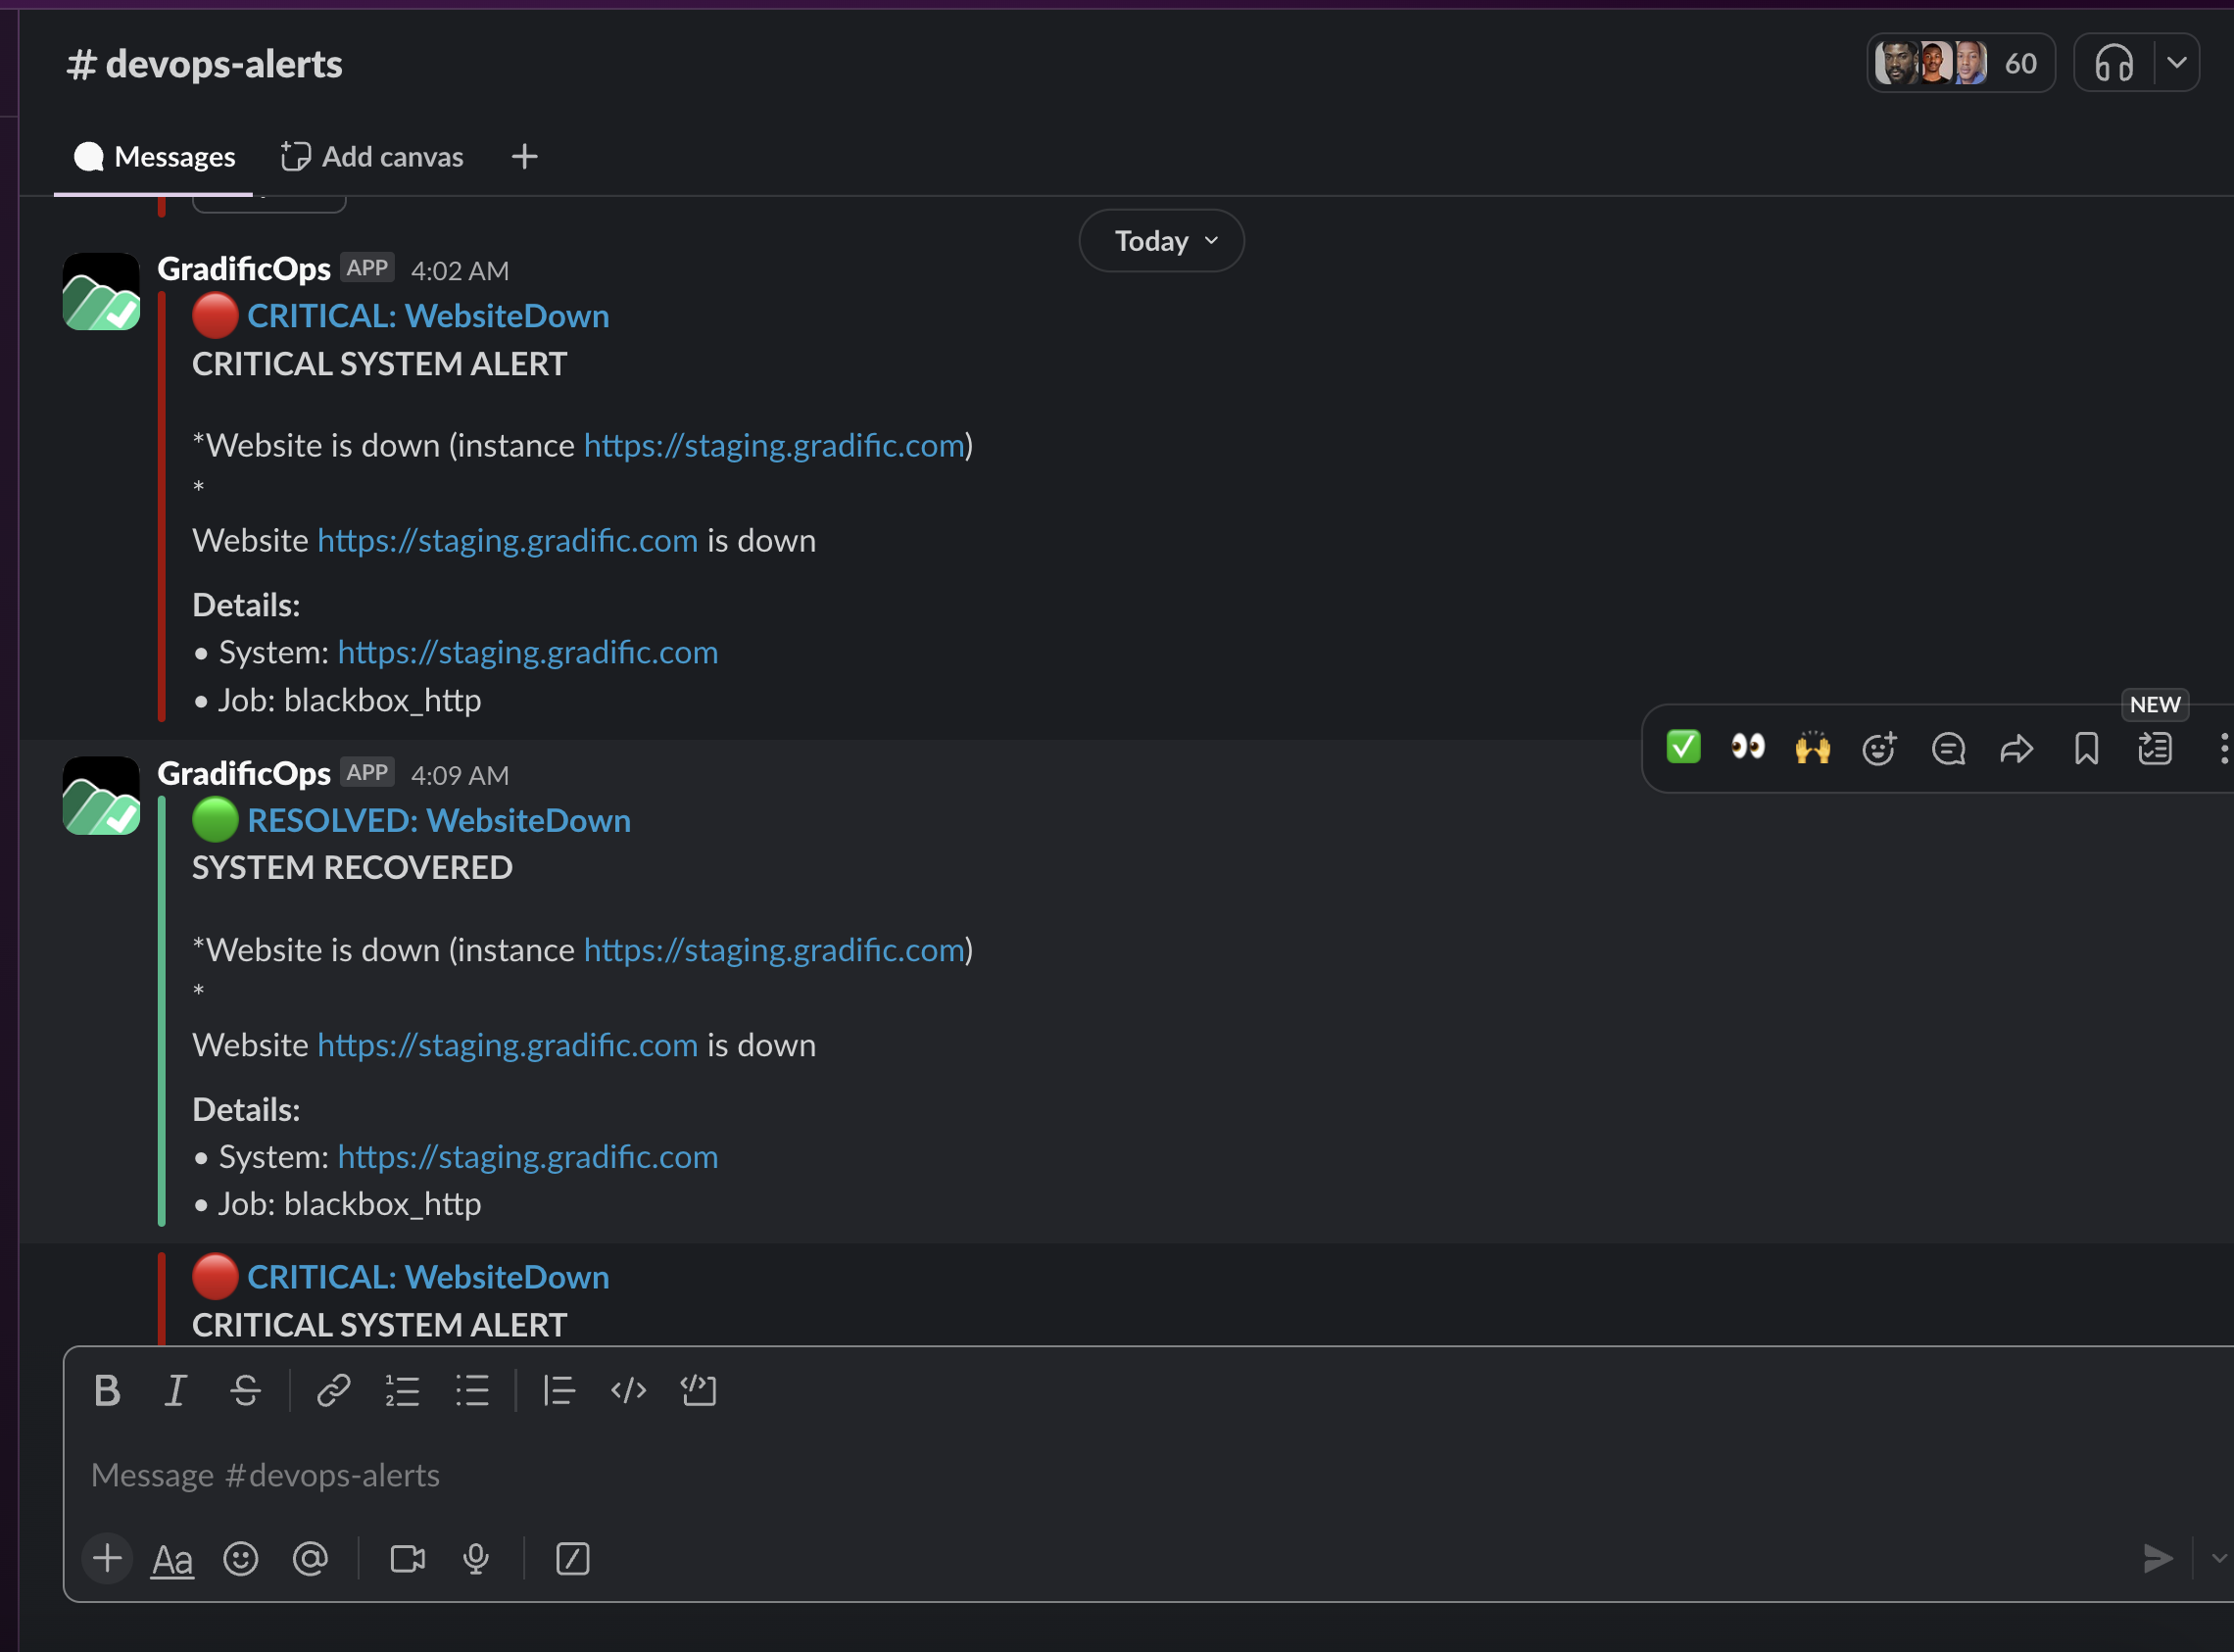
An example of a slack alert
🖥️ Part 5: Launching Your Monitoring Stack
Time to bring everything online:
# Enable services to start at boot
sudo systemctl daemon-reload
sudo systemctl enable prometheus alertmanager node-exporter blackbox-exporter grafana-server dora-metrics
# Start all services
sudo systemctl start prometheus alertmanager node-exporter blackbox-exporter grafana-server dora-metrics
# Verify everything is running
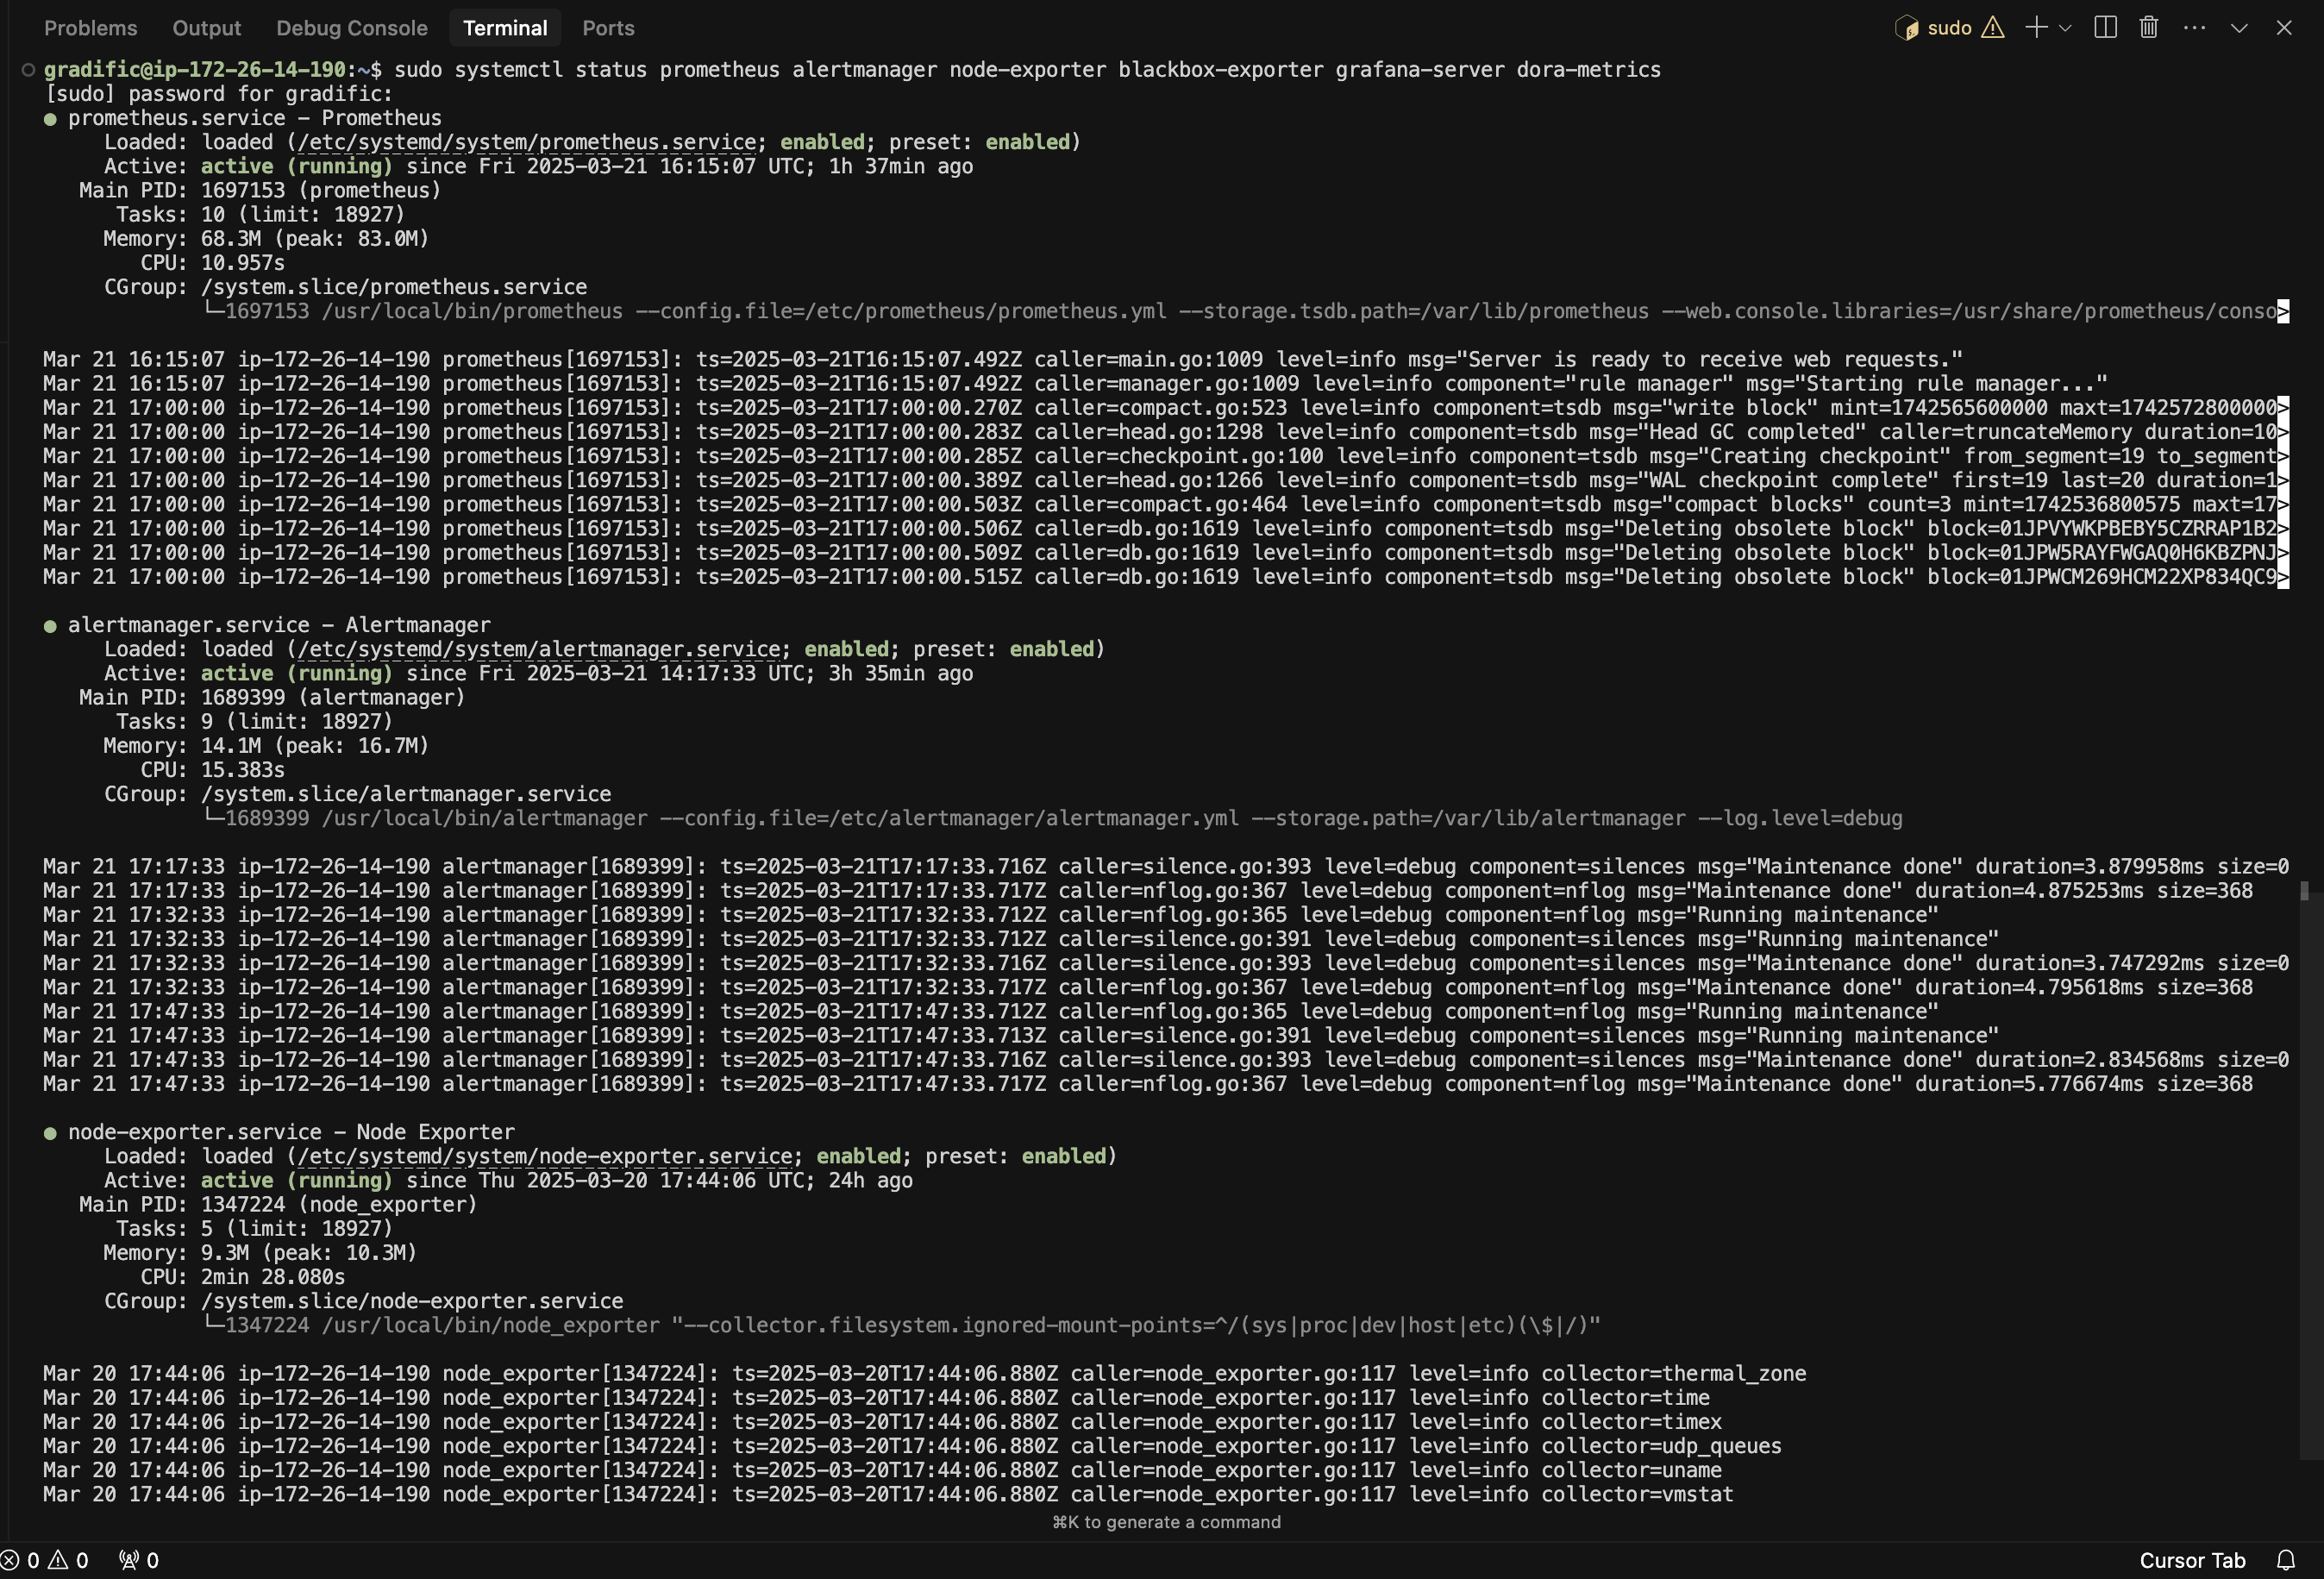
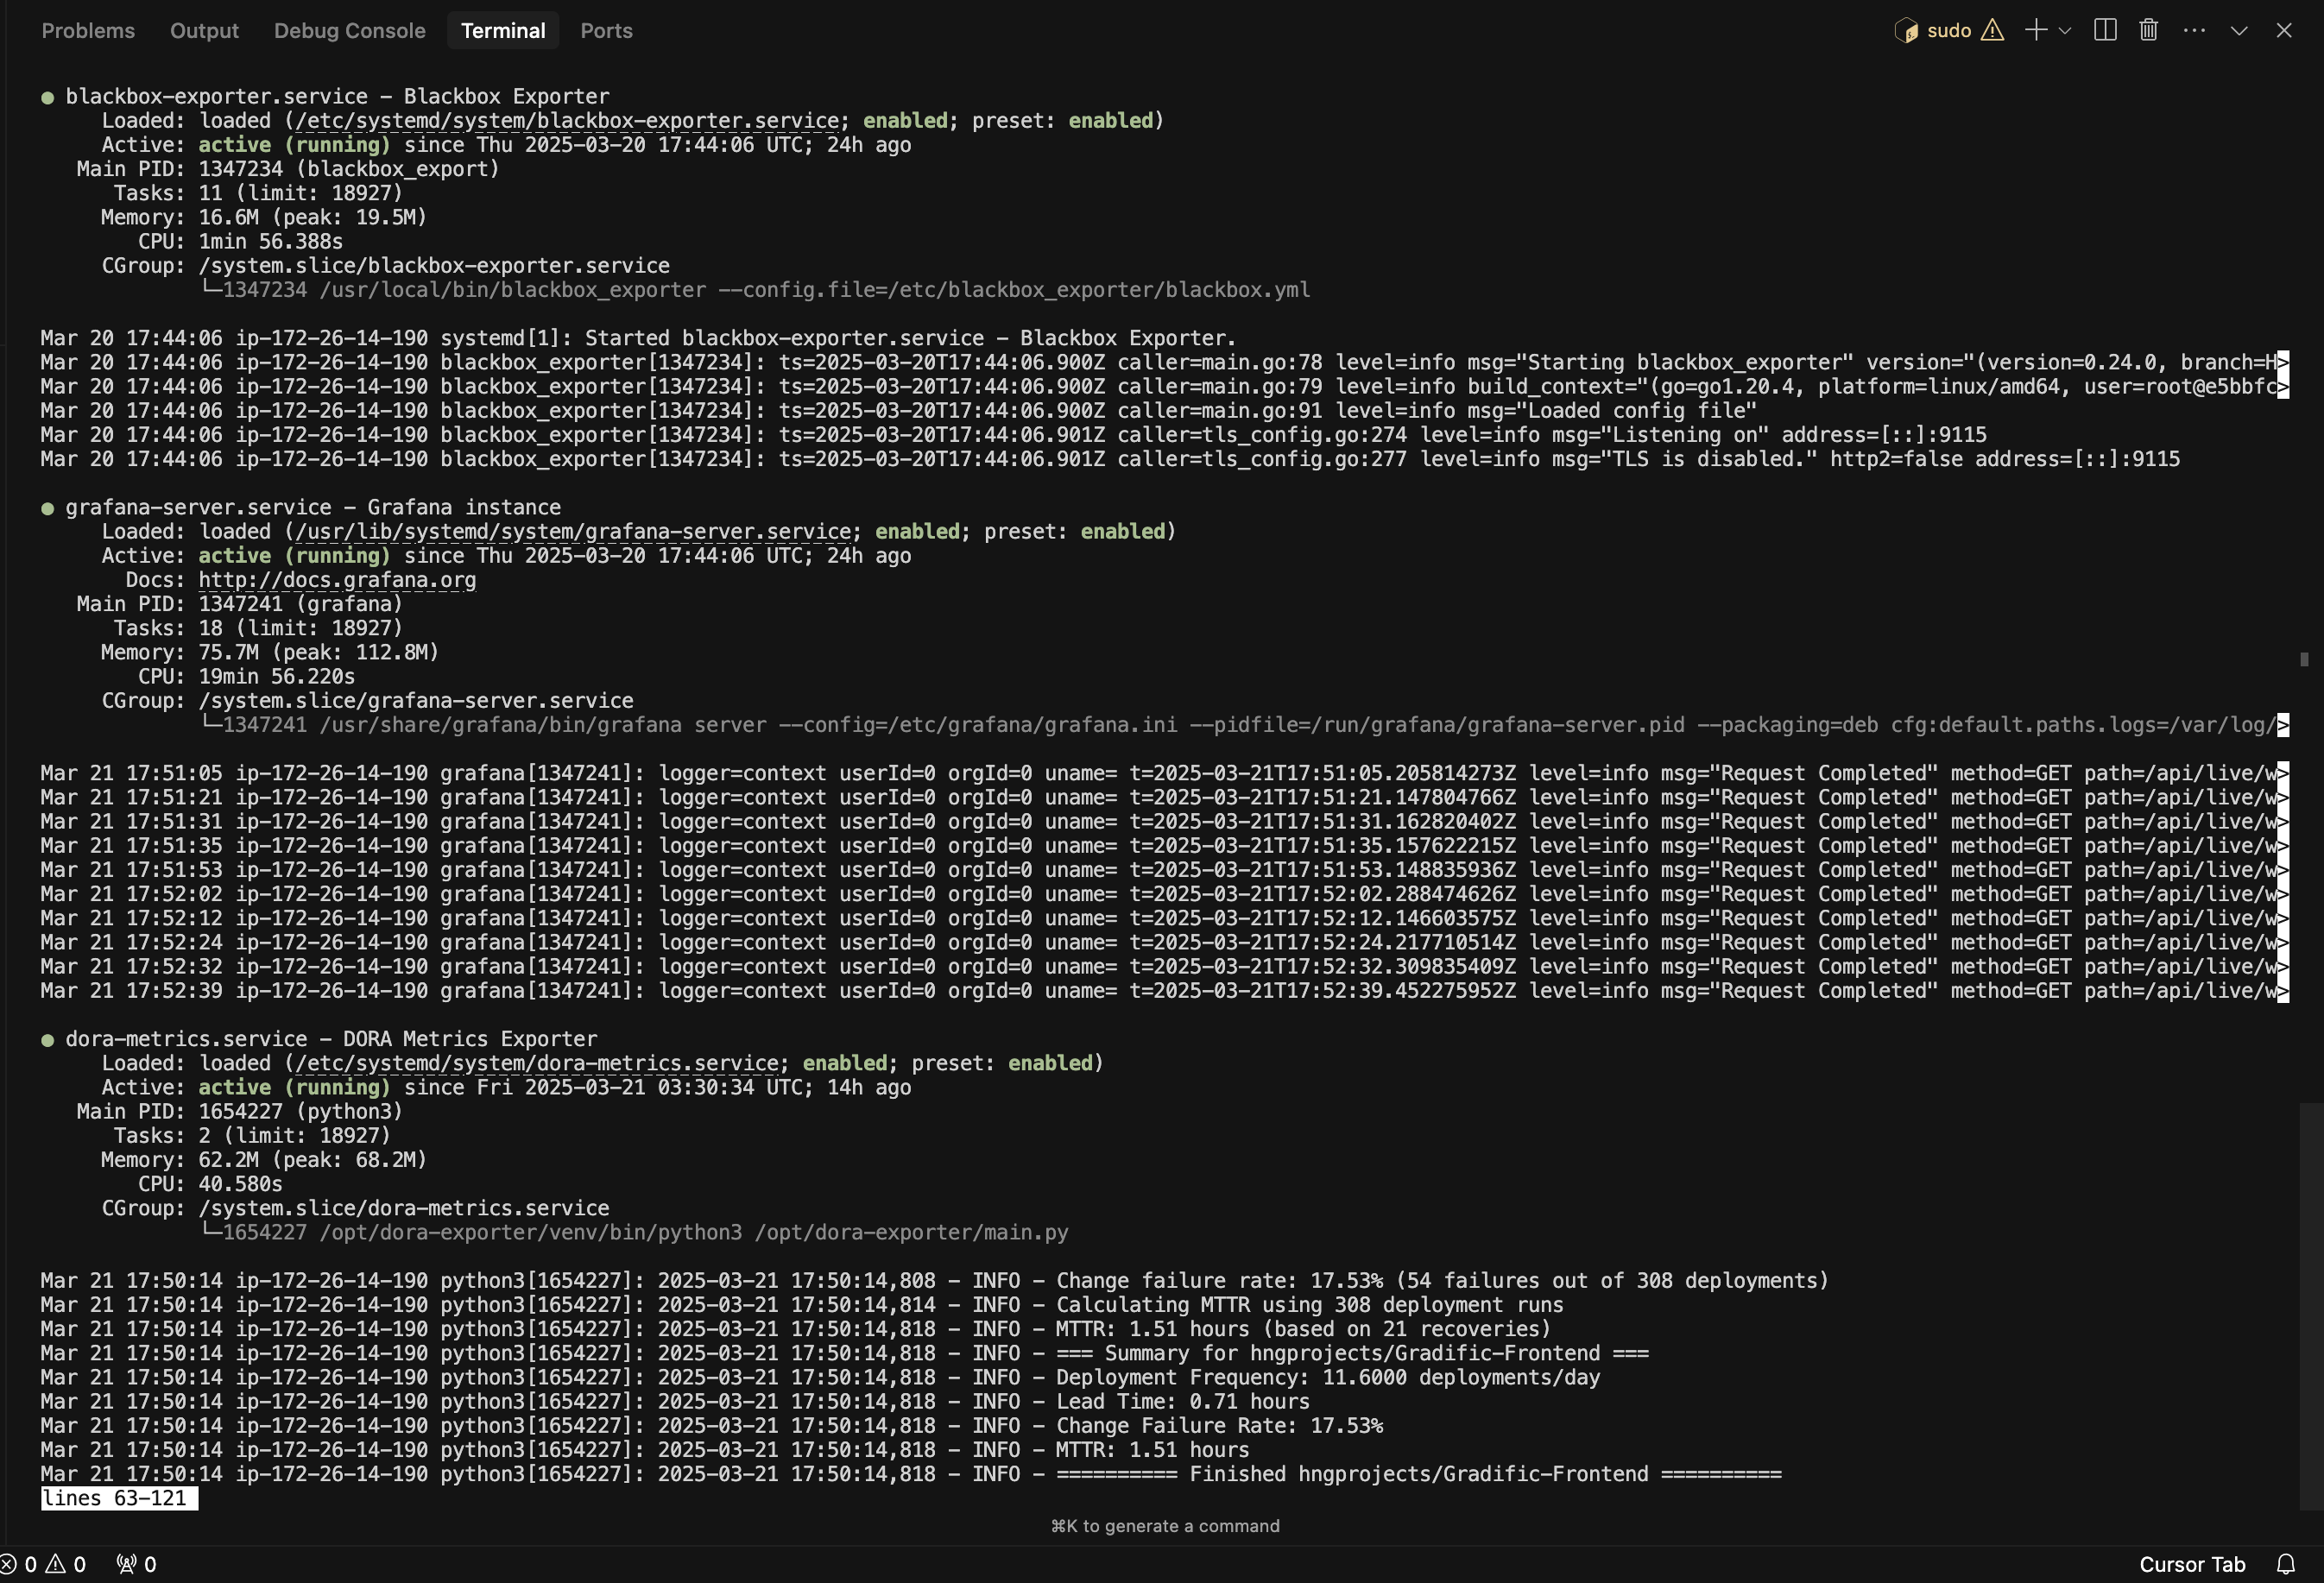
sudo systemctl status prometheus alertmanager node-exporter blackbox-exporter grafana-server dora-metricsIf all was setup well, it should show success messages like this:
📊 Part 6: Setting Up Grafana Dashboards
Now for the exciting part - visualizing all this data!
1. Access Grafana:
- Open your browser to http://:3000
- Default credentials are admin/admin
- You'll be prompted to set a new password
2. Add Prometheus as a Data Source:
- Click the gear icon (Configuration) → Data Sources
- Click "Add data source" and select "Prometheus"
- Set the URL to http://localhost:9090
- Click "Save & Test"
3. Import Pre-built Dashboards:
- Click "+" → "Import"
- Enter dashboard ID:
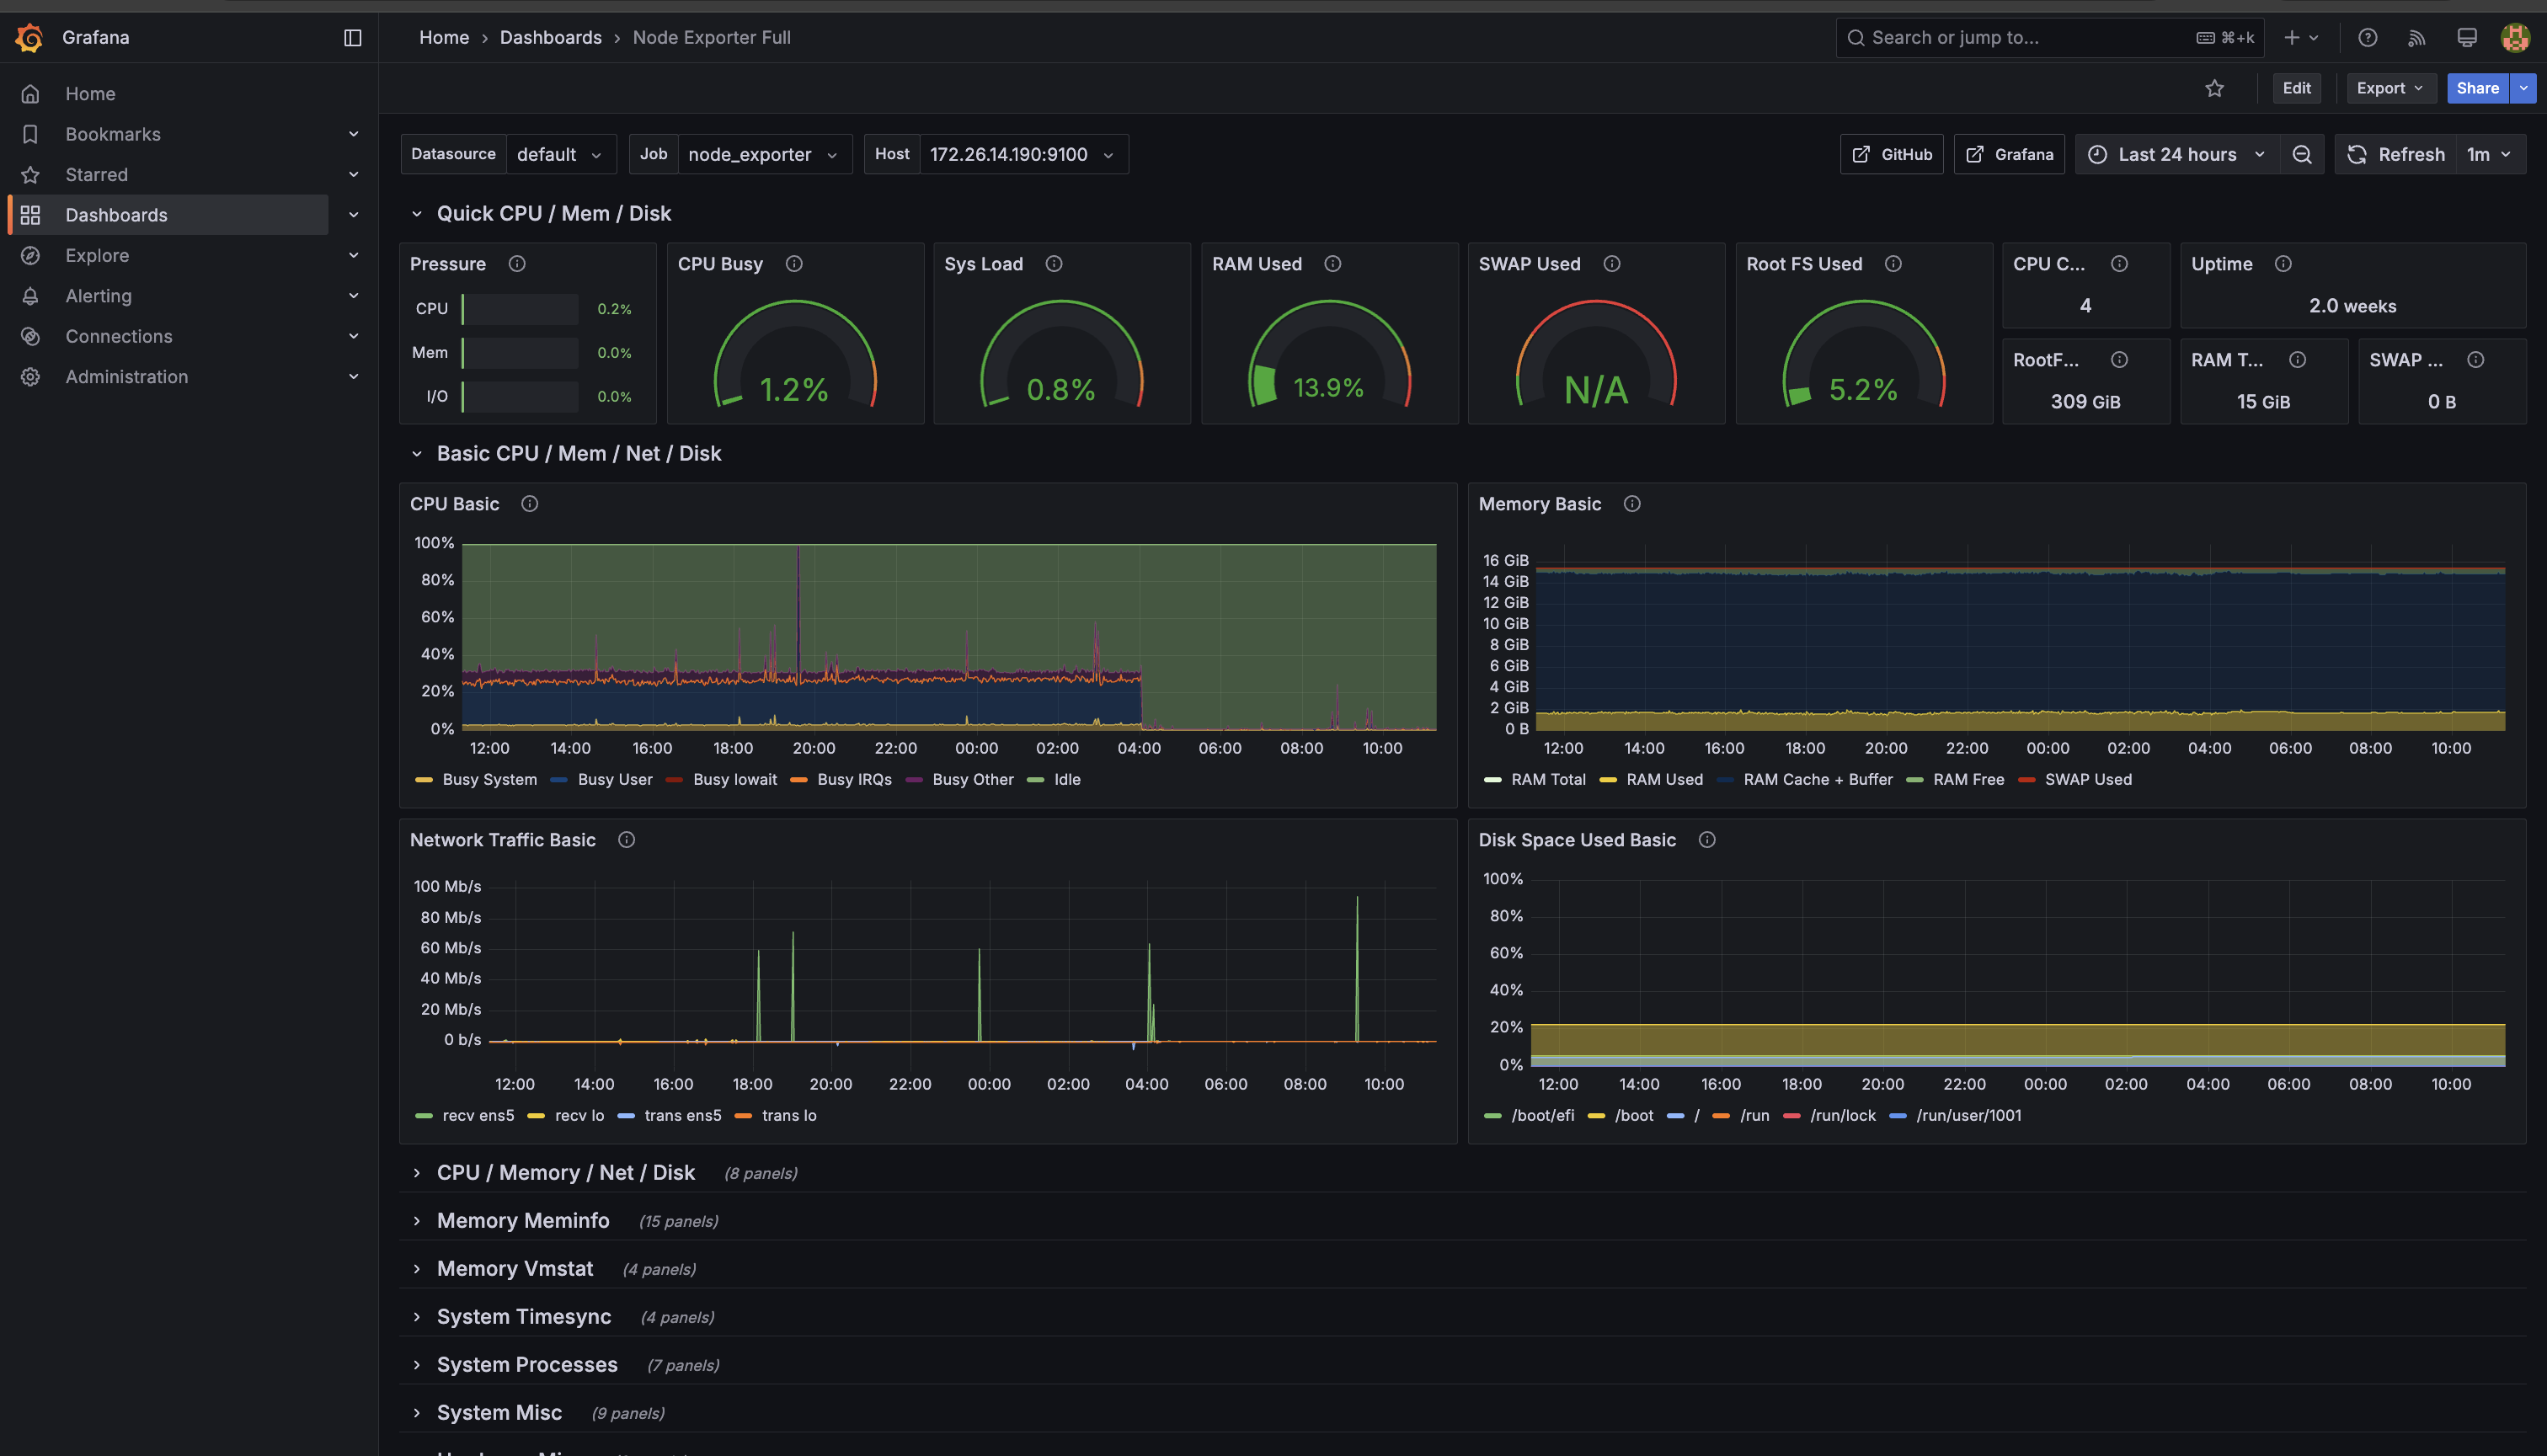
- Node Exporter: 1860
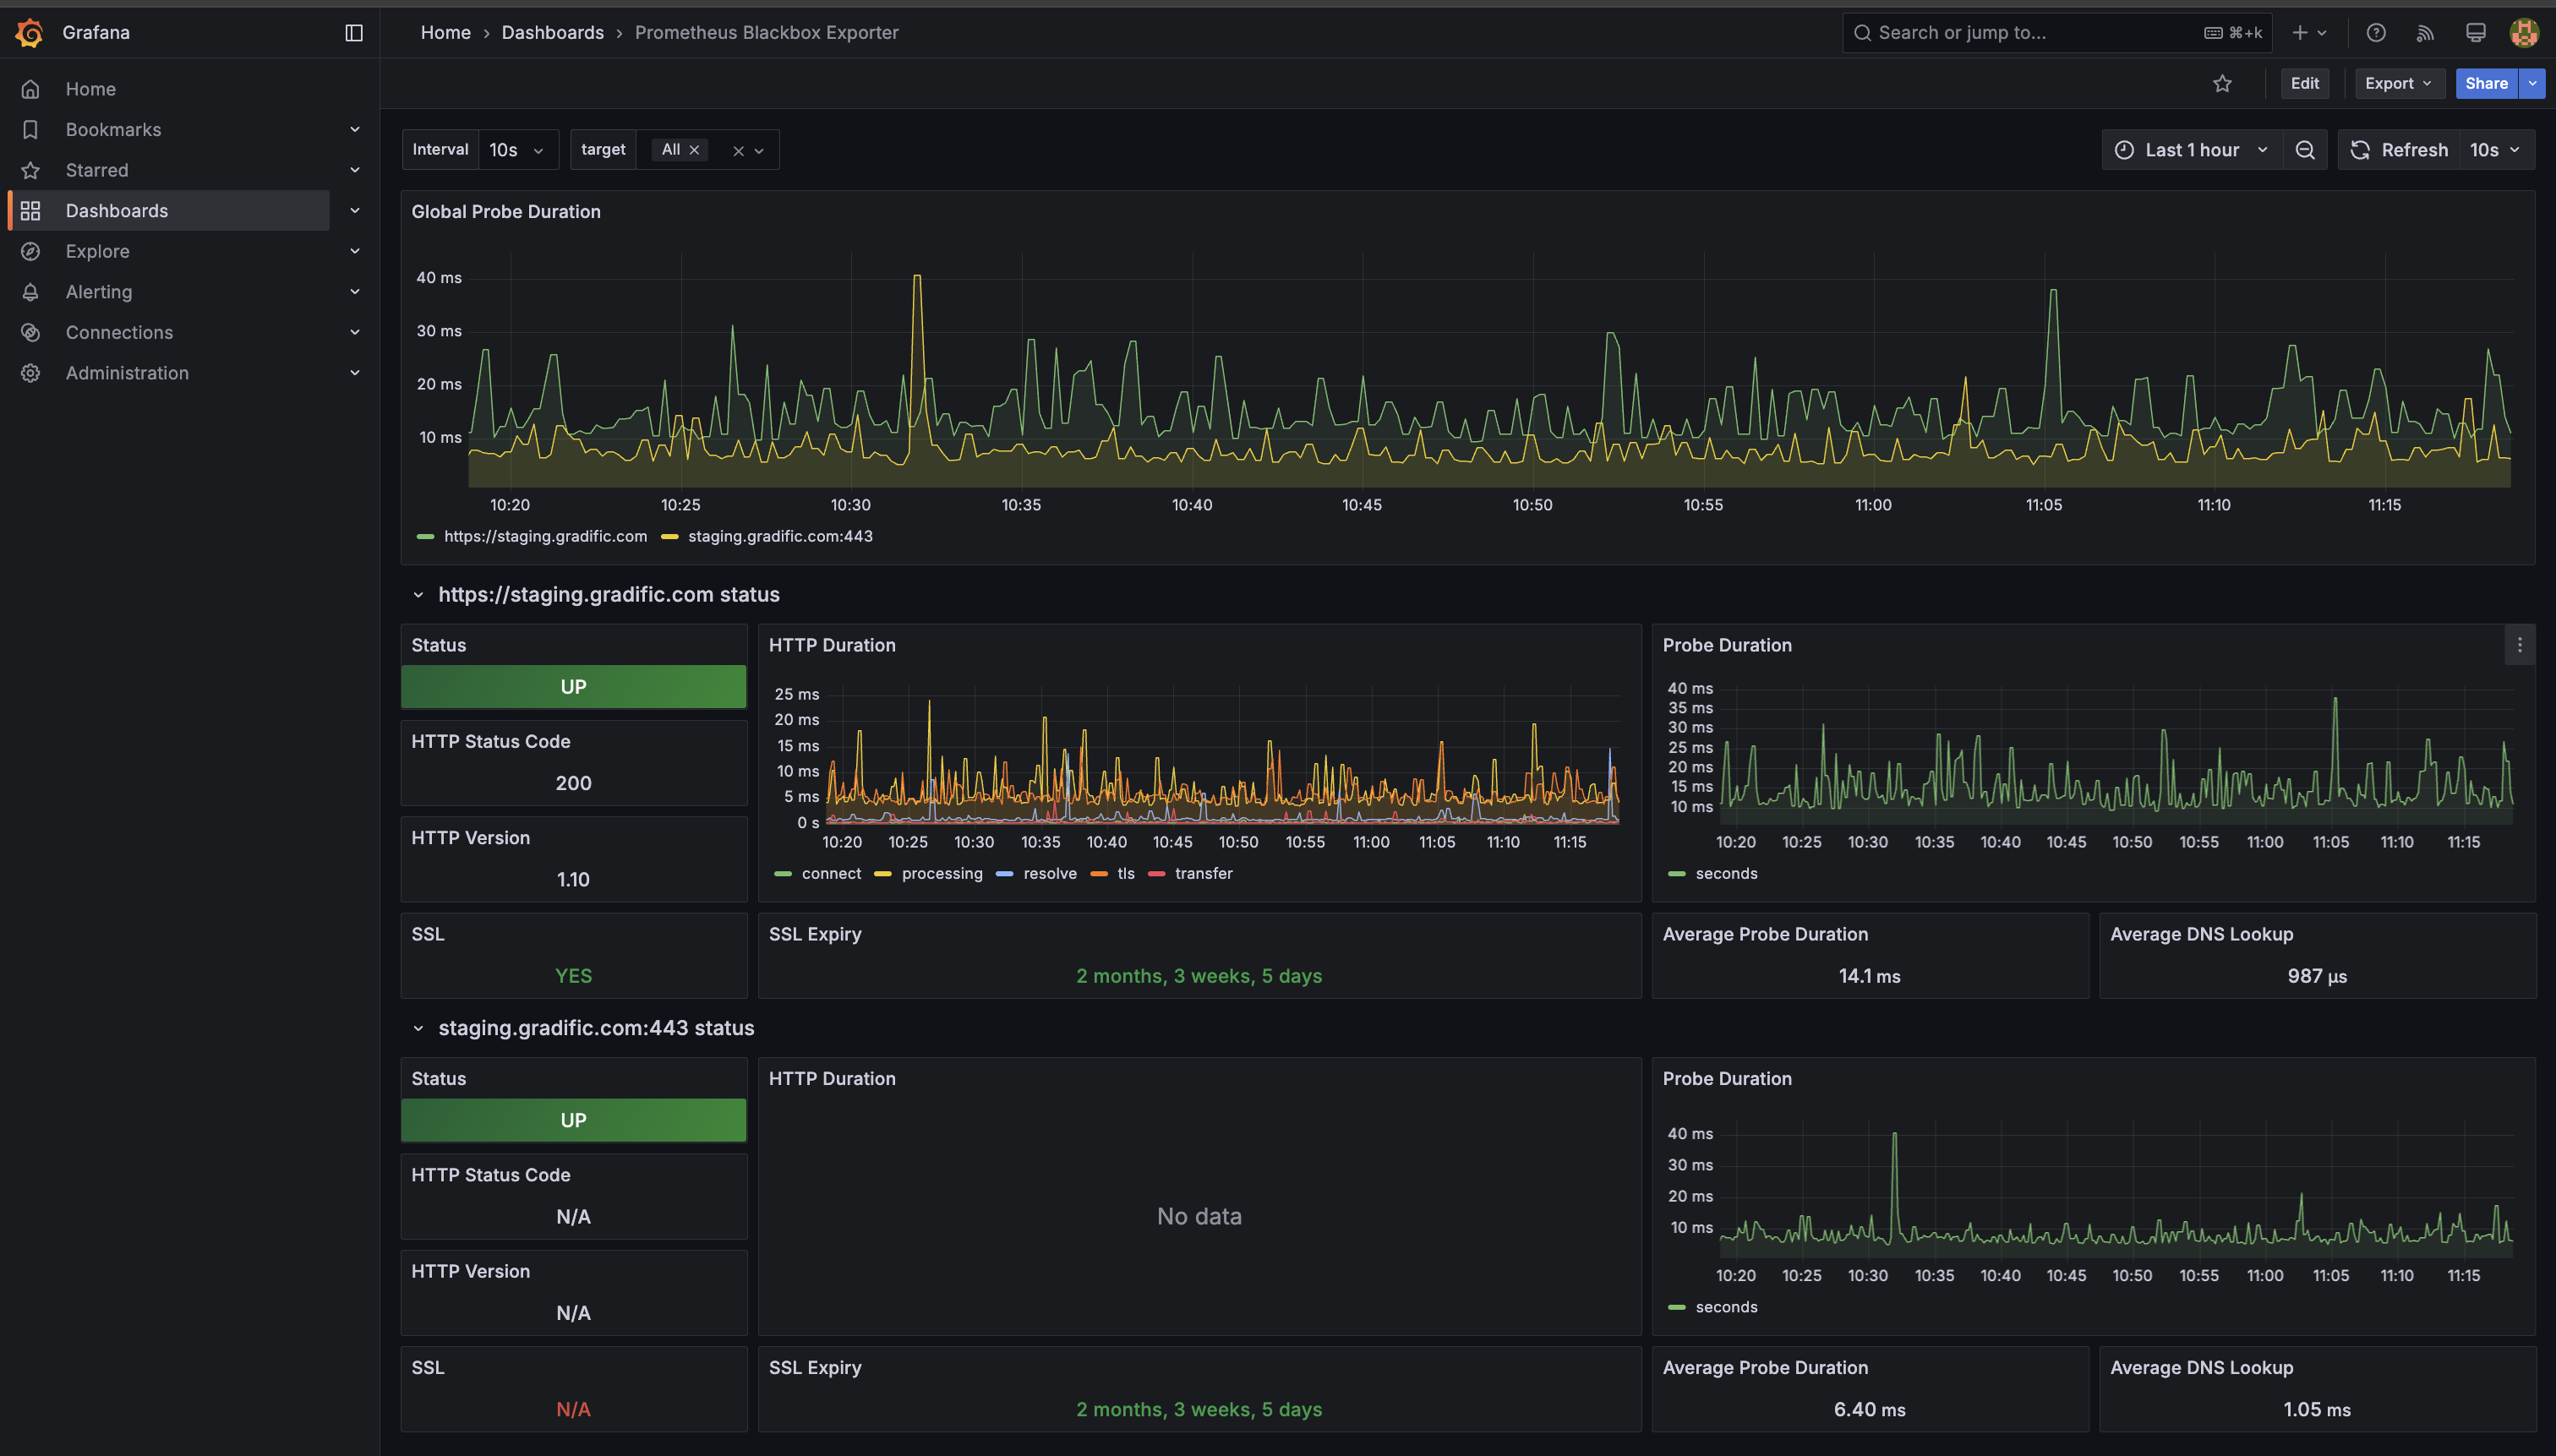
- Blackbox Exporter: 7587
- Select Prometheus as the data source
- Click "Import"
Node Exporter dashboard
Blackbox Dashboard
4. Import DORA Metrics Dashboard:
- Use the JSON file from NonsoEchendu/dora-metrics
- This provides detailed visualization of your software delivery performance
📈 Part 7: Understanding DORA Metrics
Our monitoring setup includes tracking of DORA metrics, which are industry-standard measures of development team performance:
- Deployment Frequency (DF): How often you successfully release to production
- Lead Time for Changes (LTC): Time from code commit to production deployment
- Change Failure Rate (CFR): Percentage of deployments causing a failure in production
- Mean Time to Restore (MTTR): How quickly service is restored after an incident
Dora Metrics dashboard
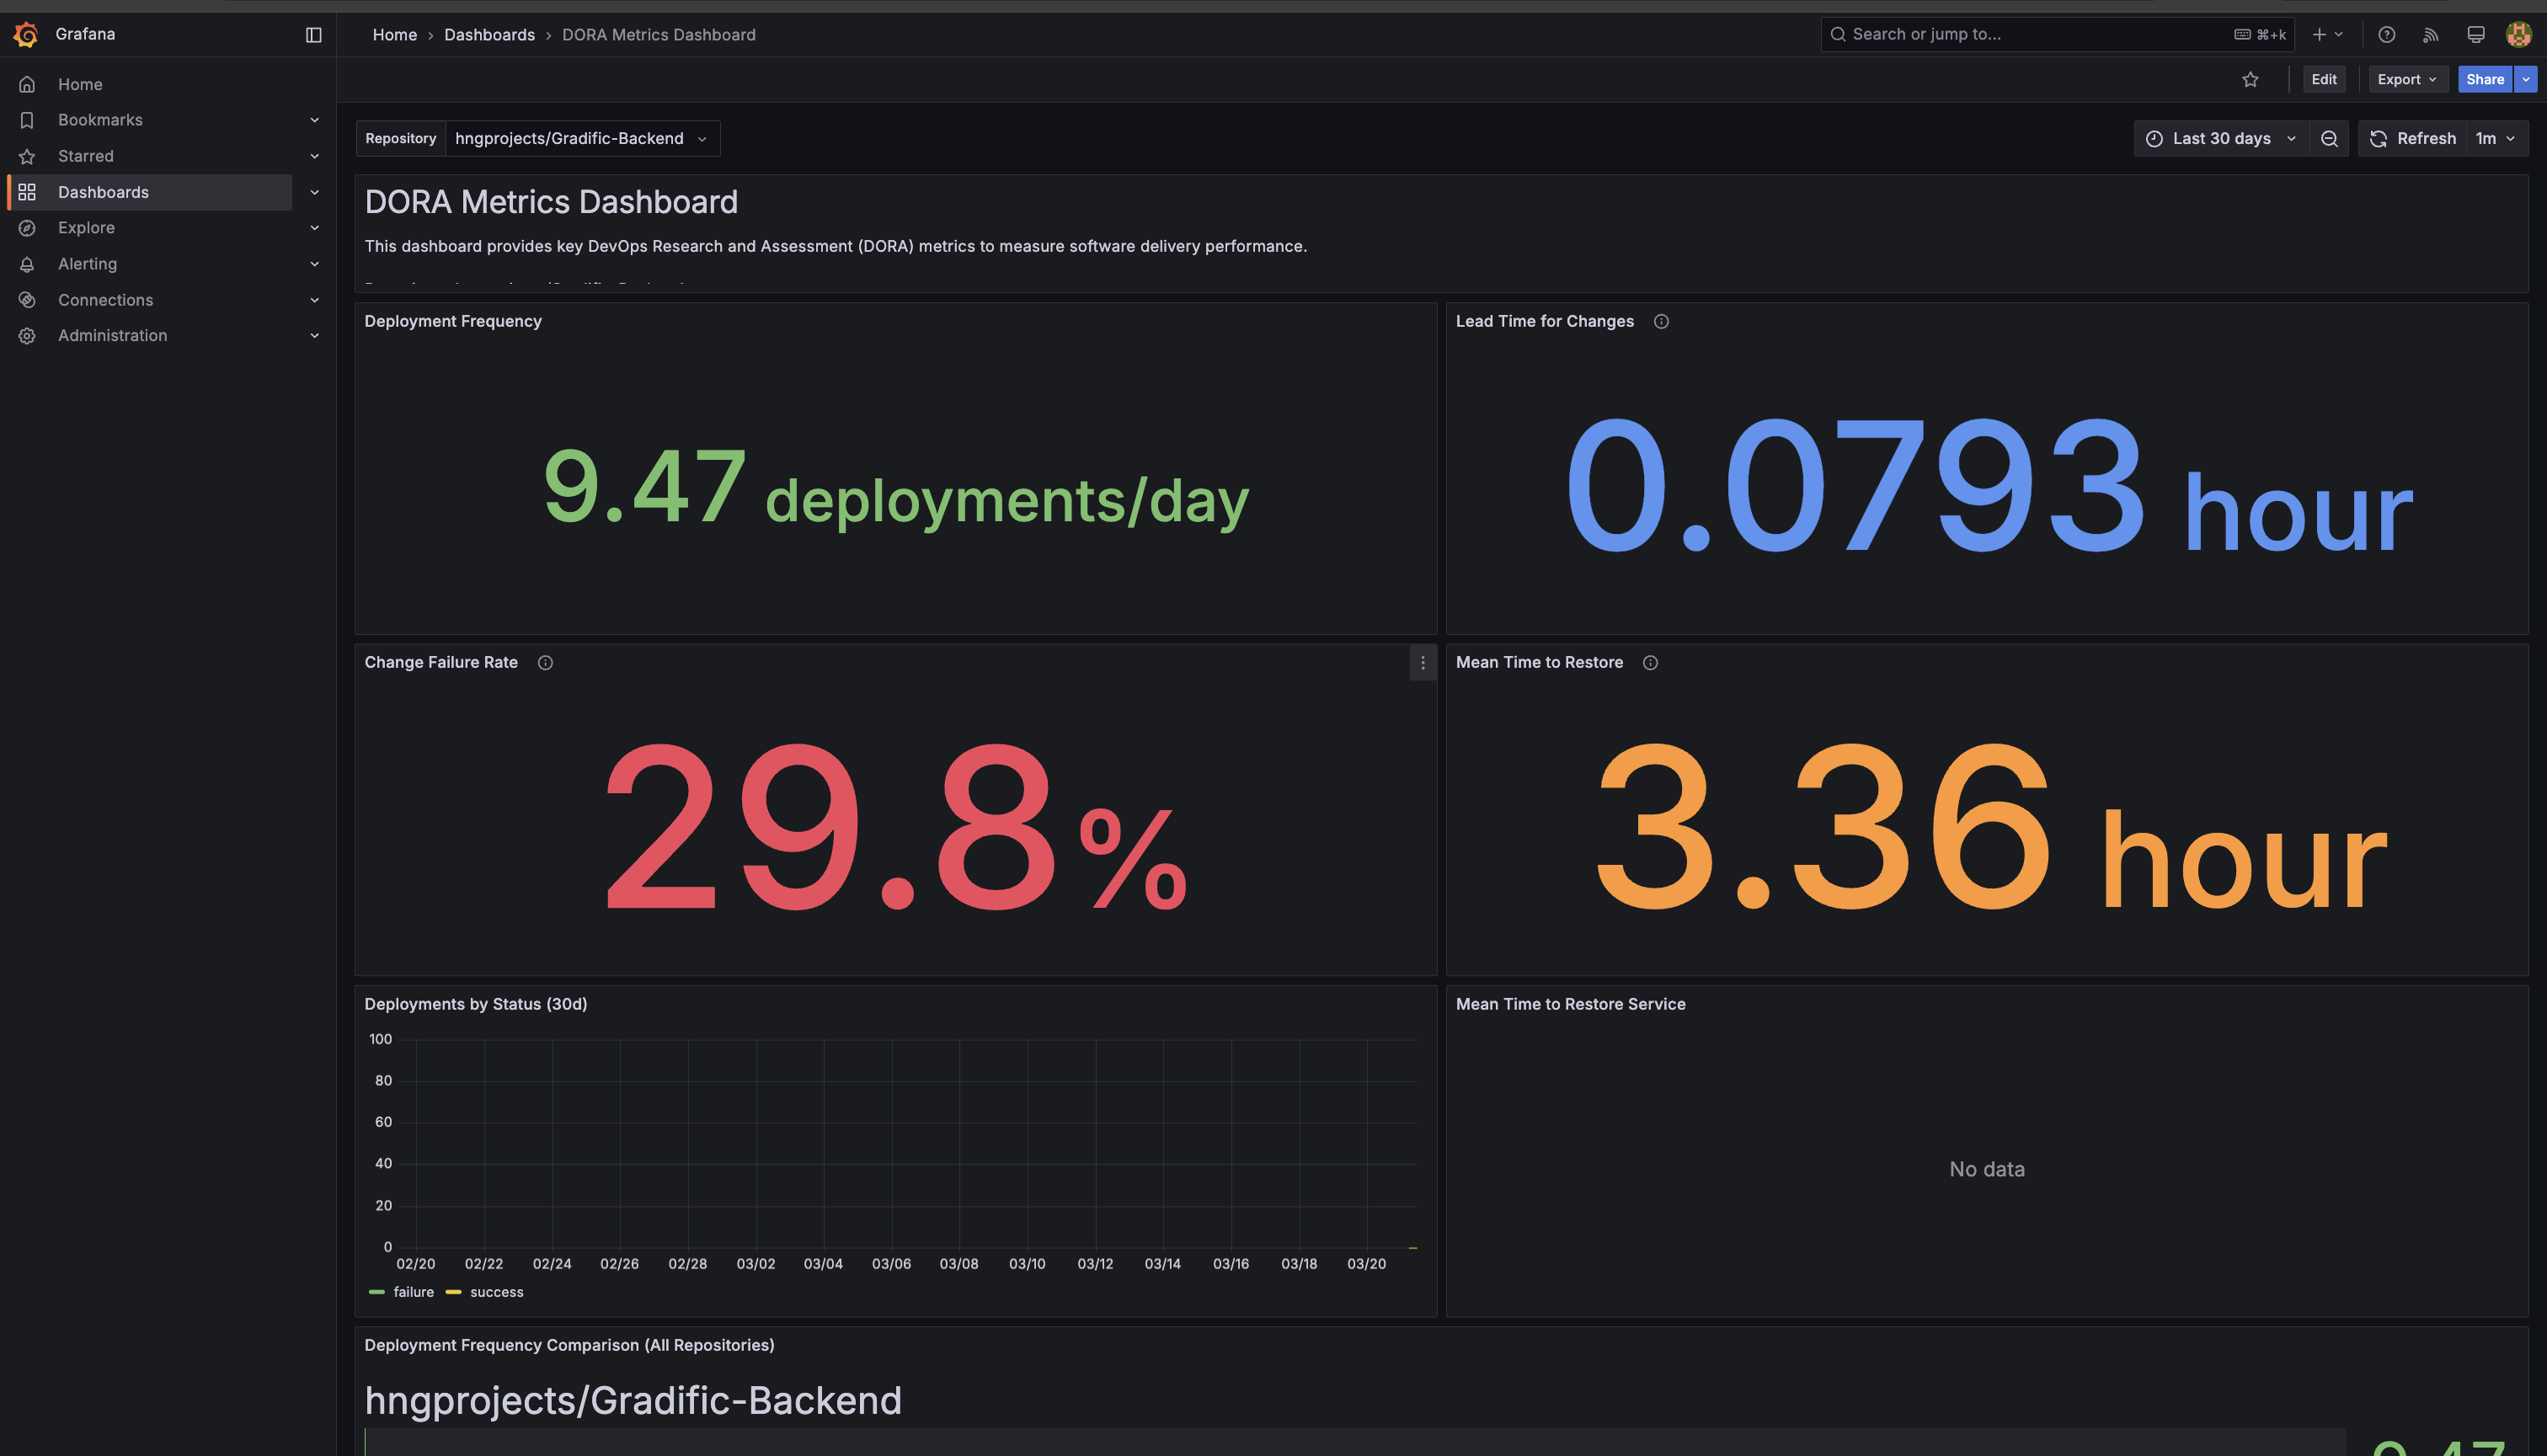
These metrics help you understand:
- How responsive your development process is
- How stable your changes are
- How quickly you can recover from failures
The alerts we've configured will notify you when these metrics fall outside healthy ranges, enabling continuous improvement of your development practices.
🔮 Conclusion: Building a Data-Driven Culture
Yipeee! You've successfully implemented a comprehensive monitoring solution that provides:
- Real-time visibility into system performance and availability
- Early warnings for potential issues
- Insights into your development practices
- Clear metrics for measuring improvements
By combining system monitoring with DORA metrics, you've created a foundation for a truly data-driven engineering culture. Use these insights to fuel your next improvements, and watch your team's effectiveness and your application's reliability grow together.
Till the next, happy building!