In today's complex software landscape, understanding what's happening inside your applications isn't just nice to have—it's essential. Enter SigNoz, an open-source APM (Application Performance Monitoring) tool that's changing how engineering teams approach observability. Let's dive into why **SigNoz **might be the missing piece in your tech stack and how it can transform your startup's operational efficiency.
The Observability Challenge in Modern Software Engineering 🔍
As applications grow more distributed and complex, traditional monitoring approaches fall short. Microservices, containerization, and cloud-native architectures have created intricate systems where pinpointing issues requires more than simple metric collection.
This is where observability platforms like SigNoz come in. Unlike conventional monitoring that tells you when something is wrong, observability tools help you understand why something is wrong—a critical distinction for fast-moving engineering teams.
What Makes SigNoz Stand Out? ⚡
SigNoz is an open-source alternative to proprietary APM solutions like Datadog **and **New Relic. Built on top of popular open-source projects like ClickHouse **and **OpenTelemetry, it offers:
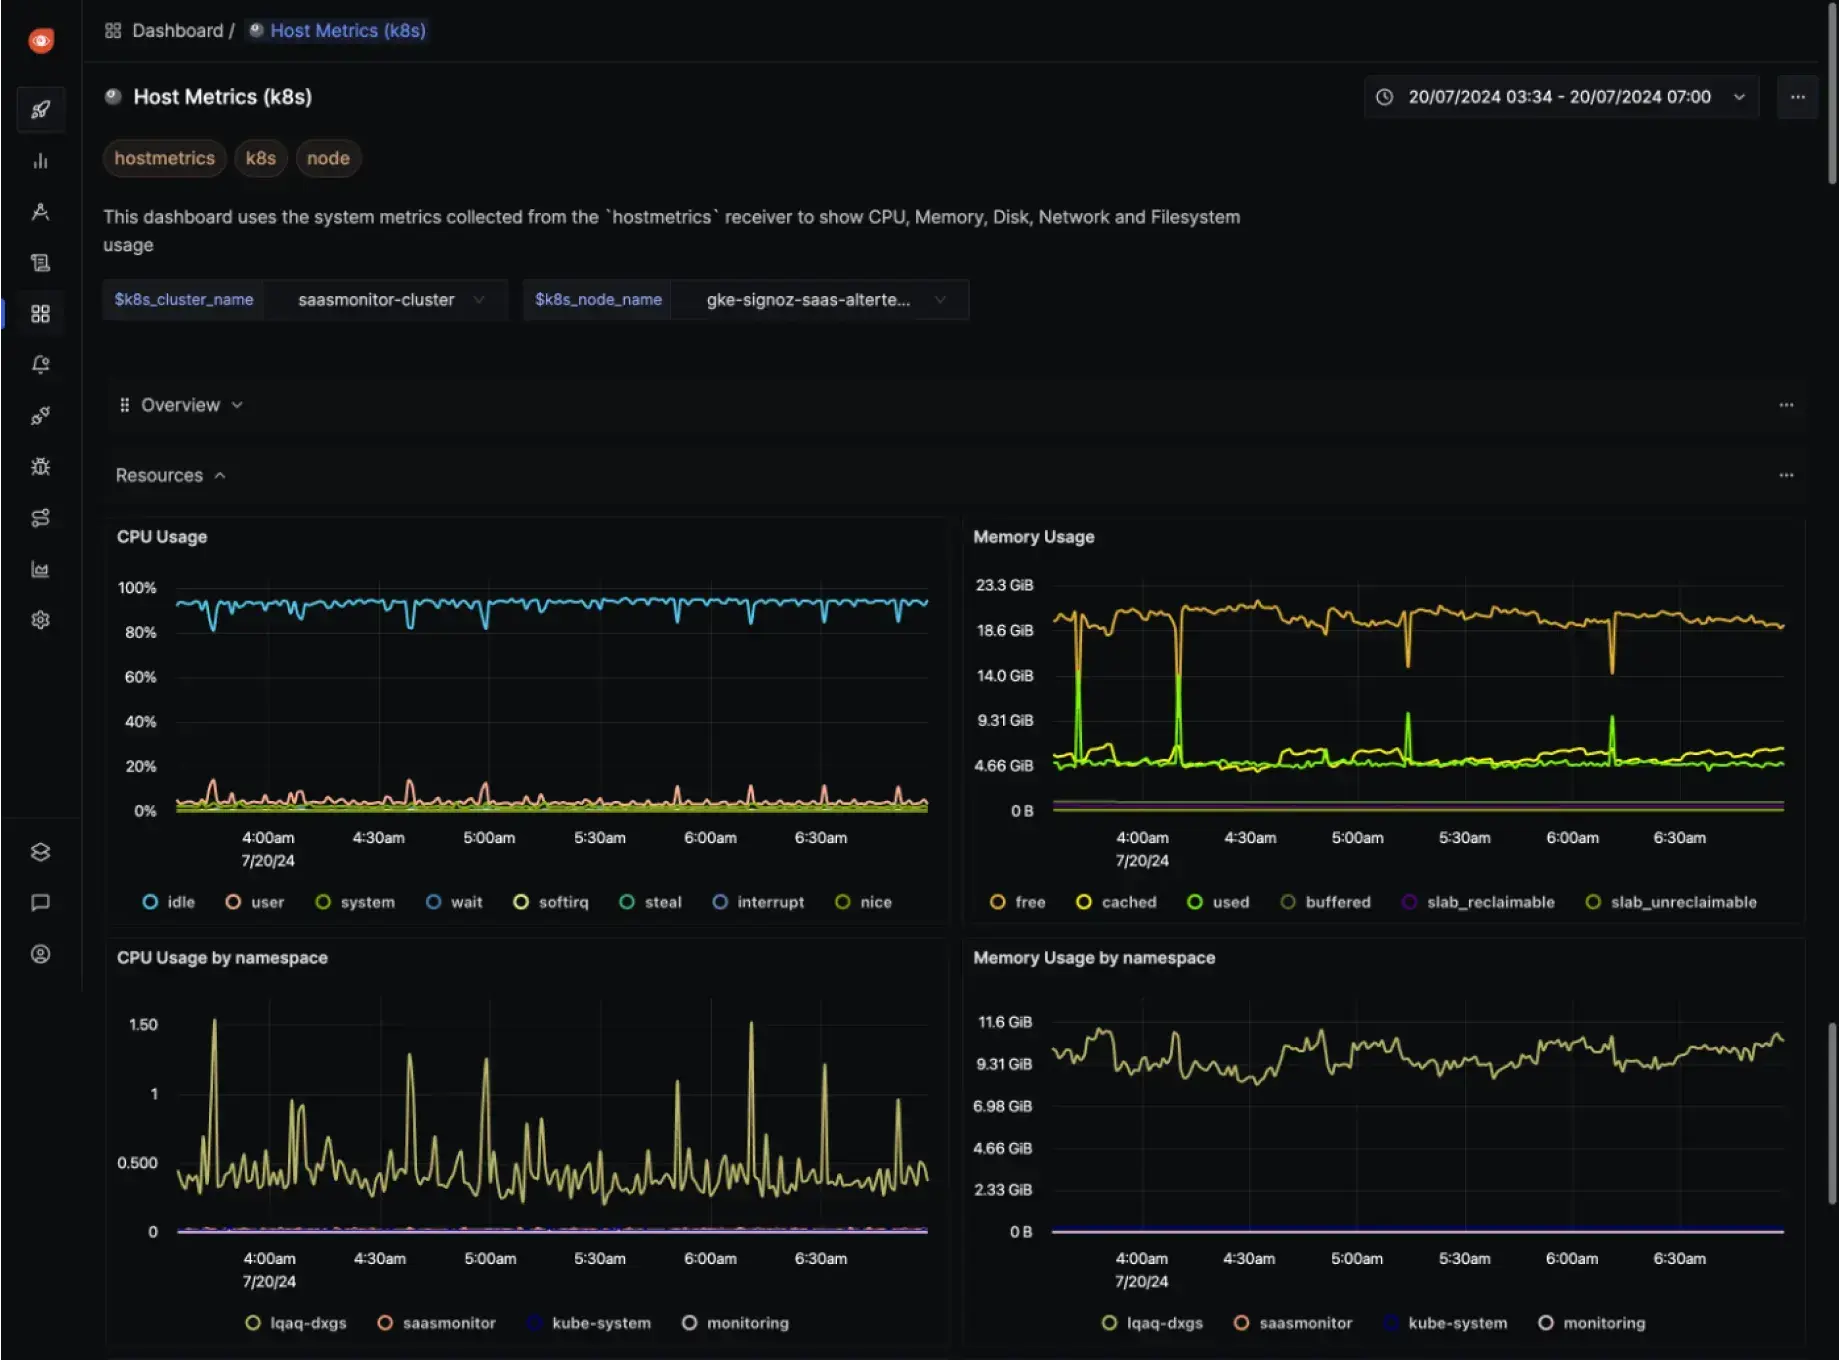
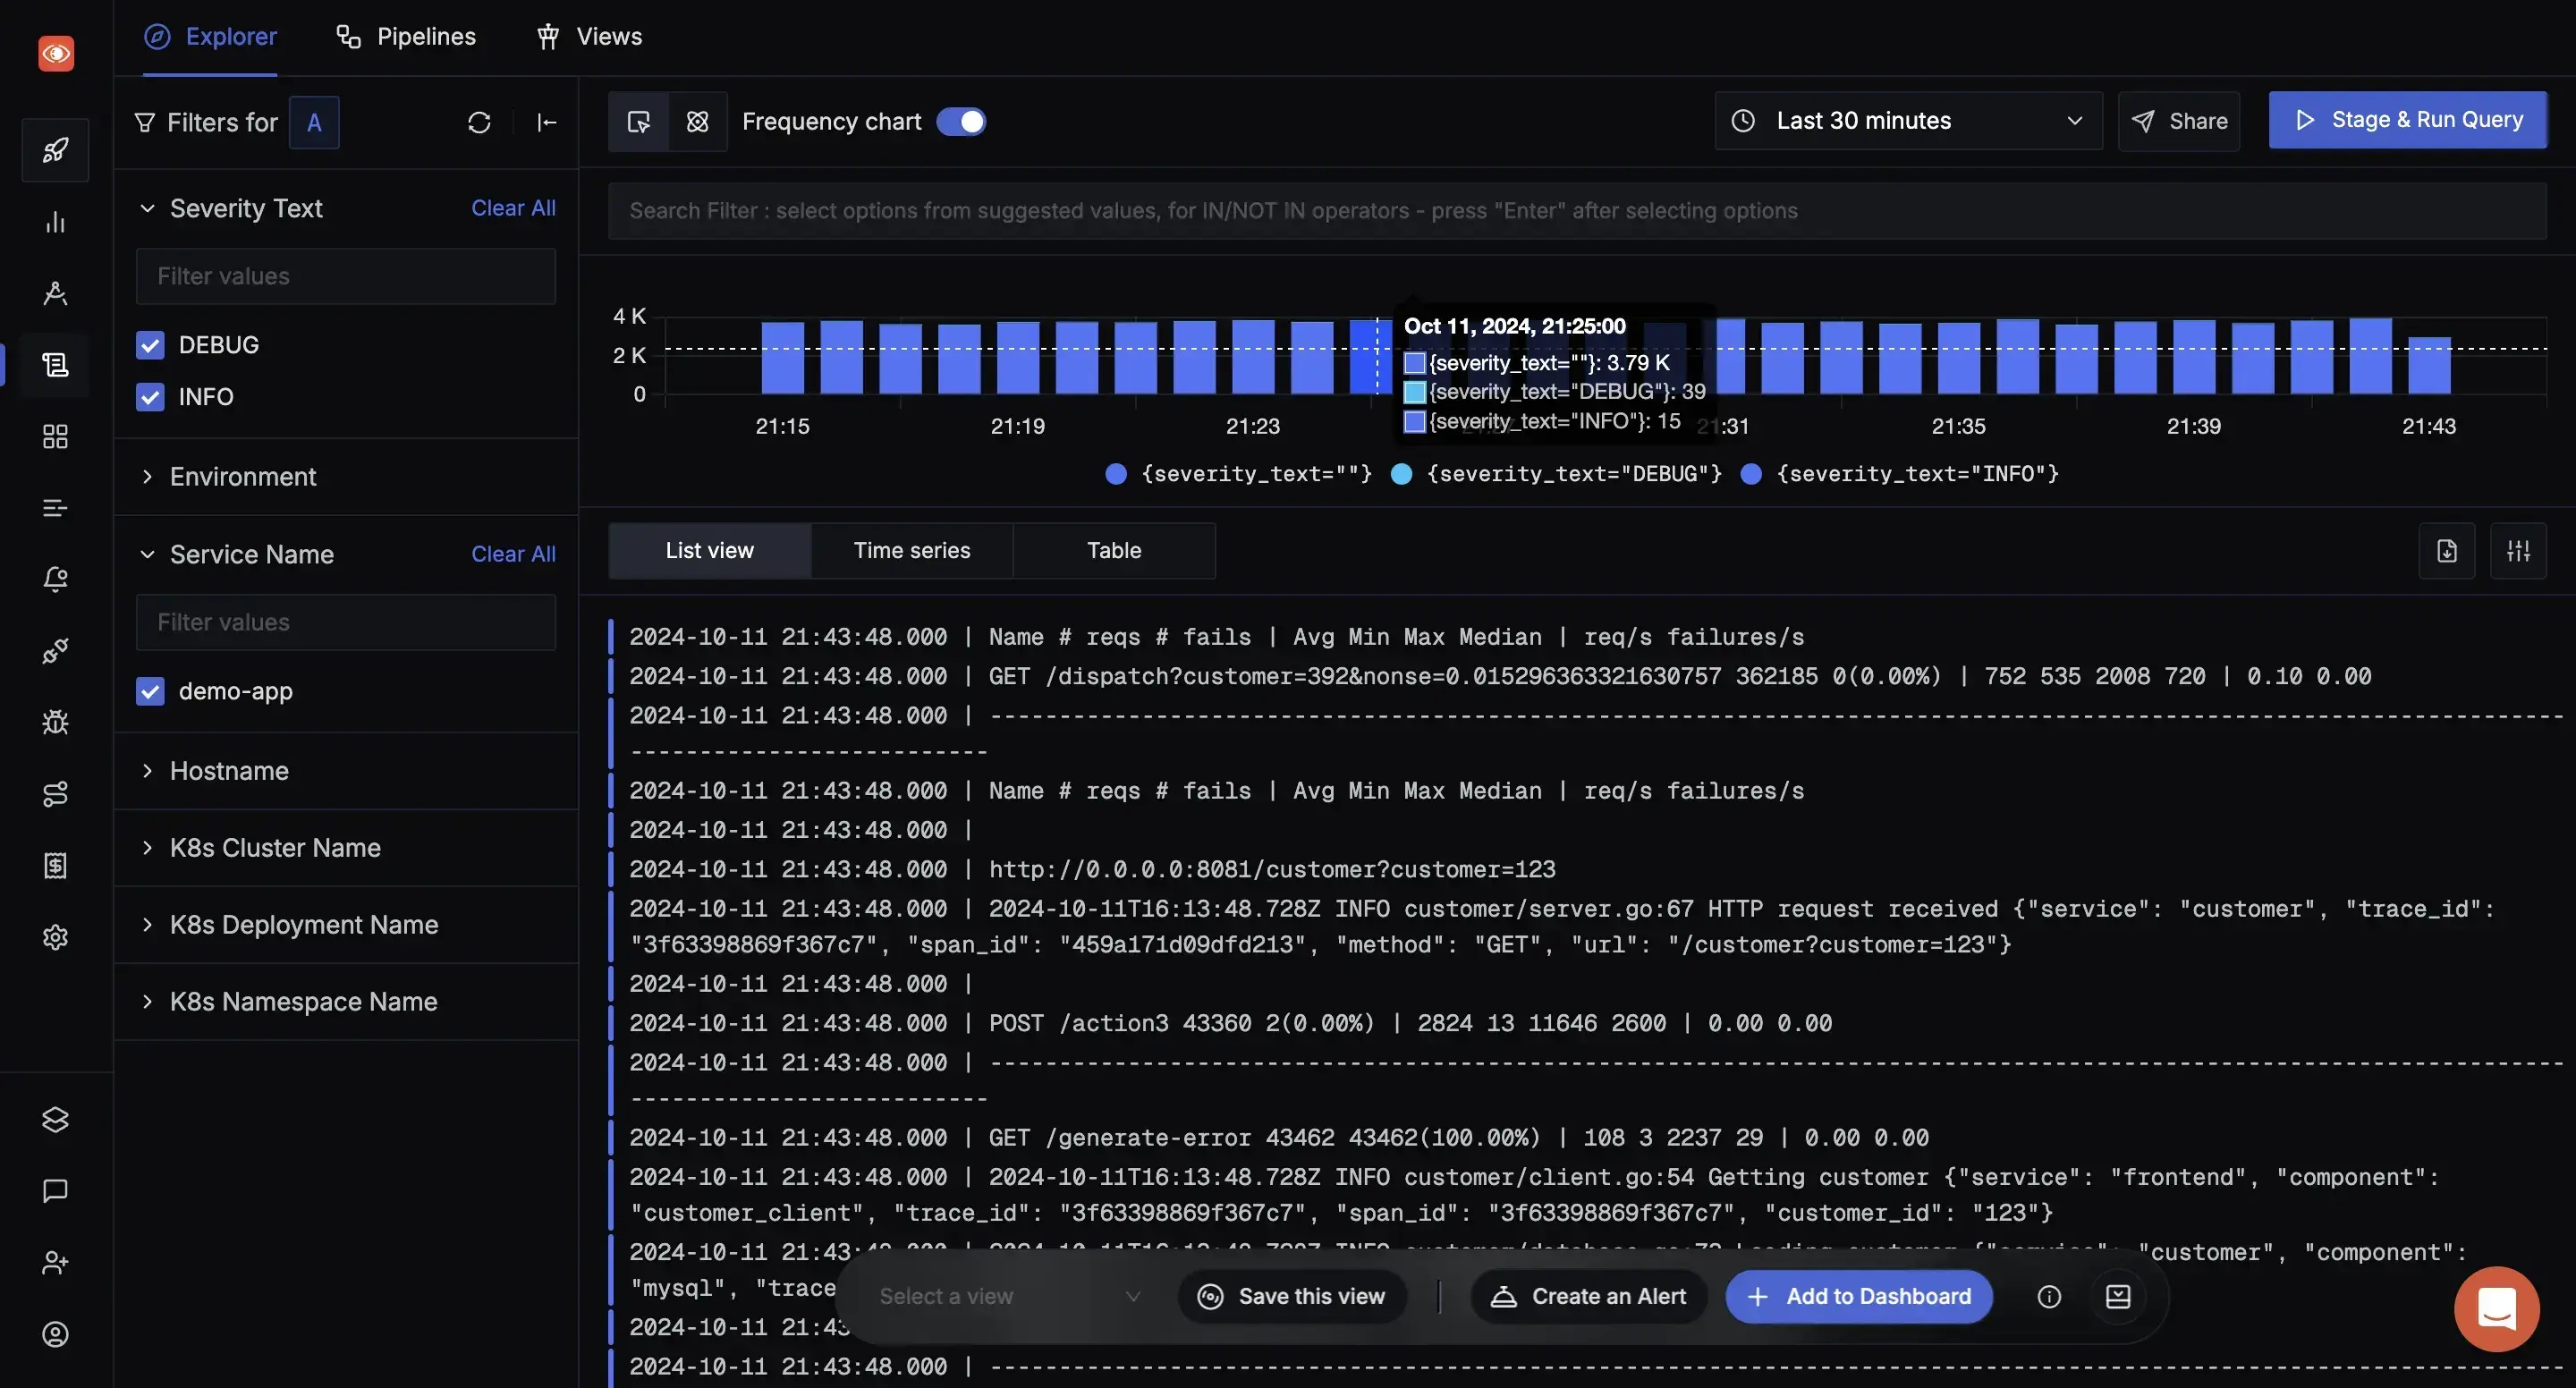
- Complete observability suite - metrics, traces, and logs all in one platform
- OpenTelemetry-native - built on the emerging industry standard for telemetry data
- Self-hosted control - maintain data sovereignty and reduce vendor lock-in
- Cost-effectiveness - eliminate per-seat or data volume pricing models
For engineering managers and tech leads, these features translate to faster issue resolution, better team collaboration, and significant cost savings.
Real-World Applications for Engineering Teams 💻
SigNoz addresses several critical use cases that directly impact development velocity and product reliability:
Performance Optimization
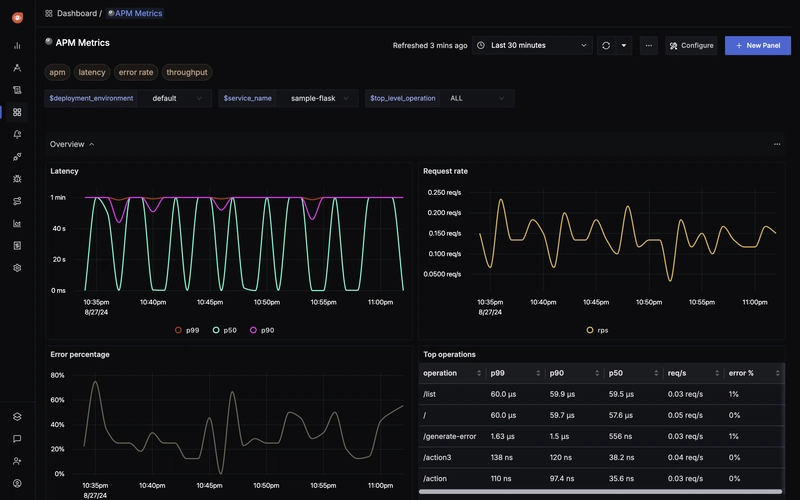
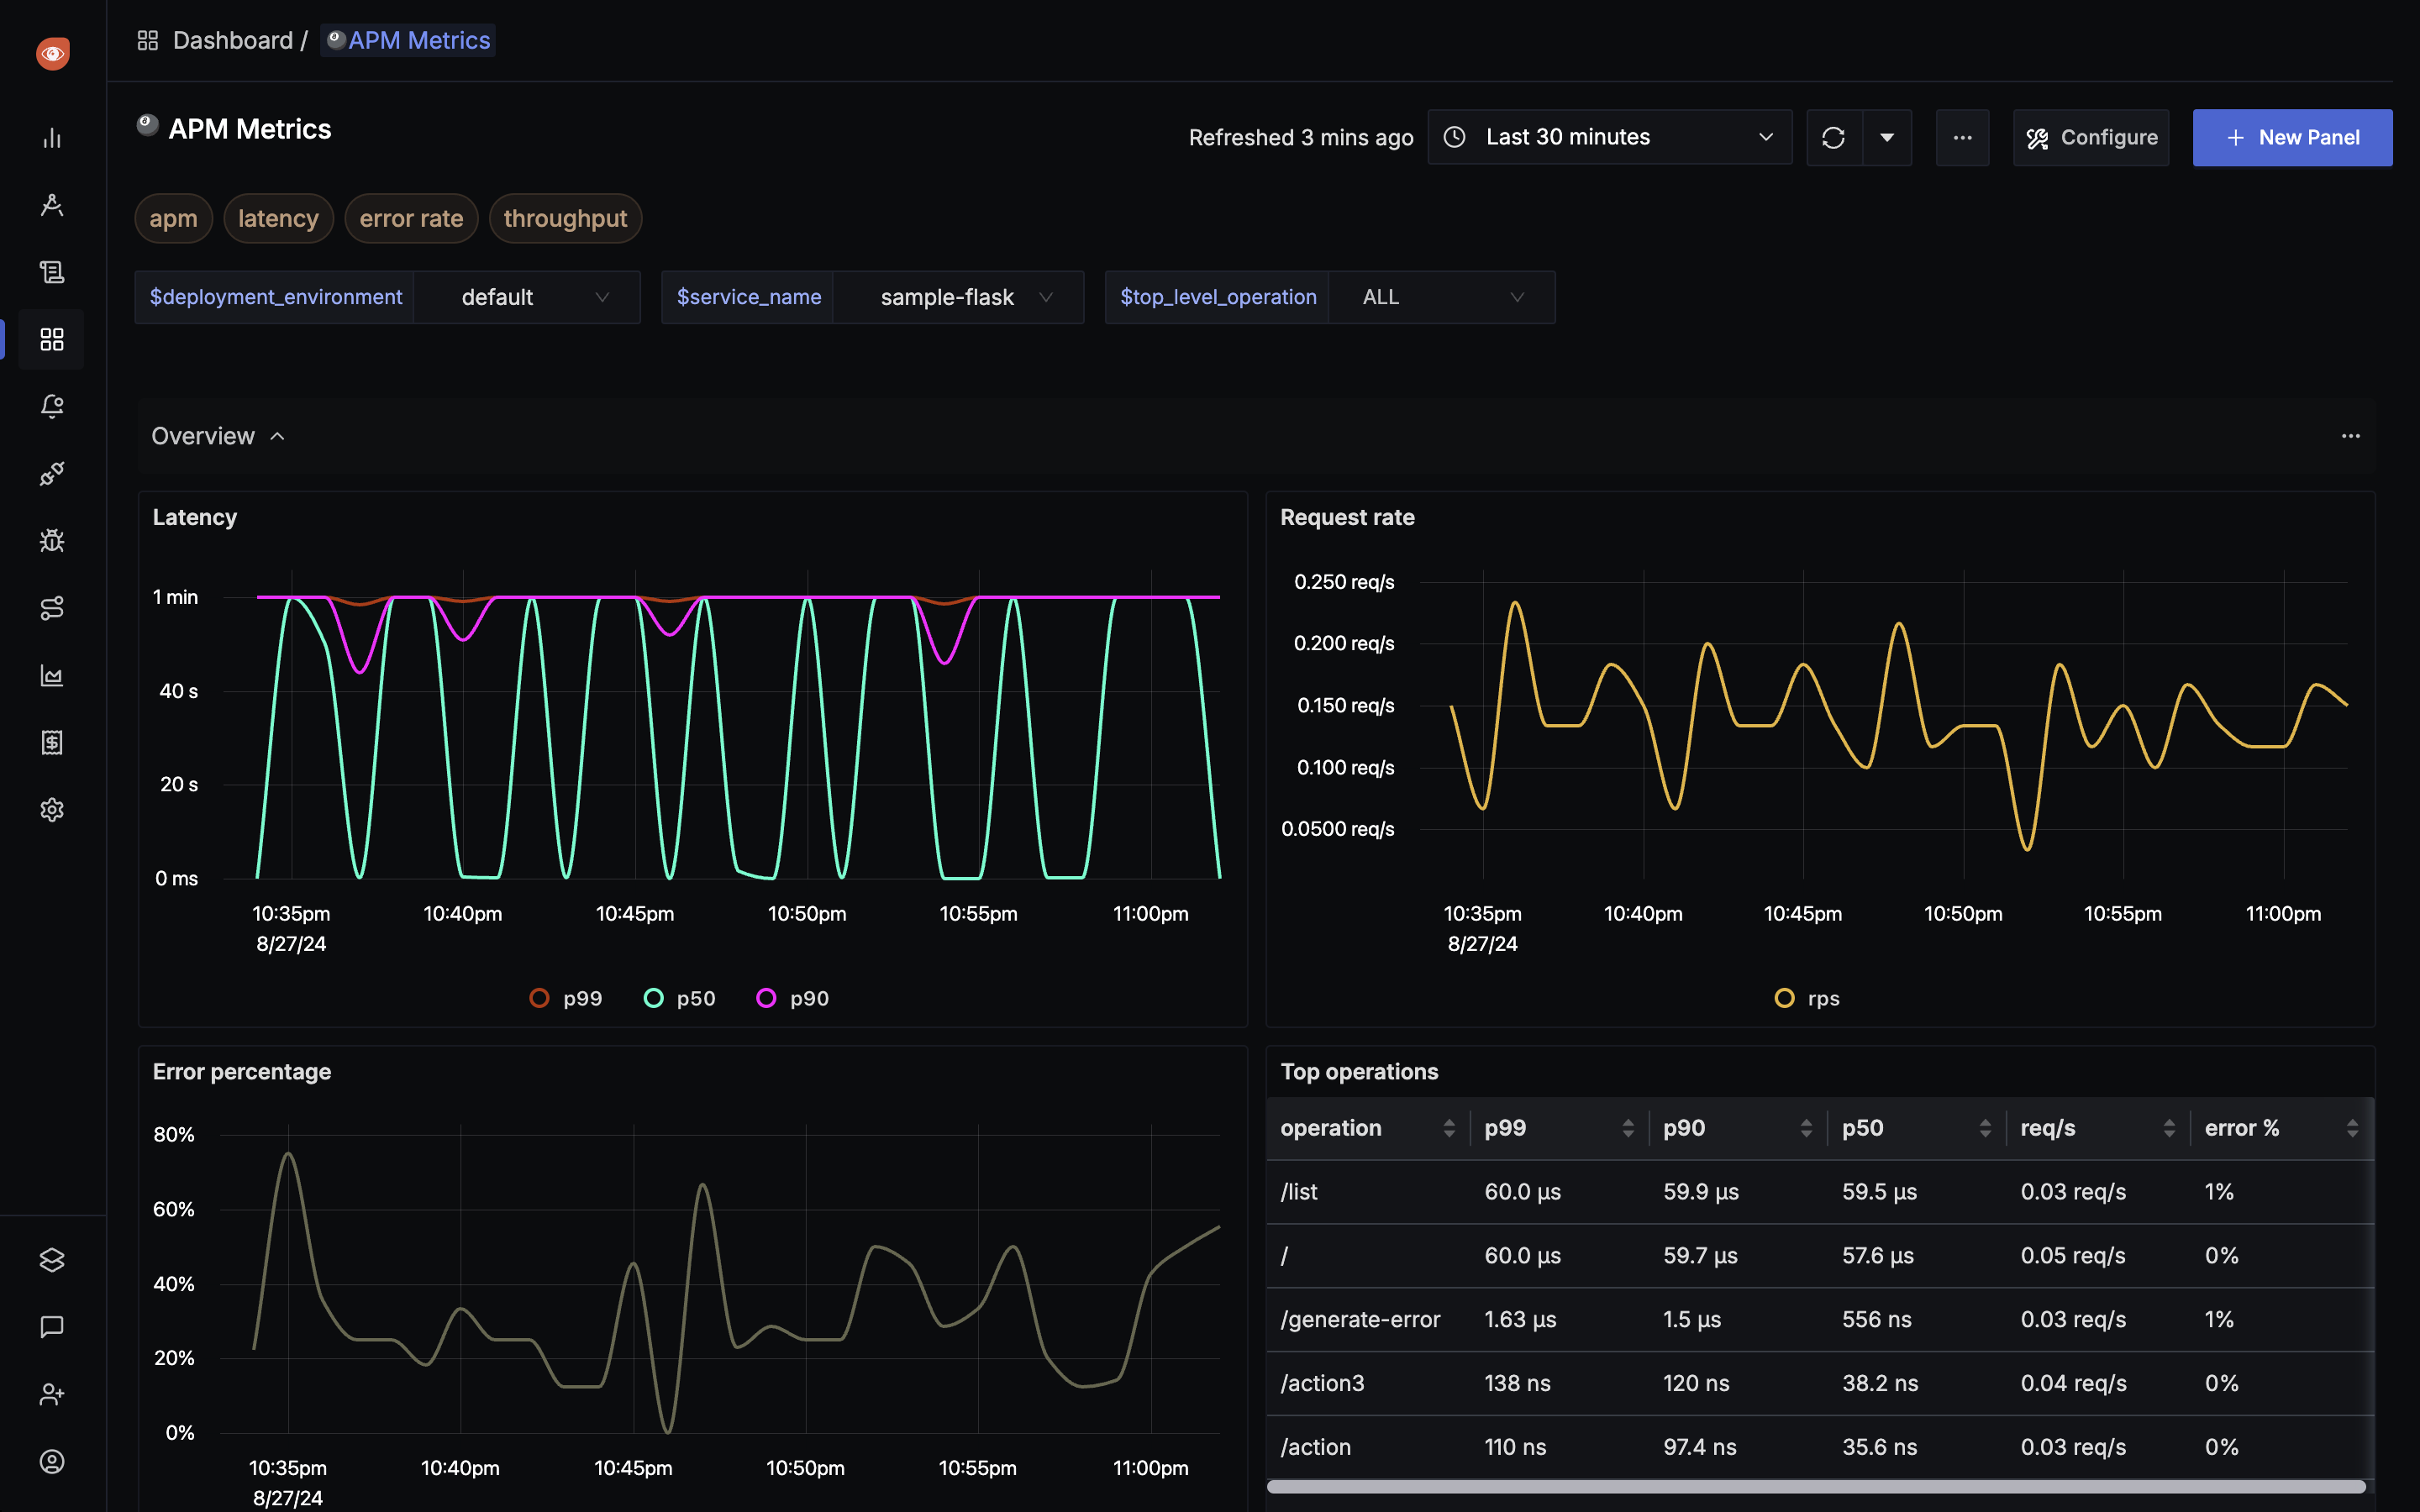
With distributed tracing capabilities, engineers can identify bottlenecks across service boundaries. The flame graph visualizations make it easy to spot which components are causing latency issues—whether it's slow database queries, external API calls, or inefficient algorithms.
Error Detection and Root Cause Analysis
When errors occur, SigNoz provides context around what happened. Engineers can correlate spikes in error rates with deployment events, configuration changes, or unusual traffic patterns. The ability to drill down from high-level metrics to individual request traces drastically reduces debugging time.
Service Level Objective (SLO) Monitoring
For companies focused on reliability, SigNoz enables teams to define and track SLOs that matter to their business. Rather than reactive firefighting, teams can proactively monitor error budgets and ensure their services meet customer expectations.
How SigNoz Empowers Startup Engineering Teams 🚀
Accelerated Debugging Workflows
The time between identifying an issue and resolving it significantly impacts productivity. SigNoz reduces this window by providing engineers with rich context about application behavior. This means less time spent reproducing issues and more time building features.
Improved Cross-Team Collaboration
When platform, frontend, and backend teams share the same observability tool, collaboration improves. Product managers can reference the same dashboards as engineers when discussing performance issues, creating a common language around system behavior.
Data-Driven Engineering Decisions
With comprehensive performance data at their fingertips, engineering leaders can make informed decisions about where to invest optimization efforts. This means prioritizing work that delivers the greatest customer impact rather than following hunches.
Getting Started with SigNoz 🛠️
SigNoz can be deployed using Docker or Kubernetes, with comprehensive documentation available for both approaches. The OpenTelemetry instrumentation libraries support all major programming languages (Java, Python, JavaScript, Go, etc.), making it accessible regardless of your tech stack.
For startups considering SigNoz, here's a quick implementation roadmap:
- Deploy the SigNoz backend using Docker Compose or Kubernetes
- Instrument your applications with OpenTelemetry SDKs
- Configure basic dashboards for key services
- Set up alerts for critical performance thresholds
- Gradually expand observability coverage across your stack
The Business Case for Comprehensive Observability 💰
Beyond the technical benefits, SigNoz offers compelling business advantages:
Reduced Mean Time to Resolution (MTTR)
When issues arise, teams with proper observability tools resolve them faster. For customer-facing applications, this directly impacts user satisfaction and retention.
Lower Total Cost of Ownership
As a self-hosted solution, SigNoz eliminates the expensive per-gigabyte or per-host pricing models of commercial APM tools. This becomes increasingly valuable as your data volumes grow.
Enhanced Developer Experience
Engineers with access to quality observability tools report higher job satisfaction and productivity. In today's competitive hiring market, tooling that empowers developers becomes a retention advantage.
Conclusion: Observability as a Competitive Advantage ✨
For companies looking to move fast without breaking things, investing in observability infrastructure pays dividends. SigNoz offers a compelling package: open-source flexibility, enterprise-grade features, and a growing community of contributors.
As software continues to eat the world, the teams that can understand and optimize their systems will have an edge. SigNoz provides that visibility without the enterprise price tag, making comprehensive observability accessible to teams of all sizes.
💬 If you found this guide helpful, feel free to share or leave a comment!
🔗 Connect with me online:
👨💻 Prateek Agrawal
NTWIST Inc. | Ex - Innodata Inc.
🚀 Full Stack Developer (MERN, Next.js, TS, DevOps) | Build scalable apps, optimize APIs & automate CI/CD with Docker & Kubernetes 💻
prateek-bka (Prateek Agrawal) · GitHub
🚀 Full Stack Developer (MERN, Next.js, TS, DevOps) | Build scalable apps, optimize APIs & automate CI/CD with Docker & Kubernetes 💻 - prateek-bka
 github.com
