
It was only a few weeks ago that over 32,000 cloud practitioners from all over the world came together in Las Vegas to attend Google Cloud Next 2025. Beyond the keynotes, the workshops, and the multiple jam-packed tracks of talks and sessions, an entire expo hall offered attendees the opportunity to observe or play around with more than 500 live demos. Let’s check out one of these demos!
Overview of the demo
The main goals of the Observability in Action demo were twofold. We wanted to showcase various ways of interacting with metrics and logs. And we wanted to give attendees a little bit of an interactive experience. For the interactive part of the demo, we utilized various oversized physical buttons and pedals that could be used to select answers or confirm inputs.
The flow of the demo was as followed:
- We ask the attendee to type in a prompt that they wanted sent to an AI model.
- The prompt was sent in the background to three different models: Gemma 3 on Cloud Run, Gemini 2.0 Flash on Vertex AI, and Gemini 2.0 Flash-Lite on Vertex AI. This generated logs and metrics.
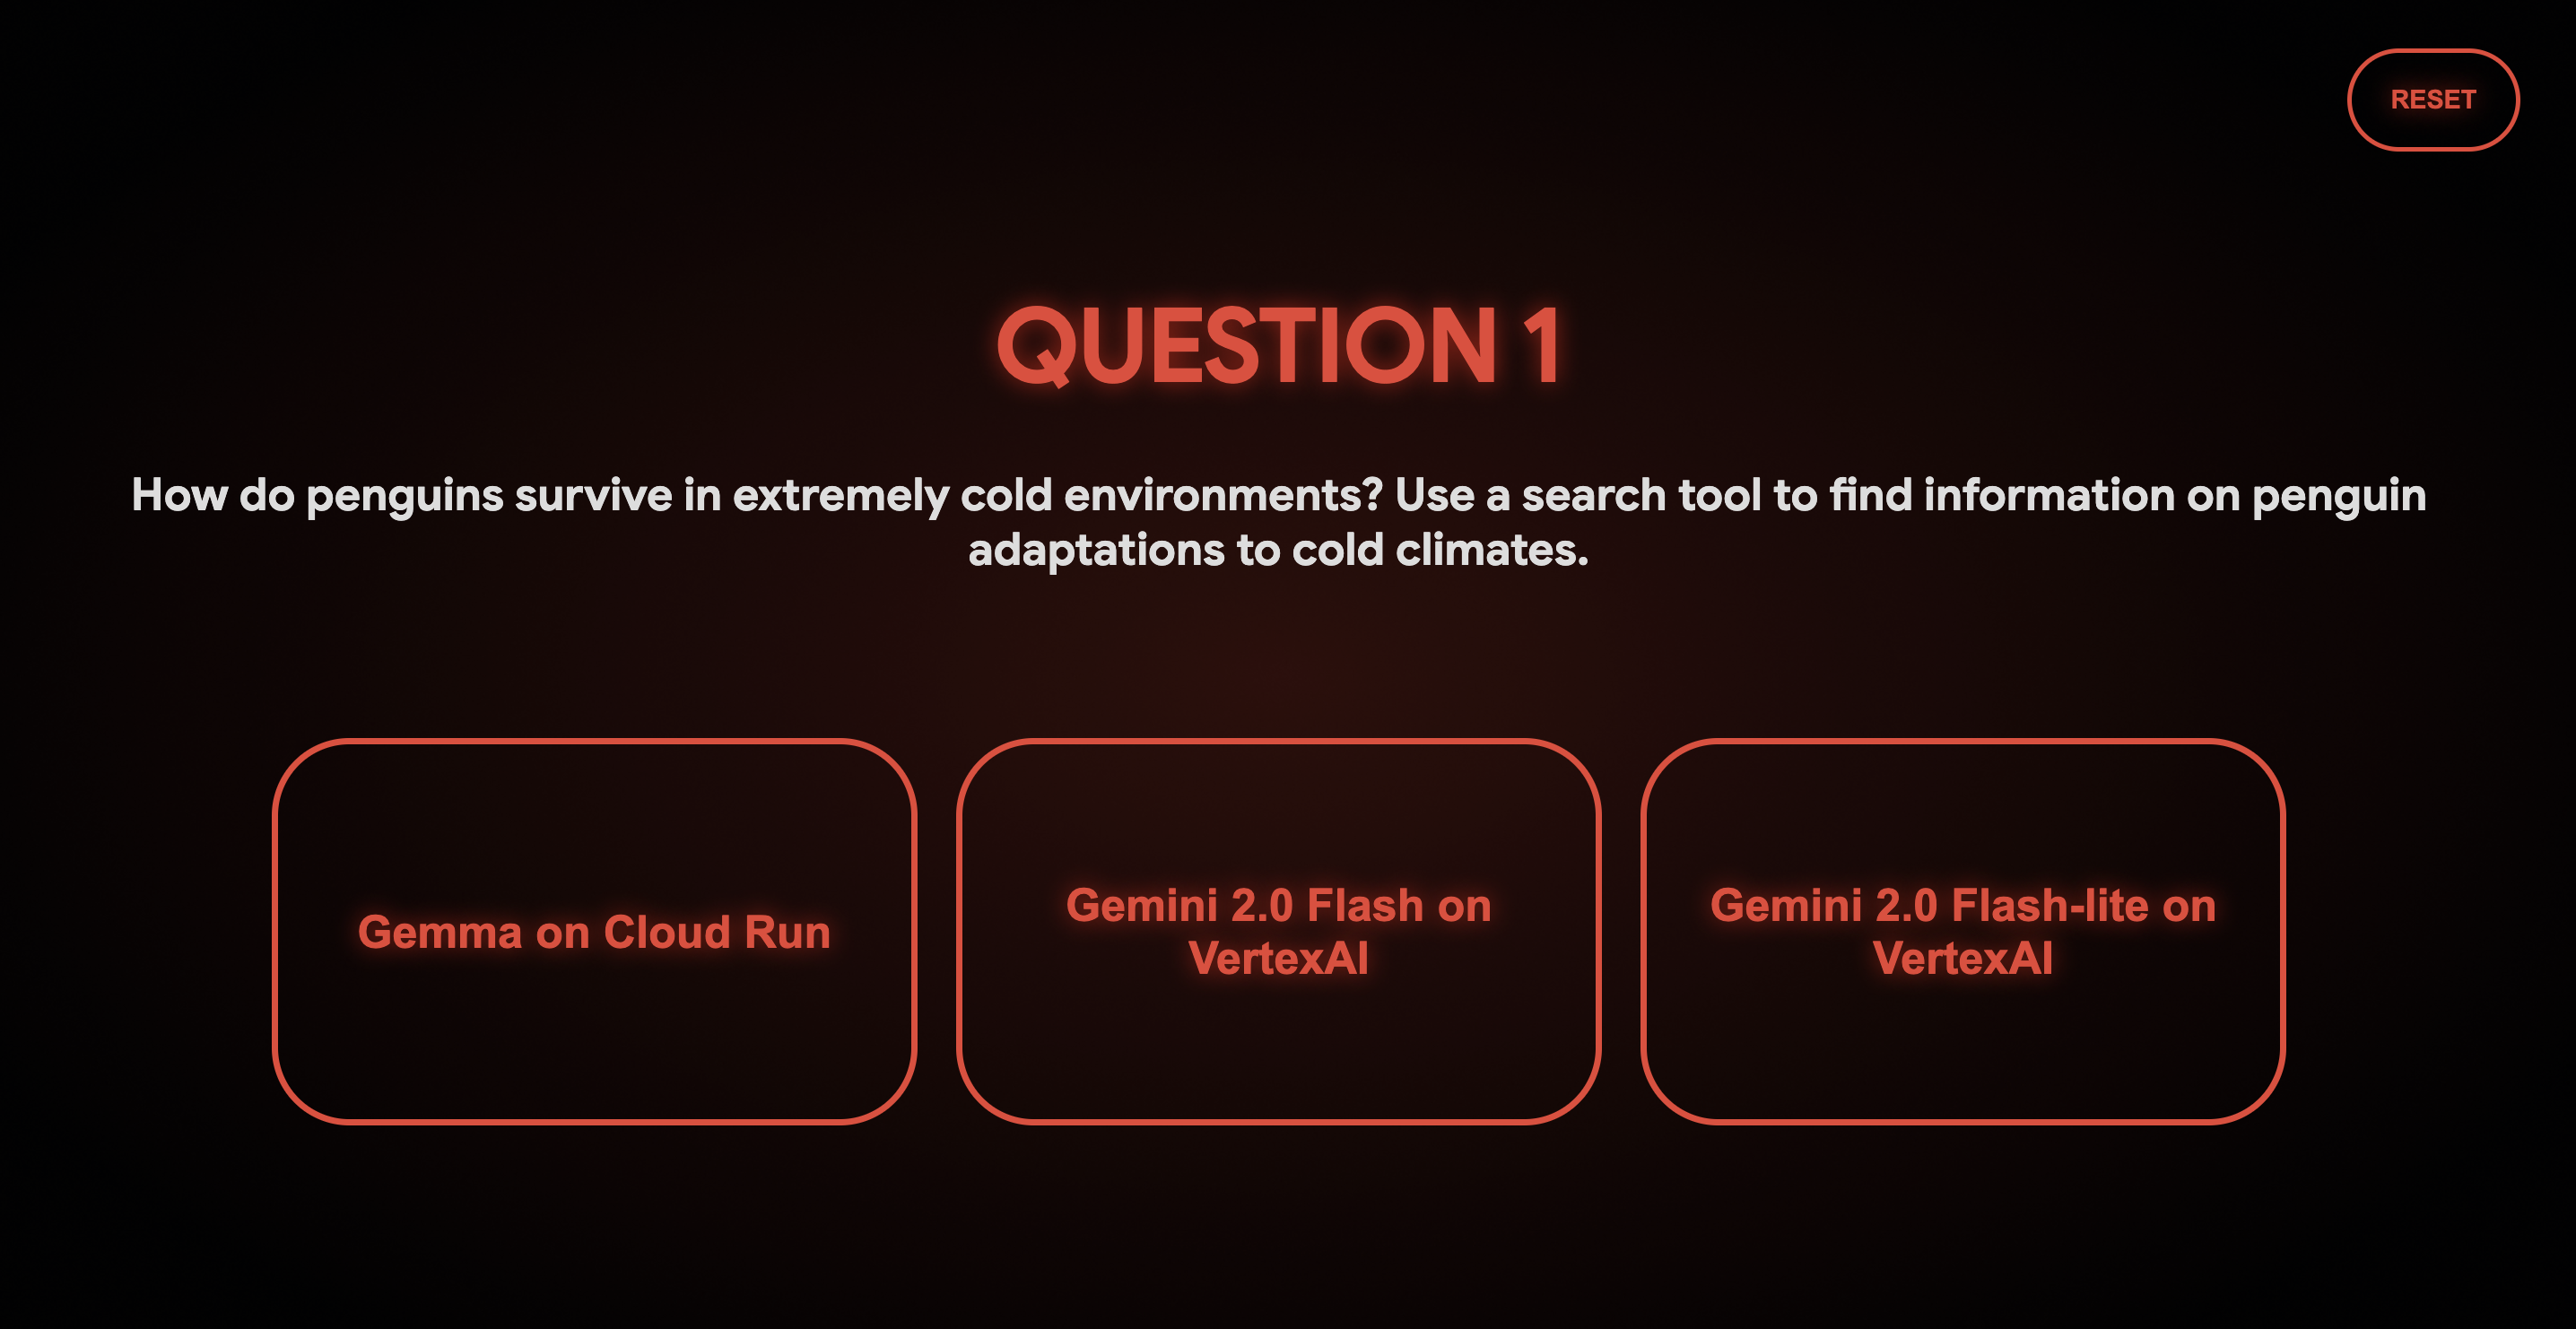
- The attendee was then given a short quiz about these three models. Each quiz input also generated logs and metrics.
- At the end of the quiz, we give the attendee a rundown of their answers, and then flip over to the Google Cloud Console.
- In Cloud Monitoring, we showcase the various native metrics that Cloud Run offers, custom metrics implemented using OpenTelemetry, as well as the Cloud Trace functionality.
- Finally, we turn to BigQuery to showcase how we can mirror logs to a database for further analysis using Jupyter Notebooks.
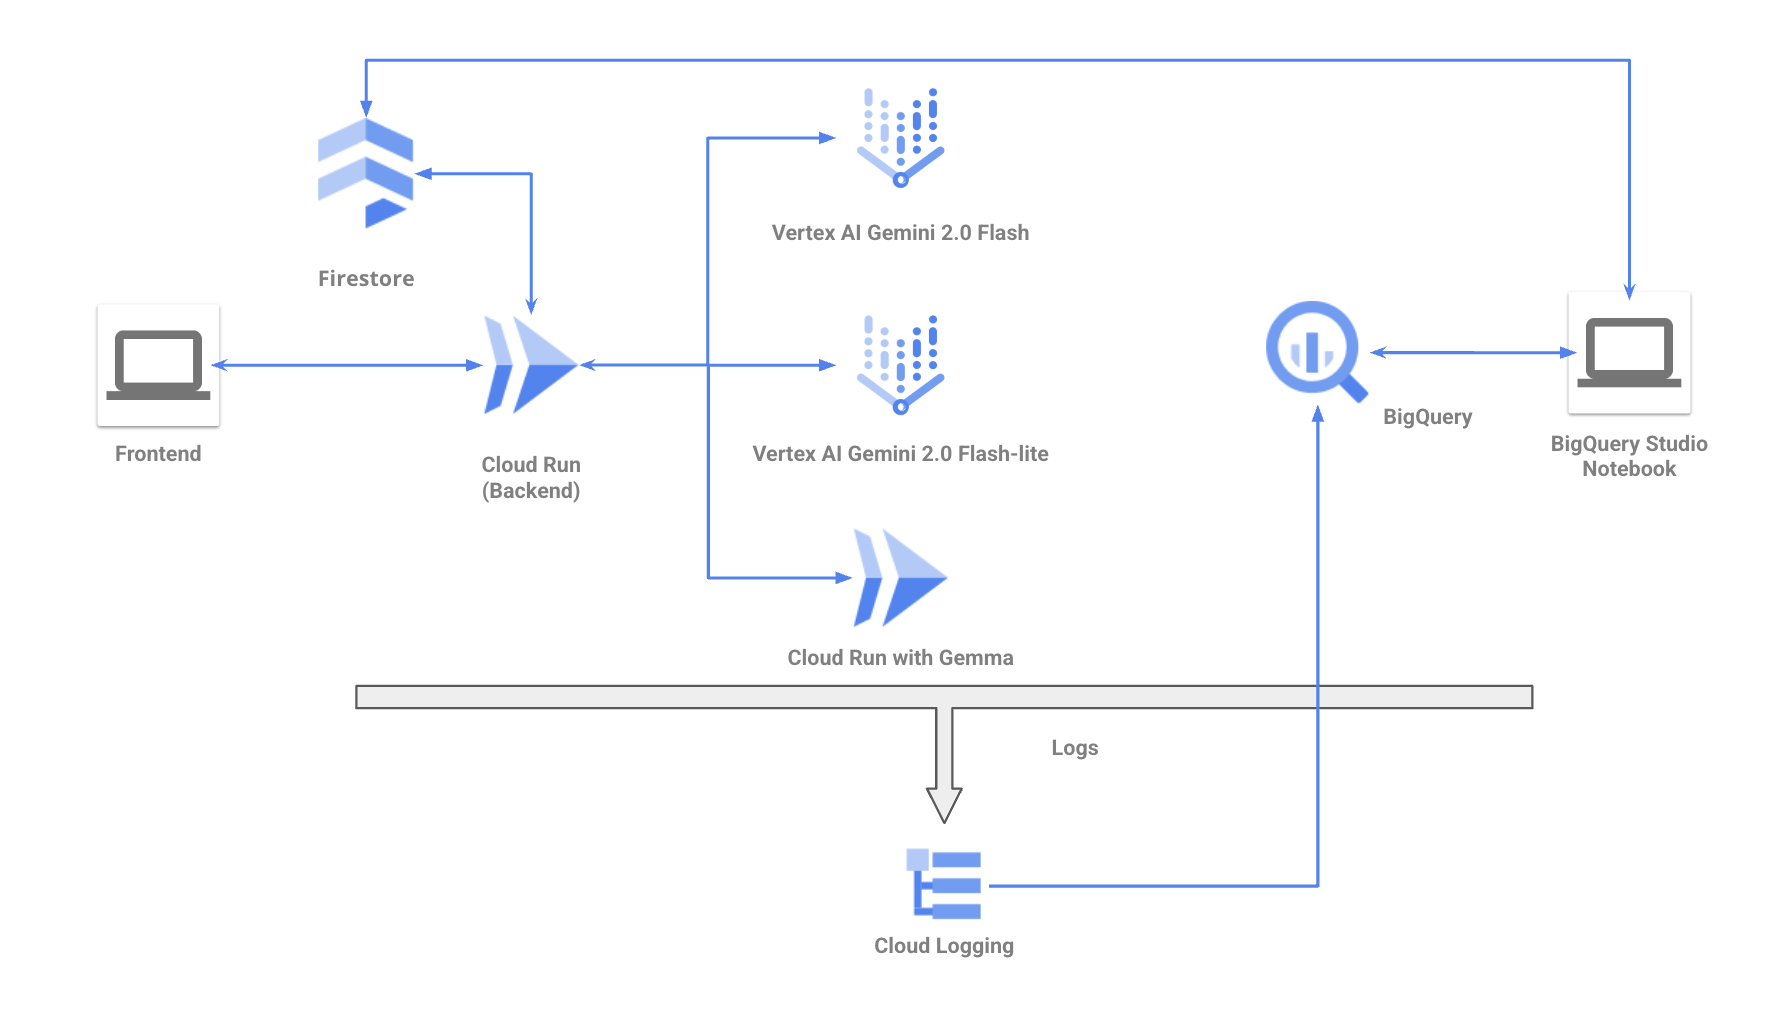
Architecture
While the demo frontend runs locally, the backend is deployed as a Cloud Run instance. This instance is then talking to Gemini through the Vertex AI SDK and to Gemma through its own Cloud Run instance. The persistent state of the demo resides in a Firestore database. All Cloud Run logs are mirrored to BigQuery using a simple sink.
Visualizing metrics using Cloud Monitoring
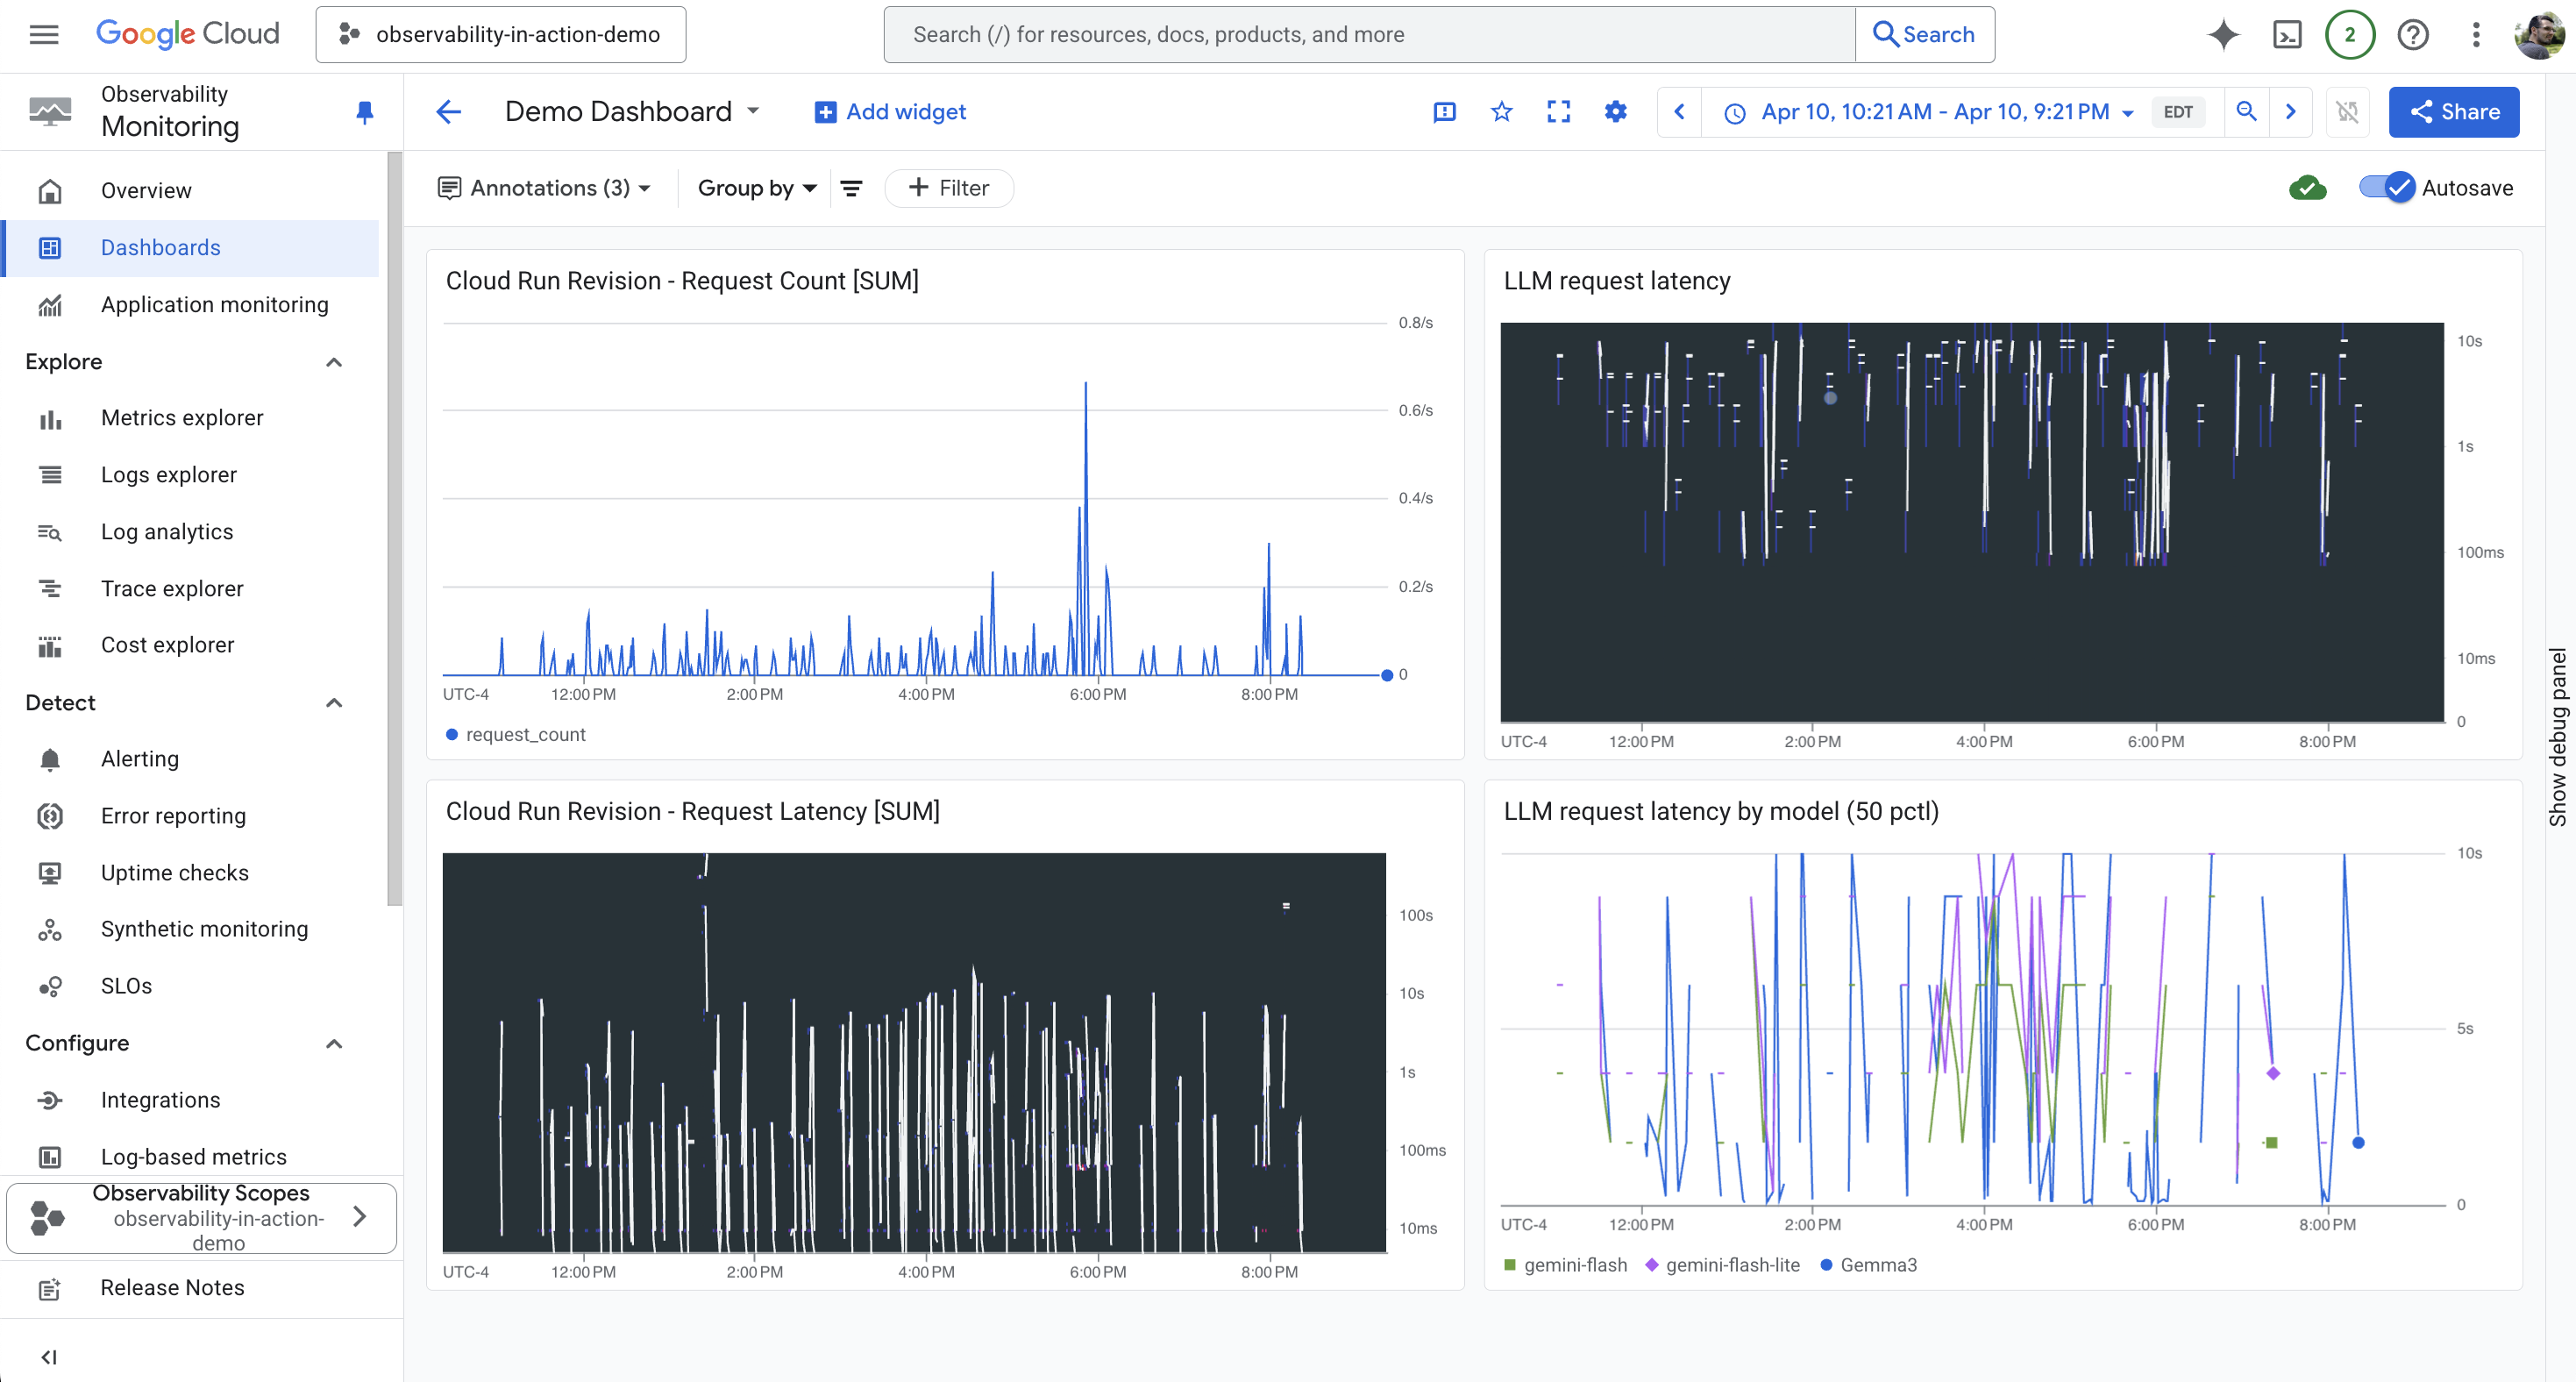
Cloud Monitoring provides visibility into the performance and health of your cloud applications and infrastructure. It collects metrics, events, and metadata from Google Cloud services and other sources, allowing you to visualize this data on dashboards and create alerts for critical issues. This is useful for proactively identifying and resolving problems, optimizing resource utilization, improving uptime, and understanding system behavior, ultimately leading to more reliable and cost-effective applications.
For services like Cloud Run which we’re using for the backend of this demo, Cloud Monitoring automatically collects a wide array of native metrics without any setup needed. This includes data points such as request latency, count, container CPU and memory usage, and instance counts. This out-of-the-box integration means developers get immediate insights into their serverless application's performance and resource consumption, simplifying troubleshooting and optimization efforts.
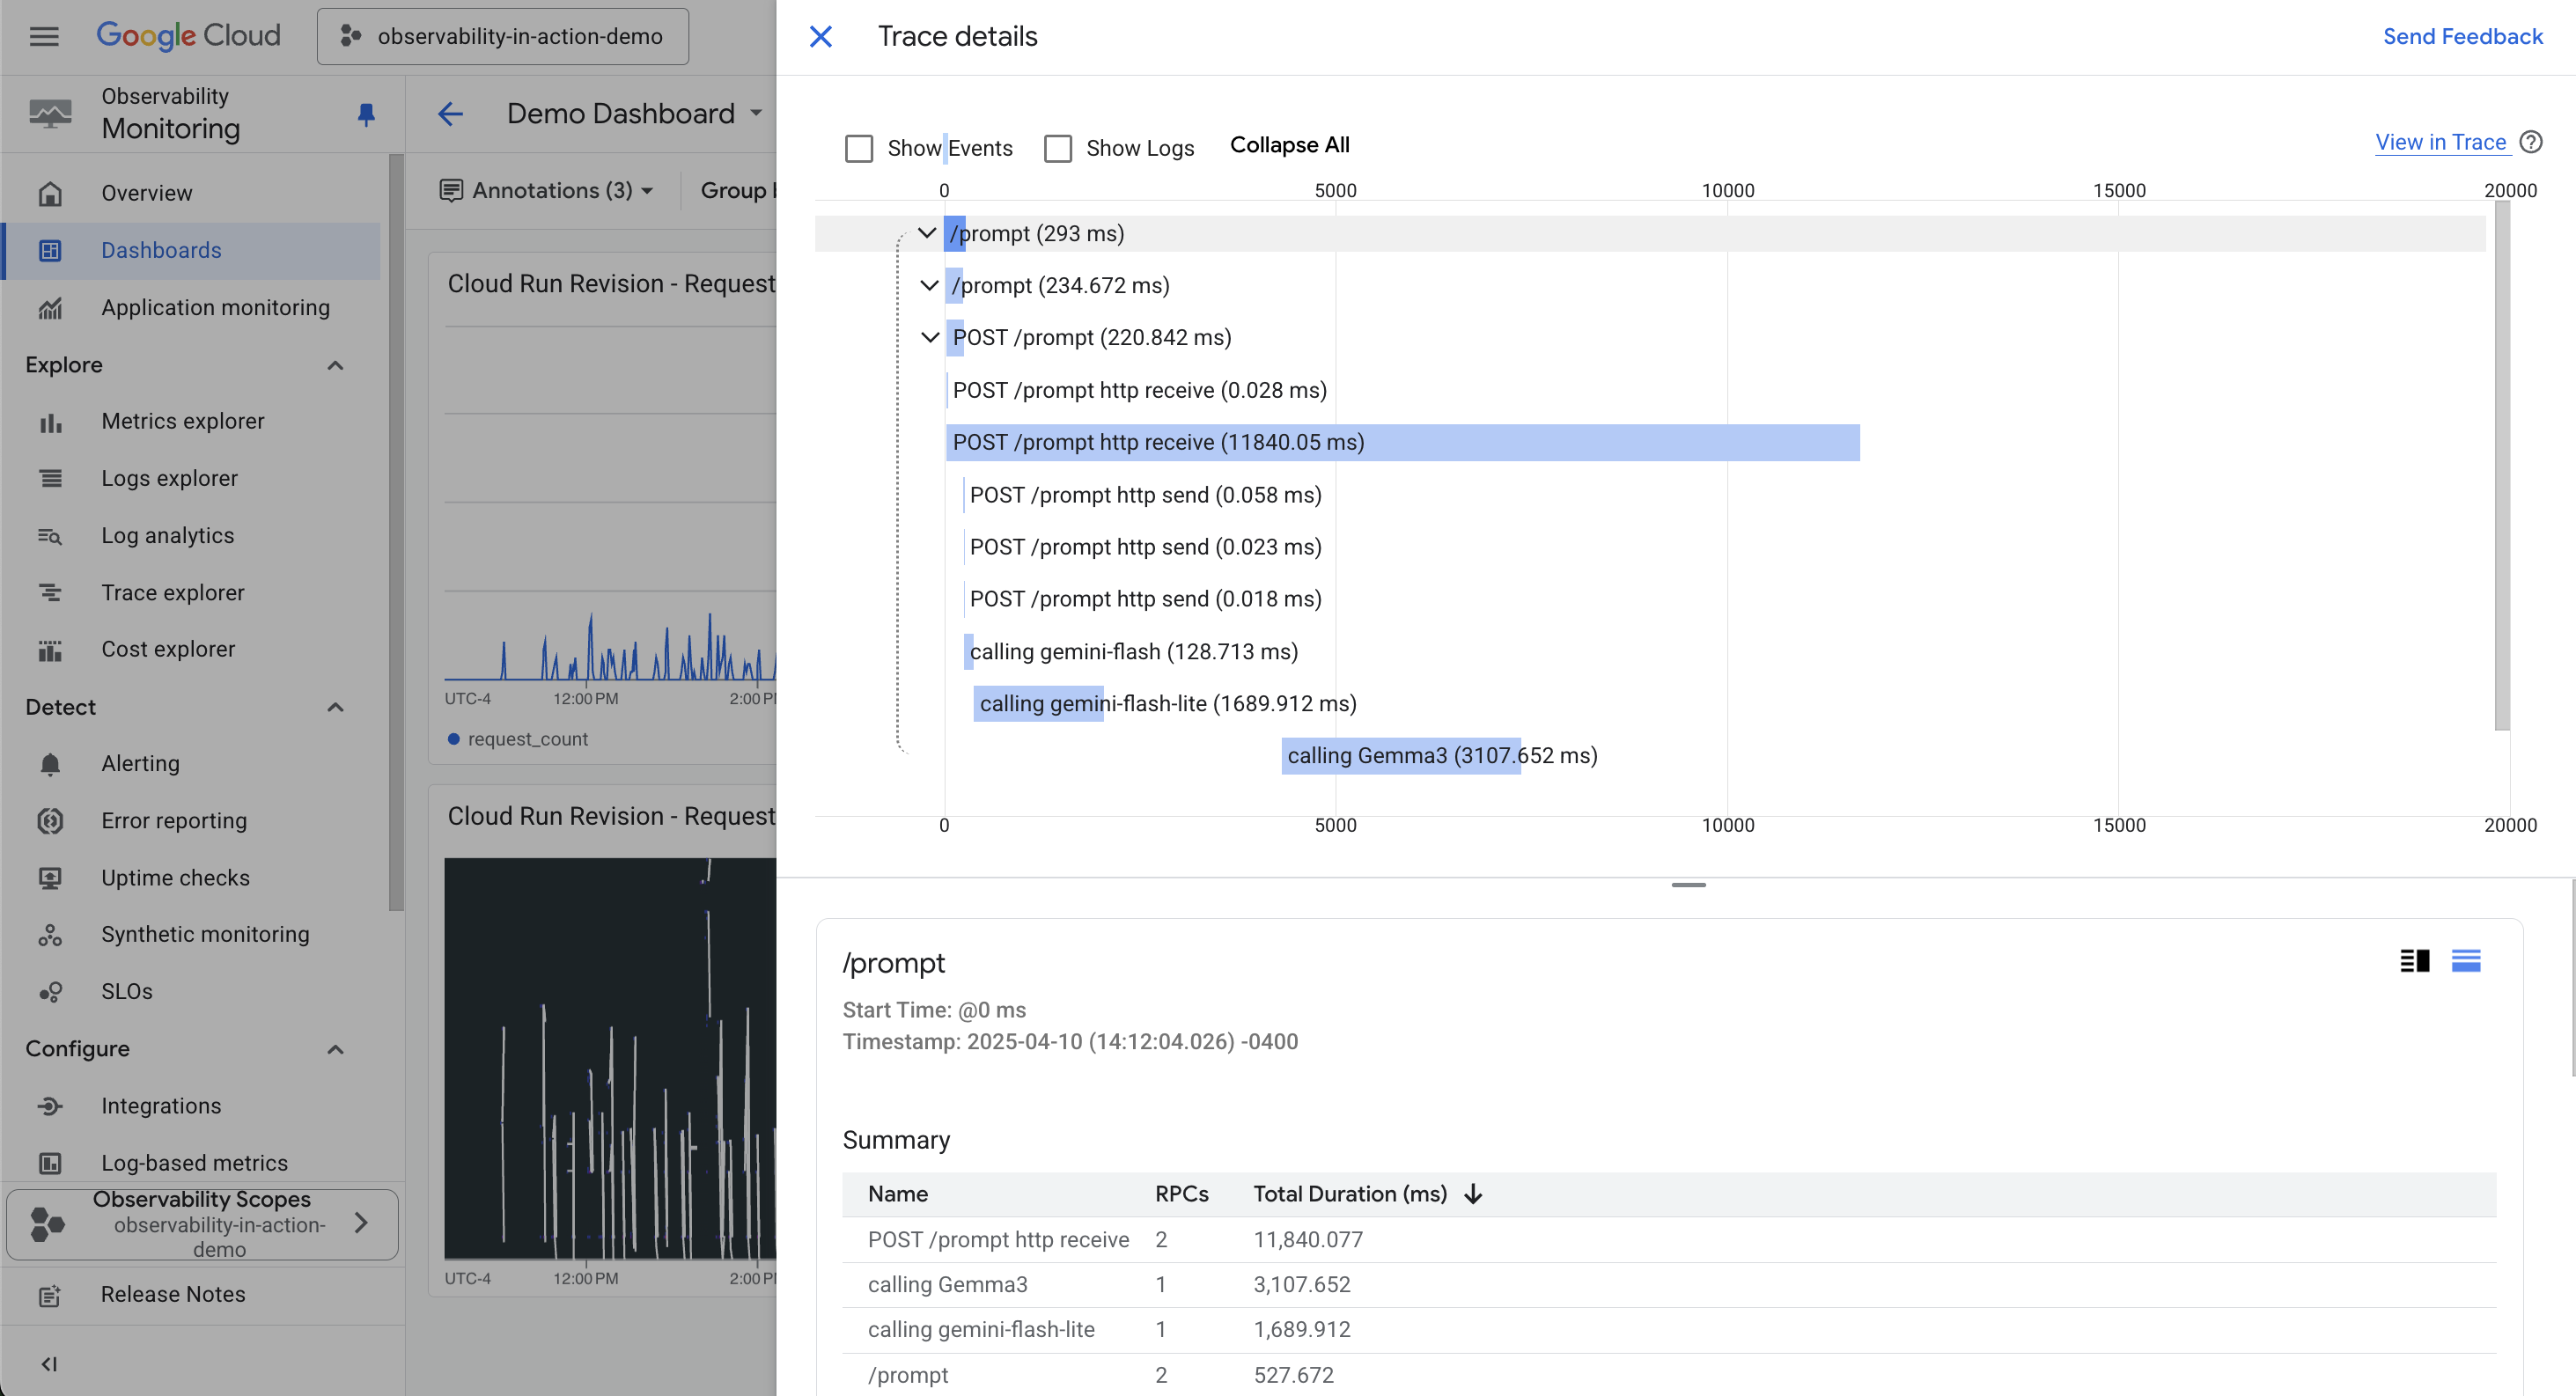
Cloud Trace is a distributed tracing system within Google Cloud that helps you understand request latency across your application and its services. It tracks how long different parts of your application take to process requests, visualizing the entire request flow. This is particularly valuable for identifying performance bottlenecks in microservices architectures by showing where time is spent during a request's lifecycle.
Here’s a real life example: In this demo we send a prompt to multiple models. We were sure we implemented concurrency correctly (so the calls to the three different models should’ve happened in parallel) yet the latency seems significantly higher than expected. When we dug into the trace of a call, we quickly realized that we were accidentally making those calls sequentially! These traces were made available to us via an OpenTelemetry instrumentation we added to our code.
Interact with your logs with BigQuery
BigQuery is a serverless enterprise data warehouse that enables super-fast SQL queries on large datasets without infrastructure management. It's built for scalable analytics, supports diverse data types, and integrates machine learning, offering a powerful platform for insights from real-time and historical data.
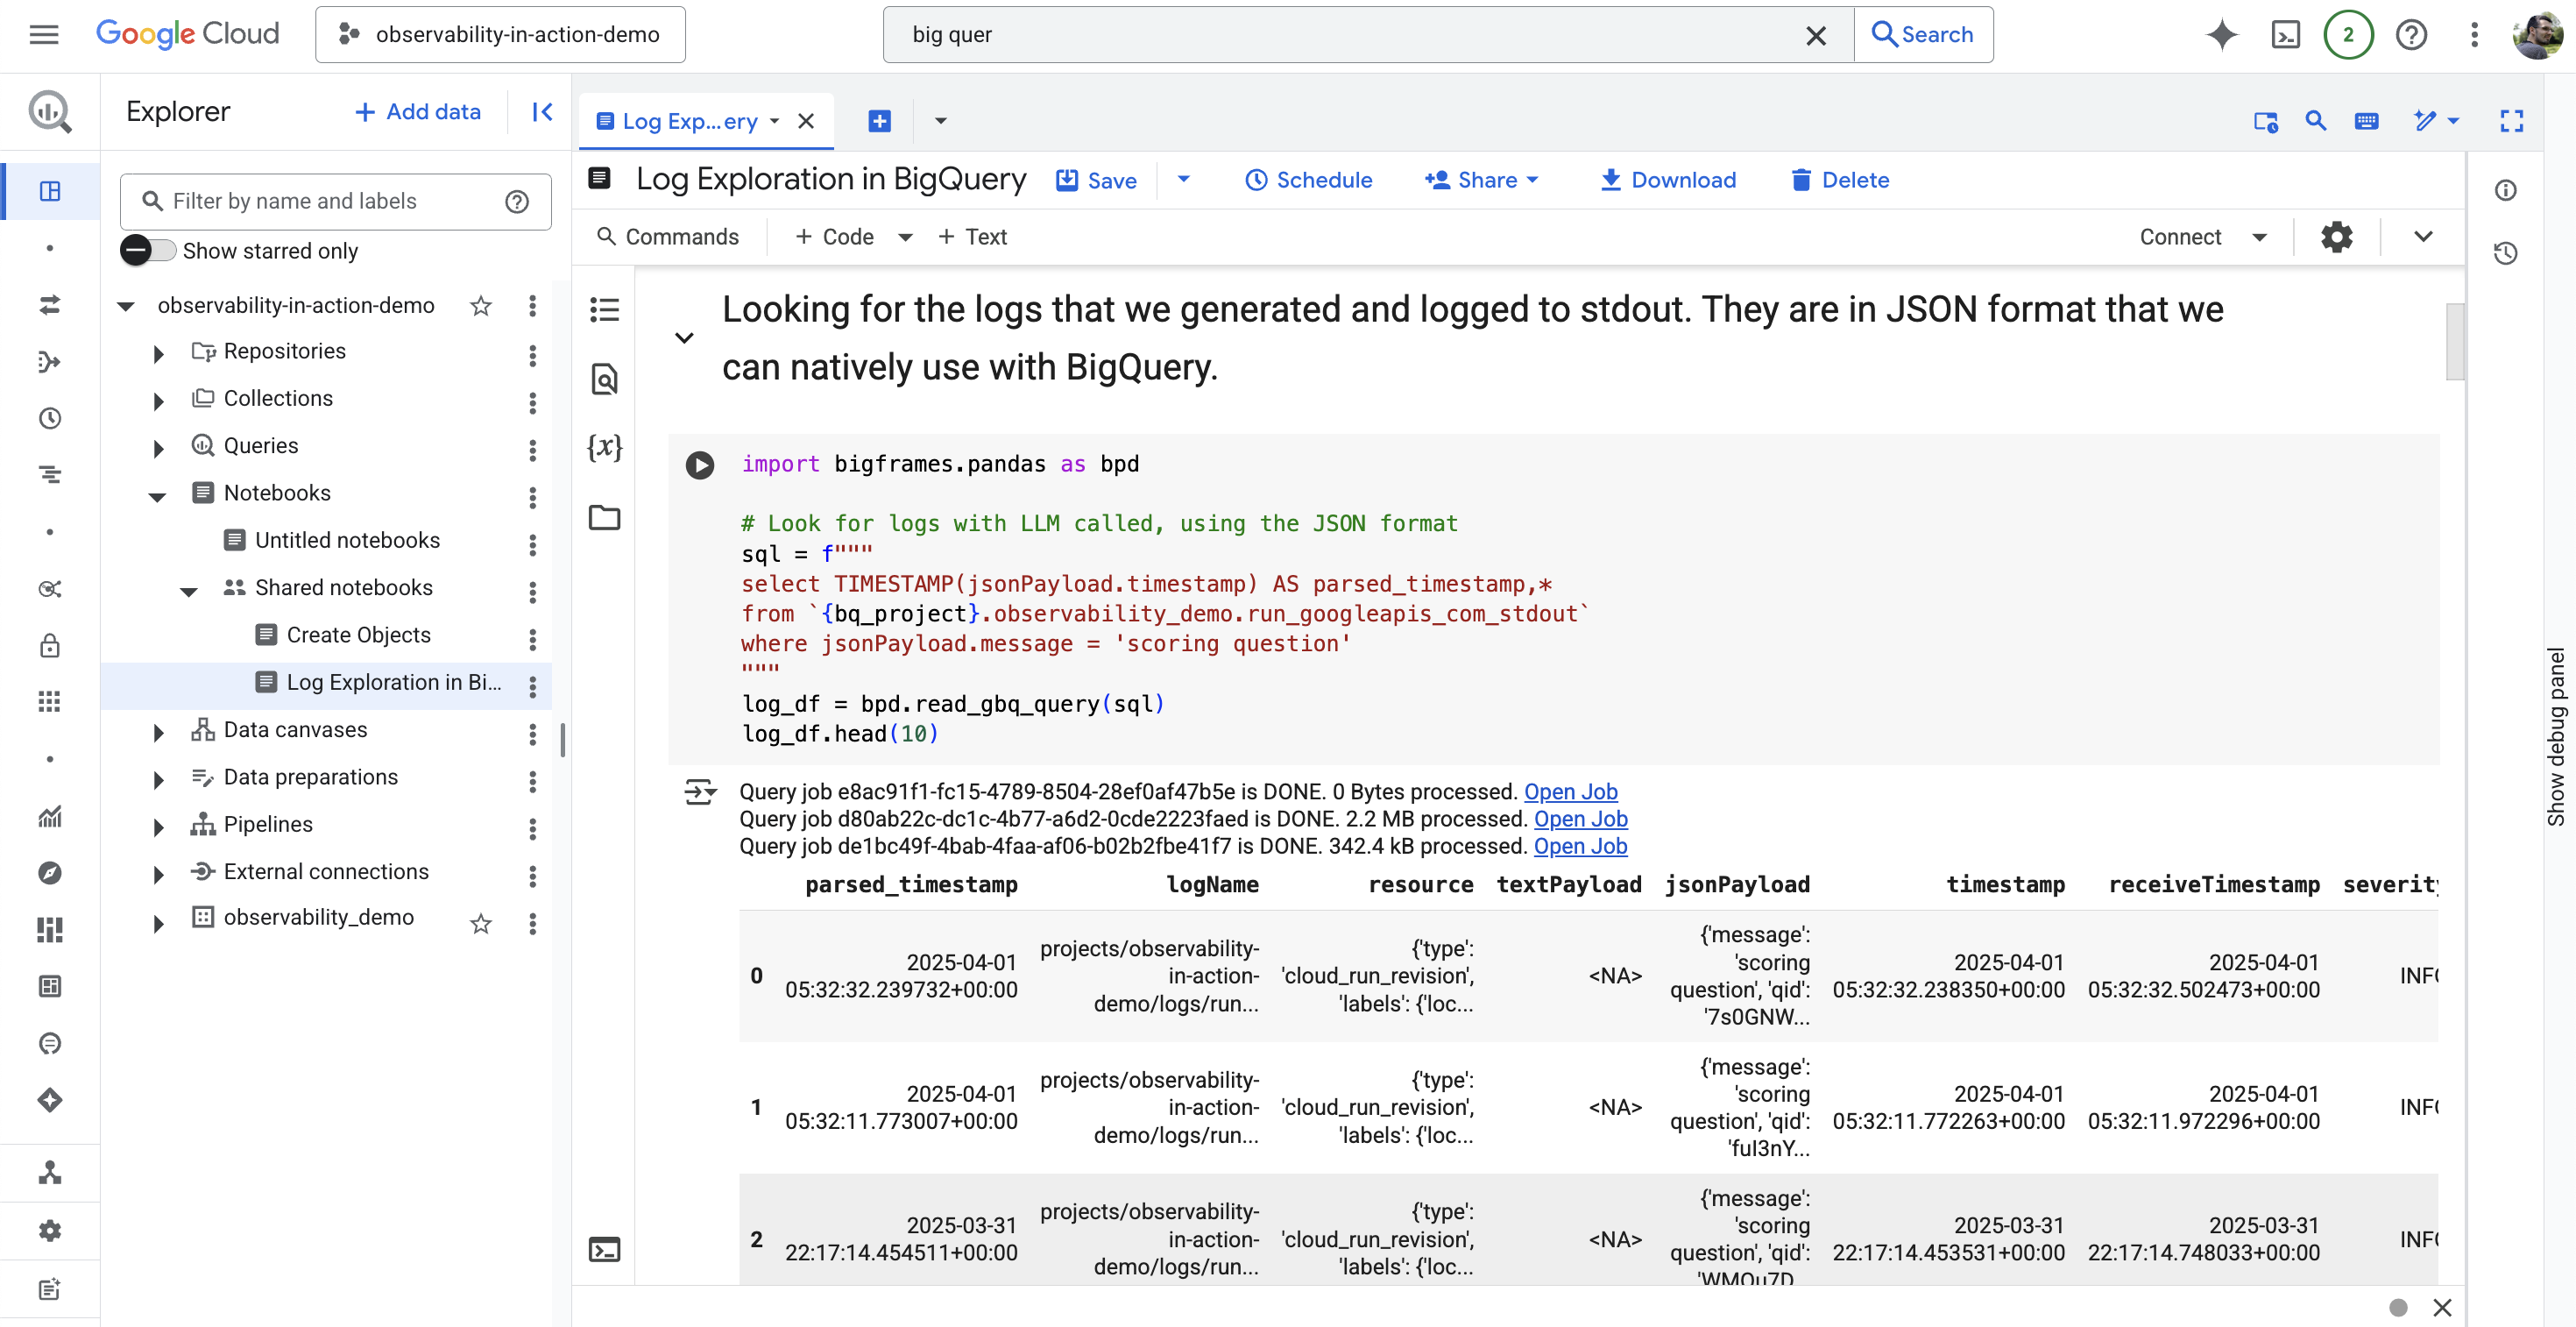
With a simple sink, you can directly stream logs from Cloud Logging into BigQuery, transforming it into a powerful, long-term log analytics platform. This allows you to run complex SQL queries across extensive historical log data, which is invaluable for in-depth security audits, compliance, and identifying subtle operational trends.
Connecting BigQuery to Jupyter Notebooks further enhances log analysis capabilities. This empowers users to leverage Python and data science libraries for advanced data exploration, custom visualizations, and machine learning on log data, facilitating deeper insights and shareable, interactive analysis beyond standard logging tools.
For this demo, we built a Jupyter Notebook that did analysis on the various interactive quiz events, cross-referenced answers with an external Firestore database, and built tables and charts of the resulting data.
Try it out!
Want to try this demo from home? The source code is available on GitHub.
Want to learn more about observability on Google Cloud? Check out these resources: