An outlier is a data point that significantly differs from other observations in a dataset. It can be:
- - Unusually high or low compared to the rest of the data.
- - Anomalous due to measurement errors, data entry mistakes, or rare events.
- - A true extreme value that represents natural variation.
Example of data set
name of the loaded data is Data

How to identify outliers
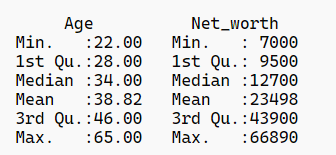
- basic summary function
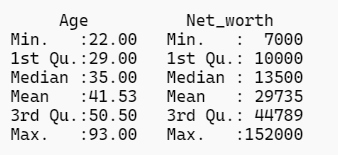
summary(Data)output
- Visual methods (using Box plot)
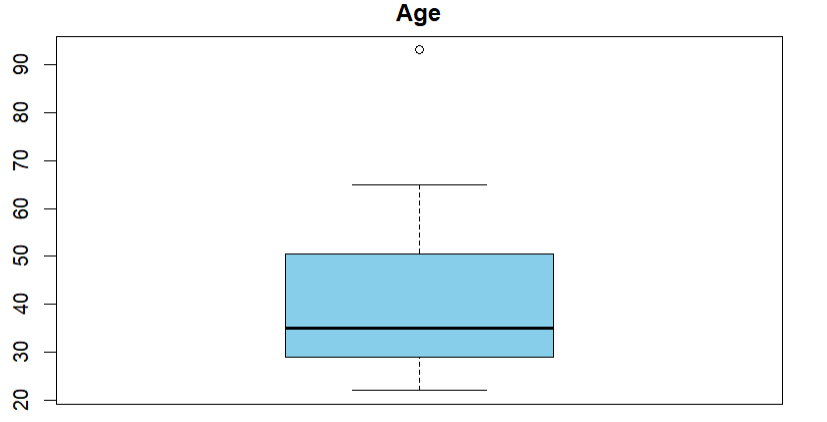
Plot age on a box plot
boxplot(Data$Age, main = "Age",col = "skyblue")
output
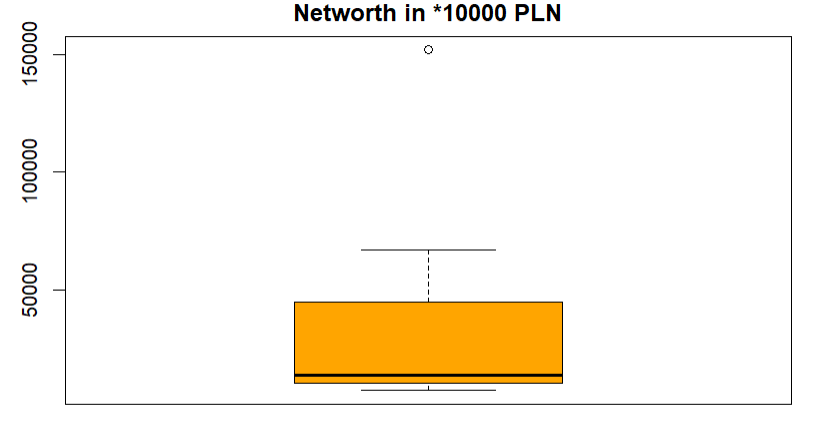
Plot Net_worth on a box plot
boxplot(Data$Net_worth, main ="Networth in *10000 PLN",col = "orange")output
- Using interquatile range
Identify the outlier on age values
Q1 <- quantile(Data$Age, 0.25)
Q3 <- quantile(Data$Age, 0.75)
IQR <- Q3 - Q1
lower_bound_age <- Q1 - 1.5 * IQR
upper_bound_age <- Q3 + 1.5 * IQR
outlier_age <- Data$Age[Data$Age < lower_bound_age | Data$Age > upper_bound_age]
print(outlier_age)
output
93
Identify the outlier on Net_worth values
Q1 <- quantile(Data$Net_worth, 0.25)
Q3 <- quantile(Data$Net_worth, 0.75)
IQR <- Q3 - Q1
lower_bound_Net_worth <- Q1 - 1.5 * IQR
upper_bound_Net_worth <- Q3 + 1.5 * IQR
outlier_networth <- Data$Net_worth[Data$Net_worth < lower_bound_Net_worth | Data$Net_worth > upper_bound_Net_worth]
print(outlier_networth)
output
152000
SOLVING THE OUTLIER
- Droping the outliers using the interquartile range
new_data <- Data[
  Data$Net_worth >= lower_bound_Net_worth & Data$Net_worth <= upper_bound_Net_worth &
  Data$Age >= lower_bound_age & Data$Age <= upper_bound_age,
]

summary(new_data)
output
- Substituting the outliers with column mean
identify the row index for outliers
# check the data row
which(Data$Net_worth== 152000 )
which(Data$Age== 93)
output
12, 10Replace the outliers with the means
#Replace the data points with the mean
Data$Net_worth[12] <- mean(Data$Net_worth)
Data$Age[10] <- mean(Data$Age)
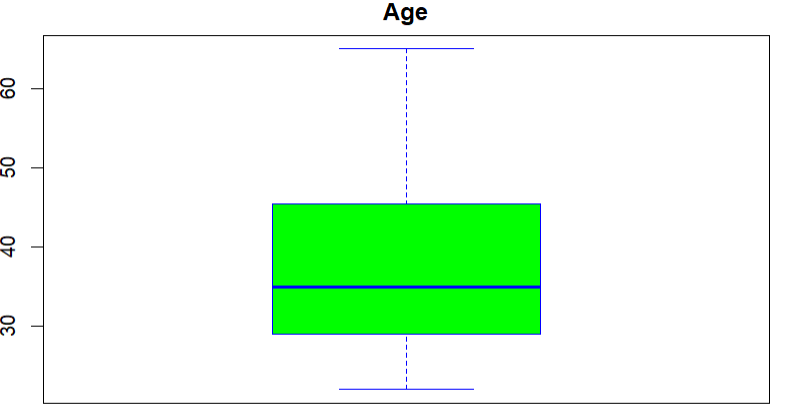
summary(Data)plot the new data columns on a box plot
boxplot(Data$Age,
        main = "Age",
        col = "green",
        border = "blue")
Output
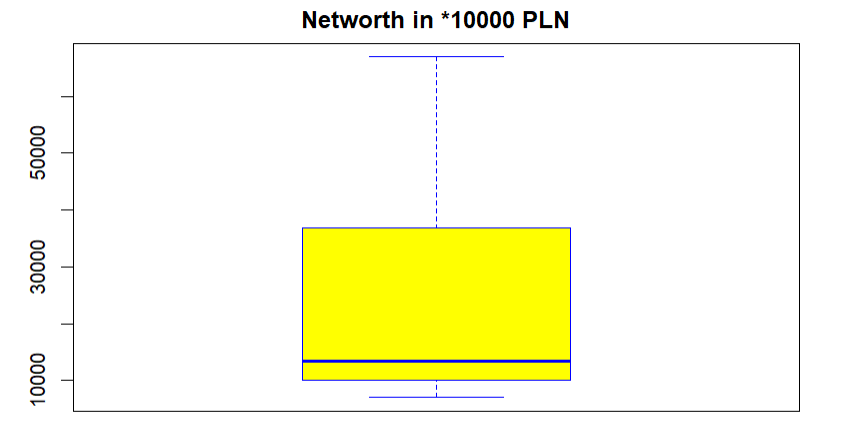
boxplot(Data$Net_worth,
        main = "Networth in *10000 PLN",
        col = "yellow",
        border = "blue")
output