Welcome to the second part of my peer review series of the tfl-data-visualization project—a cloud-native data engineering pipeline for analyzing passenger footfall at London Tube and TfL Rail stations.
In Part 1, we explored how the project defines its problem, leverages cloud infrastructure, and orchestrates data ingestion. In this post, we’ll take a closer look at the advanced analytics stages: how the project handles data warehousing, transformation, visualization, and reproducibility. We'll also wrap up with overall feedback and actionable suggestions.
4. Data Warehouse: BigQuery Partitioning for Scalable Analytics
A robust data warehouse is essential for analytical performance and cost-effectiveness. The project uses BigQuery to store and query processed data. Notably:
- Partitioned Tables: The ingestion pipeline consolidates data into native BigQuery tables that are partitioned by travel date. This is a best practice for optimizing query speed and reducing costs in large, time-series datasets.
- Clear Rationale: The README explains how and why partitioning is used, making it easy for reviewers and future maintainers to understand the design choices.
- Accessible Data: Both external and native tables are created, supporting flexible exploration and downstream analytics.
Review Comment:
Excellent use of partitioning and cloud-native data warehouse features. If further improvements are desired, consider documenting or implementing clustering strategies for even more efficient queries.
5. Transformations with dbt
Transformations are at the core of any data pipeline. This project uses dbt (data build tool) to structure, document, and automate its transformation logic:
-
Modular SQL Models: The
dbt/models/directory contains SQL models, with at least one (station_footfall_daily.sql) handling daily aggregation at the station level. -
Schema Documentation: The presence of
schema.ymlprovides both dbt testing and documentation, ensuring models are validated and well-described. - Automated Execution: dbt runs are orchestrated via Kestra, guaranteeing transformations are up-to-date after each ingestion cycle.
Review Comment:
Very strong use of dbt for modular, testable, and automated transformations. The structure supports both maintainability and extensibility. Jinja SQL FTW!
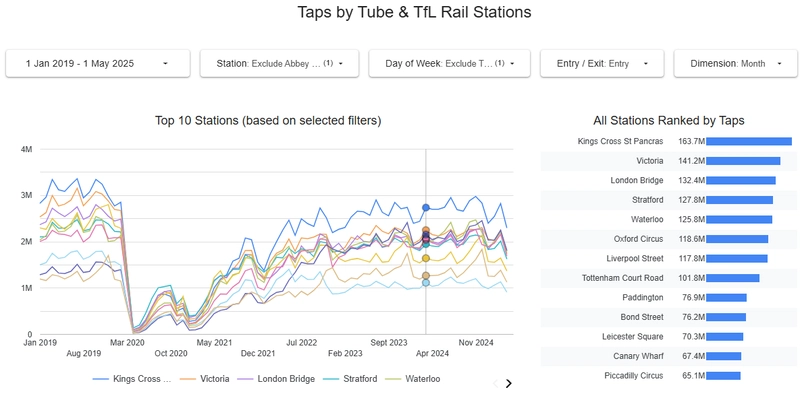
6. Dashboarding: Visualizing Insights with Looker Studio
No analytics pipeline is complete without a way to visualize and share insights. The project delivers on this with a Looker Studio dashboard:
- Multiple Interactive Tiles: The dashboard includes at least a time series chart and a station ranking table, providing multiple perspectives on the data.
- Filtering & Interactivity: Users can filter by dimension (date, station, tap type, etc.), making the dashboard useful for different stakeholders.
- Accessible Online: The dashboard is linked and screenshots are provided in the repository for transparency.

Review Comment:
Excellent dashboard implementation, with clear, actionable visualizations and interactive filtering that effectively communicate the project’s findings.
7. Reproducibility: Clear, Actionable Documentation
Reproducibility is key to collaboration and long-term success. This project excels in this regard:
- Step-by-Step Instructions: The README covers everything from cloud credential setup to infrastructure provisioning, orchestration, and transformation.
- Comprehensive Coverage: Both local and cloud-based setups are described, making the project accessible to a wide range of users.
- Ease of Use: With the provided instructions, anyone with appropriate cloud access can reproduce the results without guesswork.
Review Comment:
Great job on ensuring reproducibility. The thorough, actionable documentation is a highlight, lowering the barrier for contributors and reviewers alike.
8. Summary of Feedback and Recommendations
This project stands out for its clarity, modular design, automation, and modern use of cloud and open-source tools. Here’s a recap of what it does well, and where there’s room to grow:
Strengths:
- Clear business problem and motivation.
- Fully automated, cloud-native architecture (GCP, Terraform, Kestra).
- Partitioned BigQuery tables for scalable analytics.
- Modular and reproducible transformations with dbt.
- Interactive, insightful dashboard.
- Excellent documentation and reproducibility.
Areas for Improvement:
- Testing and CI/CD: Integrate dbt data tests and consider adding continuous integration for pipeline validation.
- Monitoring & Alerting: Add pipeline monitoring and notification mechanisms for production robustness.
- Orchestration Visualization: Include screenshots or diagrams of Kestra flows for enhanced documentation.
- Warehouse Optimization: Consider clustering or additional optimization strategies in BigQuery.
- Streaming Data: If the data source evolves, explore adding real-time streaming capabilities.
Final Thoughts
The tfl-data-visualization project exemplifies the best practices of data engineering: clarity, automation, scalability, and actionable business insights. Peer reviews like this not only celebrate what works but also help teams identify opportunities to make great projects even better. Special thanks DataTalks Club for this learning opportunity.
![[Snowflake's New Feature] Introducing Generation 2 Standard Warehouses: A Performance Comparison](/uploads/2025/05/6819d89086037.png)