Use docling built-in features to make picture annotation.

Introduction
Picture annotation, a crucial task in various computer vision applications (among others…😉), involves adding descriptive labels or information to images. With the Docling project’s “Picture Annotation” API, as showcased in their examples, this process becomes more streamlined and accessible. This feature and API’s provided, empowers users to programmatically interact with documents, potentially extracting features, identifying objects, and generating insightful annotations, paving the way for enhanced image understanding and analysis.
Annotation implementation
Docling’s examples effectively showcase the versatility of its picture annotation API through both remote and local vLLM implementations. My own experimentation further validated this functionality, with successful remote testing conducted using the watsonx.ai platform and a Granite model. This highlights Docling’s adaptability to various deployment environments, offering flexibility for users with different infrastructure needs.
- Environment preparation.
python3 -m venv venv
source venv/bin/activate

pip install --upgrade pip
pip install docling_core- Environment variables (in my case in a “.env” file)
WX_PROJECT_ID="xxxxxx"
WX_API_KEY="yyyyyy"source .env- Code 🧑💻
import logging
import os
from pathlib import Path

import requests
from docling_core.types.doc import PictureItem
from dotenv import load_dotenv

from docling.datamodel.base_models import InputFormat
from docling.datamodel.pipeline_options import (
    PdfPipelineOptions,
    PictureDescriptionApiOptions,
)
from docling.document_converter import DocumentConverter, PdfFormatOption

def vllm_local_options(model: str):
    options = PictureDescriptionApiOptions(
        url="http://localhost:8000/v1/chat/completions",
        params=dict(
            model=model,
            seed=42,
            max_completion_tokens=200,
        ),
        prompt="Describe the image in three sentences. Be consise and accurate.",
        timeout=90,
    )
    return options

def watsonx_vlm_options():
    load_dotenv()
    api_key = os.environ.get("WX_API_KEY")
    project_id = os.environ.get("WX_PROJECT_ID")

    def _get_iam_access_token(api_key: str) -> str:
        res = requests.post(
            url="https://iam.cloud.ibm.com/identity/token",
            headers={
                "Content-Type": "application/x-www-form-urlencoded",
            },
            data=f"grant_type=urn:ibm:params:oauth:grant-type:apikey&apikey={api_key}",
        )
        res.raise_for_status()
        api_out = res.json()
        print(f"{api_out=}")
        return api_out["access_token"]

    options = PictureDescriptionApiOptions(
        url="https://us-south.ml.cloud.ibm.com/ml/v1/text/chat?version=2023-05-29",
        params=dict(
            model_id="meta-llama/llama-3-2-11b-vision-instruct",
            project_id=project_id,
            parameters=dict(
                max_new_tokens=400,
            ),
        ),
        headers={
            "Authorization": "Bearer " + _get_iam_access_token(api_key=api_key),
        },
        prompt="Describe the image in three sentences. Be consise and accurate.",
        timeout=60,
    )
    return options

def main():
    logging.basicConfig(level=logging.INFO)

    # ad-hoc input / output configuration
    input_doc_path = Path("./input/2501.17887v1.pdf")
    output_markdown_path = Path("./output/picture_descriptions.md")

    # Create the output directory if it doesn't exist
    output_markdown_path.parent.mkdir(parents=True, exist_ok=True)

    pipeline_options = PdfPipelineOptions(
        enable_remote_services=True  # <-- this is required!
    )
    pipeline_options.do_picture_description = True

    # The PictureDescriptionApiOptions() allows to interface with APIs supporting
    # the multi-modal chat interface. Here follow a few example on how to configure those.
    #
    # One possibility is self-hosting model, e.g. via VLLM.
    # $ vllm serve MODEL_NAME
    # Then PictureDescriptionApiOptions can point to the localhost endpoint.
    #
    # Example for the Granite Vision model: (uncomment the following lines)
    pipeline_options.picture_description_options = vllm_local_options(
        model="ibm-granite/granite-vision-3.1-2b-preview"
    )
    #
    # Example for the SmolVLM model: (uncomment the following lines)
    #pipeline_options.picture_description_options = vllm_local_options(
    #    model="HuggingFaceTB/SmolVLM-256M-Instruct"
    #)
    #
    # Another possibility is using online services, e.g. watsonx.ai.
    # Using requires setting the env variables WX_API_KEY and WX_PROJECT_ID.
    # Uncomment the following line for this option:
    pipeline_options.picture_description_options = watsonx_vlm_options()

    doc_converter = DocumentConverter(
        format_options={
            InputFormat.PDF: PdfFormatOption(
                pipeline_options=pipeline_options,
            )
        }
    )
    result = doc_converter.convert(input_doc_path)

    with open(output_markdown_path, "w", encoding="utf-8") as md_file:
        for element, _level in result.document.iterate_items():
            if isinstance(element, PictureItem):
                caption = element.caption_text(doc=result.document)
                annotations = element.annotations

                md_file.write(f"## Picture {element.self_ref}\n\n")
                md_file.write(f"**Caption:** {caption}\n\n")
                if annotations:
                    md_file.write("**Annotations:**\n")
                    for annotation in annotations:
                        md_file.write(f"- {annotation}\n")
                else:
                    md_file.write("**Annotations:** None\n\n")
                md_file.write("---\n\n")

    print(f"Picture descriptions written to: {output_markdown_path}")

if __name__ == "__main__":
main()- Output ⬇️
## Picture #/pictures/0
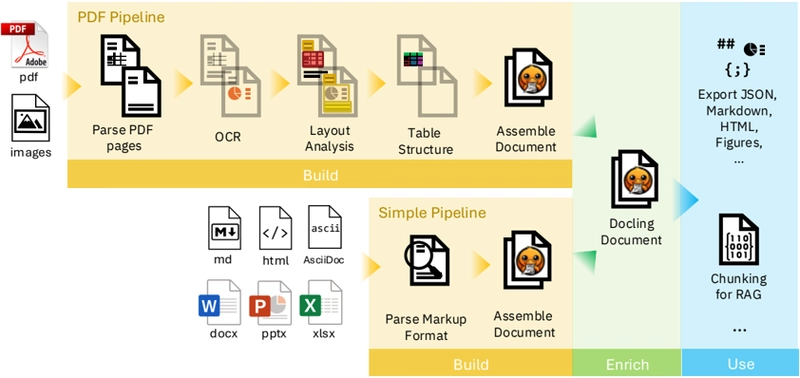
**Caption:** Figure 1: Sketch of Docling's pipelines and usage model. Both PDF pipeline and simple pipeline build up a DoclingDocument representation, which can be further enriched. Downstream applications can utilize Docling's API to inspect, export, or chunk the document for various purposes.
**Annotations:**
- kind='description' text="The image displays Explore Document Viewer software with two pipelines, PDF Pipeline and a Simple one. The PDF pipeline can Entice Parse, OCR, Layout, Table Structure Analysis, and Assemble Document. The Simple pipeline's processes can be BUILD, Parse Markup Format, and Assemble Document with DOCX, Markdown, and XML. Lastly, there is an internet export and a chunking for RAG." provenance='not-implemented'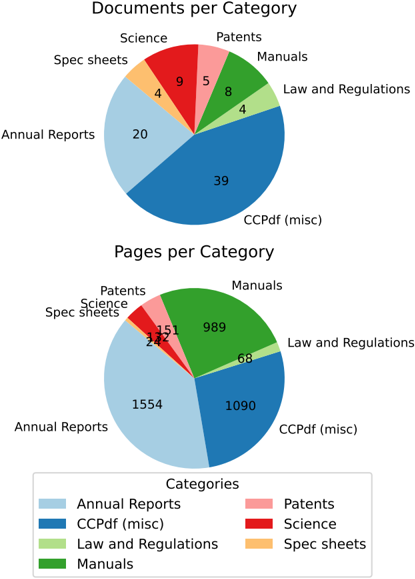
# Picture #/pictures/1

**Caption:** Figure 2: Dataset categories and sample counts for documents and pages.

**Annotations:**
- kind='description' text='This infographic presents a comparative analysis of the page counts of various types of documents for CCPdf (misch). The top graph displays the page counts by document category, with manuals (8 and 55 combined) and annual reports (20 and 1554 combined) having the lowest and highest number of pages, respectively. The bottom graph shows a similar trend, with a notably higher share of annual reports (more than 1200 pages) compared to the other categories. \n\nAccording to the designer, the infographic demonstrates the benefit of combining similar categories and shows that none of the categories, except for Spec Sheets, can continually be represented side by side in the same graph, potentially confusing the reader.' provenance='not-implemented'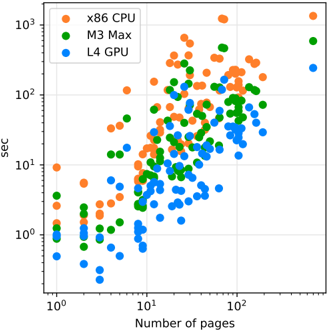
## Picture #/pictures/2

**Caption:** Figure 3: Distribution of conversion times for all documents, ordered by number of pages in a document, on all system configurations. Every dot represents one document. Log/log scale is used to even the spacing, since both number of pages and conversion times have long-tail distributions.

**Annotations:**
- kind='description' text='**Image Summary**\n\nThis scatter plot presentation displays multiple data sets, each with a unique color, that correlates the number of pages and the elapsed time in seconds. The plot features three categories with 152 corresponding data points each: x86 CPU (orange), M3 Max (green), and L4 GPU (blue).\n\n**X-Axis & Y-Axis**\n\nThe x-axis represents individual data points on a logarithmic scale of 1 to 1,000, with labels every ten. The y-axis similarly displays data points on a logarithmic scale of one to one-thousand-sec, with labels at every hundred allowed space.\n\n**Data Points & Ramp**\n\nAll data points show a positive correlation between the number of pages and elapsed time, with similarly back-filled points grouped together. However, none of the data is collected on a regular grid.\n\n**CPU Categories**\n\nThere is a notable ramp in elapsed time as the number of pages increases for each category, with the x86 CPU (orange) showing the steepest slope of all metrics, L4 GPU (blue) the second most, and M3 Max (green) the least.' provenance='not-implemented'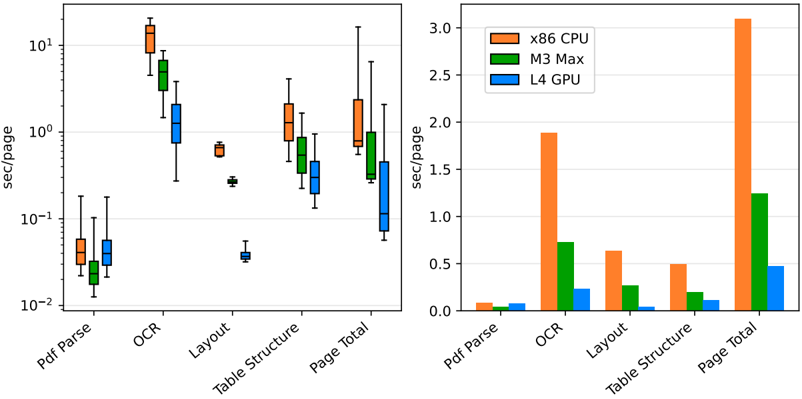
## Picture #/pictures/3

**Caption:** Figure 4: Contributions of PDF backend and AI models to the conversion time of a page (in seconds per page). Lower is better. Left: Ranges of time contributions for each model to pages it was applied on (i.e., OCR was applied only on pages with bitmaps, table structure was applied only on pages with tables). Right: Average time contribution to a page in the benchmark dataset (factoring in zero-time contribution for OCR and table structure models on pages without bitmaps or tables) .

**Annotations:**
- kind='description' text="The image presents a comprehensive comparison of the computational performance of three graphics processing units (GPUs): x86 CPU, M3 Max, L4 GPU. The visualizations include a box-and-whisker plot and a bar chart, each displaying the average processing speed per page across six tasks: Pdf Parse, OCR, Layout, Table Structure, Page Total, and QCR. This data is presented in both coupons/yods and seconds/second formats, providing a thorough understanding of the GPUs' processing capabilities.\n\n**CPU/GPU boxes represent the median (orange), 50% range (green), and 95% range (blue) that are calculated from the data set.**\n\n**The box-and-whisker plot shows a box that consists of a baseline. This box corresponds to, and is bounded by, the 25th and 75th percentiles of the data set. Black pixels inside highlight the image’s median.**" provenance='not-implemented'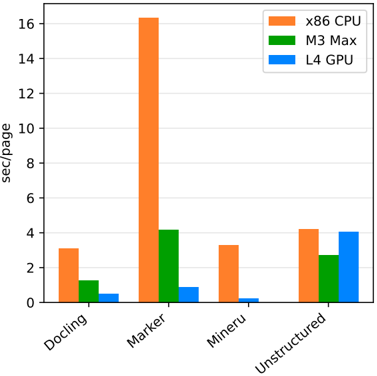
## Picture #/pictures/4

**Caption:** Figure 5: Conversion time in seconds per page on our dataset in three scenarios, across all assets and system configurations. Lower bars are better. The configuration includes OCR and table structure recognition ( fast table option on Docling and MinerU, hi res in unstructured, as shown in table 1).

**Annotations:**
- kind='description' text="The vertical bar graph presents data on four processors - Docling, Marker, Mineru, and Unstructured - tested on three different formats: x86 CPU, M3 Max, and L4 GPU. Each format explores their speed in reading different pages. Despite Ubuntu being a possible input, it wasn't included in the graph presumably due to poor performance. The graph indicates that M3 Max read the most information via marker pages, while L4 GPU read the most in unstructured pages." provenance='not-implemented'
Conclusion
In conclusion, Docling’s “Picture Annotation” API offers a powerful and user-friendly avenue for tackling the essential task of picture annotation. By providing a programmatic interface, it simplifies the process of extracting meaningful information from images, opening doors for advancements in diverse fields ranging from object recognition to image retrieval. Embracing Docling’s capabilities can significantly enhance the efficiency and effectiveness of your computer vision projects, making it a valuable tool for researchers and developers alike.
Links
- Annotate picture with remote VLM: https://docling-project.github.io/docling/examples/pictures_description_api/
- Docling documentation: https://docling-project.github.io/docling/