Installed Key Python Libraries for Machine Learning
Checking the version of the pip installed:

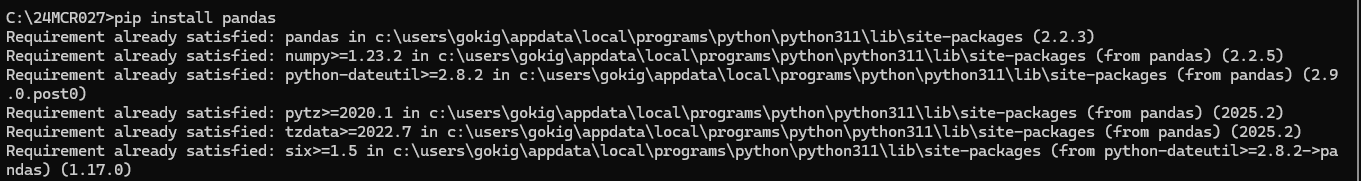
PANDAS
Importing pandas for the machine learning code
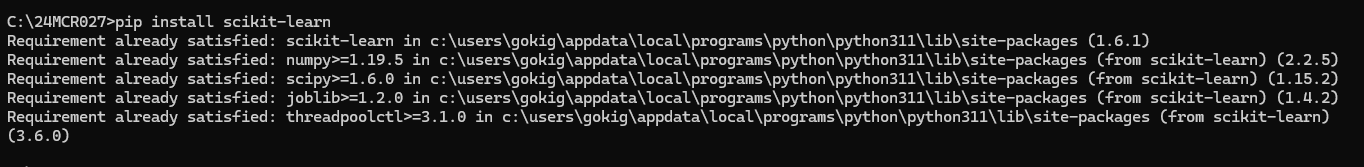
SKICIT-LEARN
Importing skicit learn
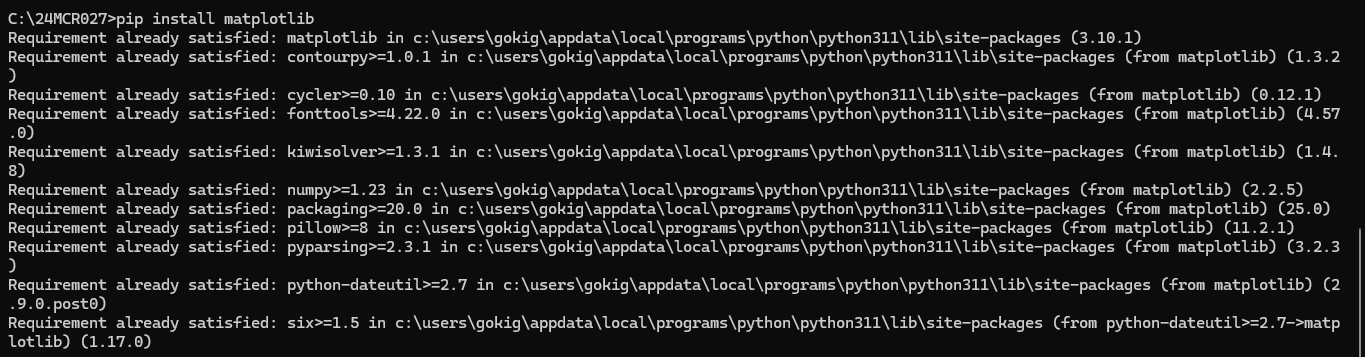
MATPLOTLIB
Importing matplotlib
ALGORITHM
from pandas import read_csv
from matplotlib import pyplot
from sklearn.linear_model import LogisticRegression
from sklearn.model_selection import train_test_split
import joblib
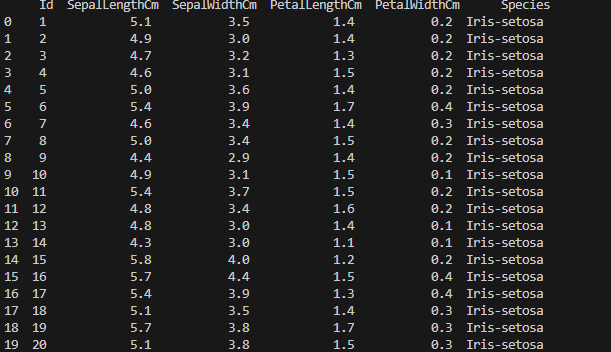
Step 1: Load dataset
filename = "Iris.csv"
data = read_csv(filename)
Step 2: Display data shape and preview
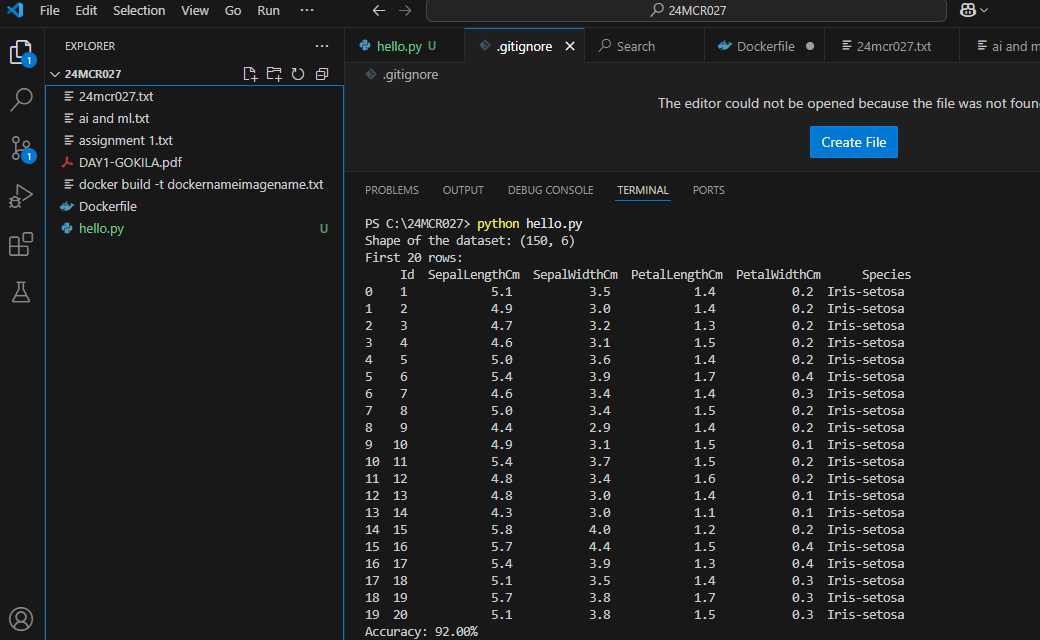
print("Shape of the dataset:", data.shape)
print("First 20 rows:\n", data.head(20))
Step 3: Plot and save histograms silently
data.hist()
pyplot.savefig("histograms.png")
pyplot.close() # Close the plot so it doesn't show up in prompt
Step 4: Plot and save density plots silently
data.plot(kind='density', subplots=True, layout=(3,3), sharex=False)
pyplot.savefig("density_plots.png")
pyplot.close()
Step 5: Convert to NumPy array and extract features/labels
array = data.values
X = array[:, 1:5] # Features: Sepal/Petal measurements
Y = array[:, 5] # Target: Species
Step 6: Split data into training (67%) and testing (33%)
test_size = 0.33
seed = 7
X_train, X_test, Y_train, Y_test = train_test_split(X, Y, test_size=test_size, random_state=seed)
Step 7: Create and train logistic regression model
model = LogisticRegression(max_iter=200)
model.fit(X_train, Y_train)
Step 8: Evaluate and display accuracy
result = model.score(X_test, Y_test)
print("Accuracy: {:.2f}%".format(result * 100))
Step 9: Save the trained model to a file
joblib.dump(model, "logistic_model.pkl")
IRIS DATASET
OUTPUT

DENSITY_PLOTS
HISTOGRAM

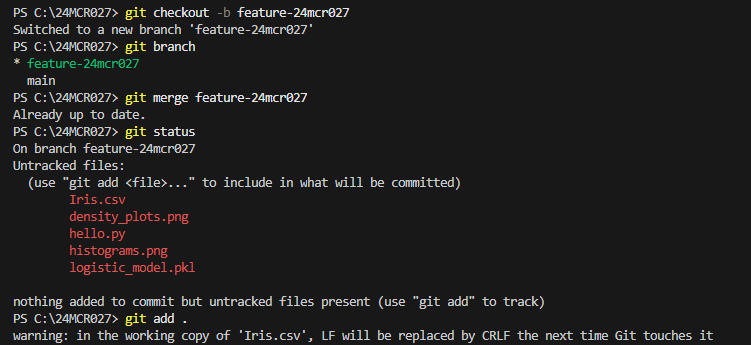
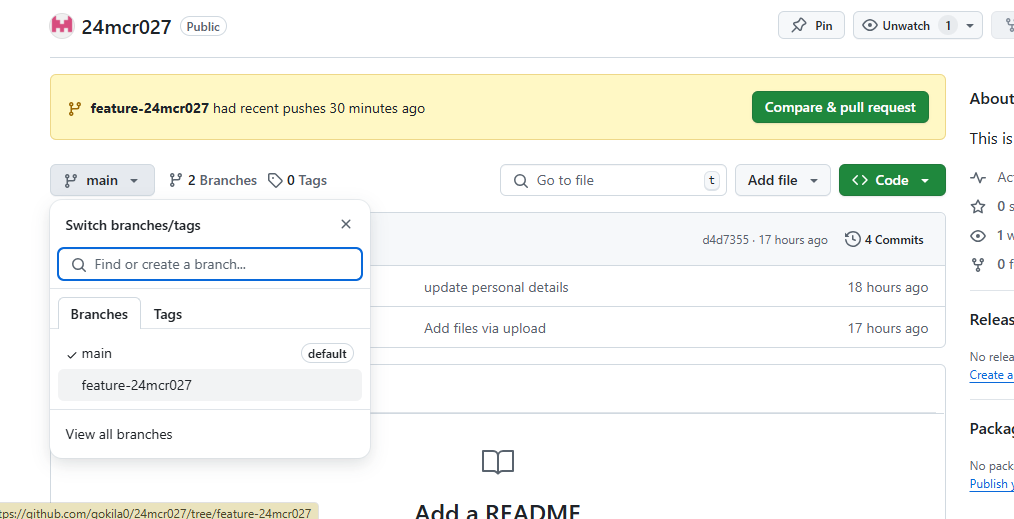
BRANCH CREATION IN GITHUB TO STORE THE CODE: