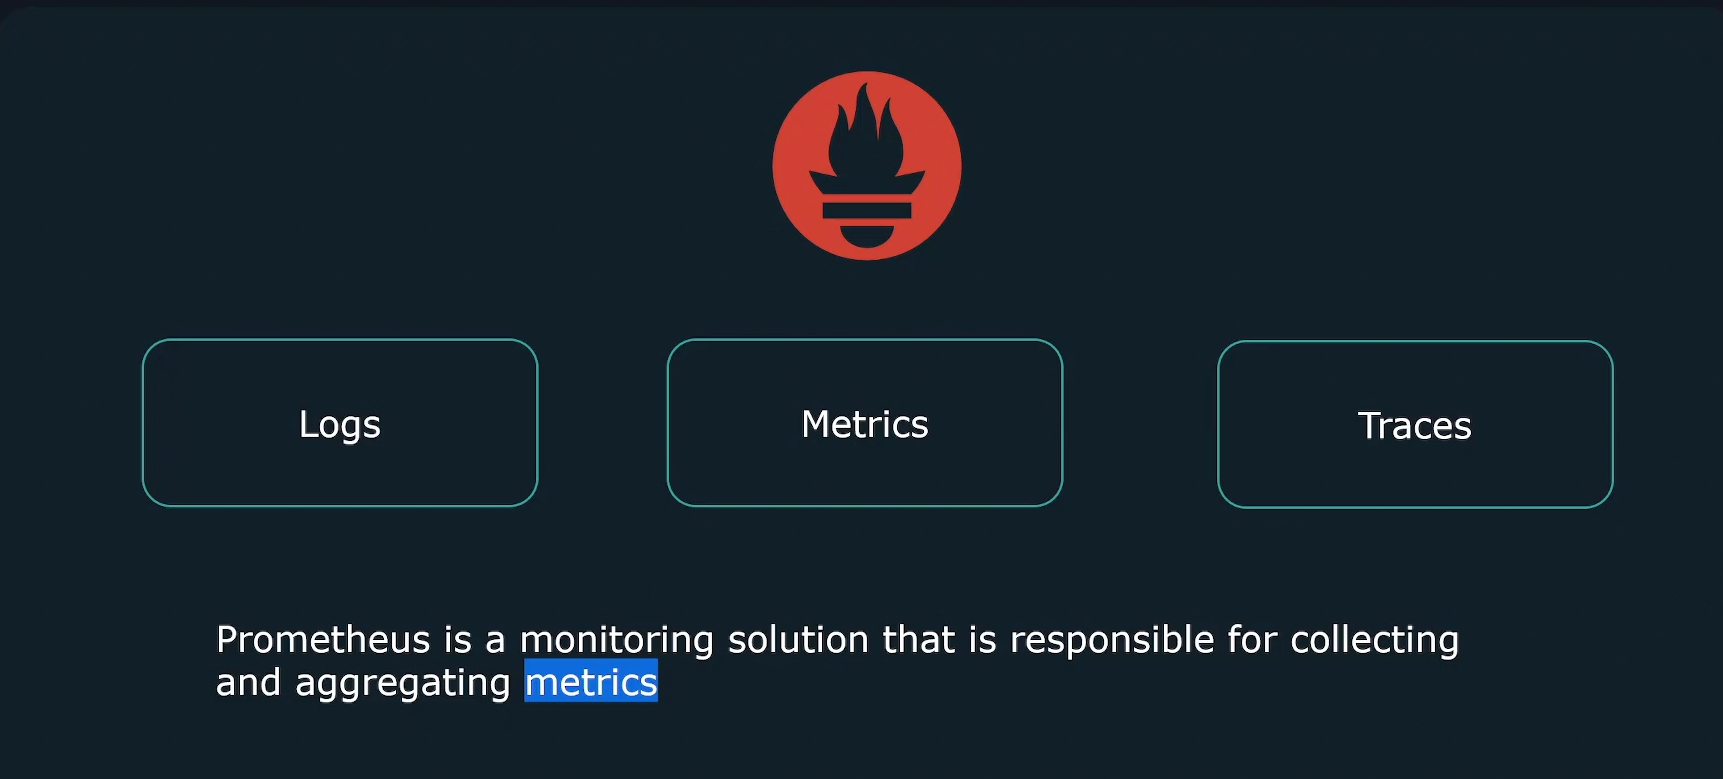
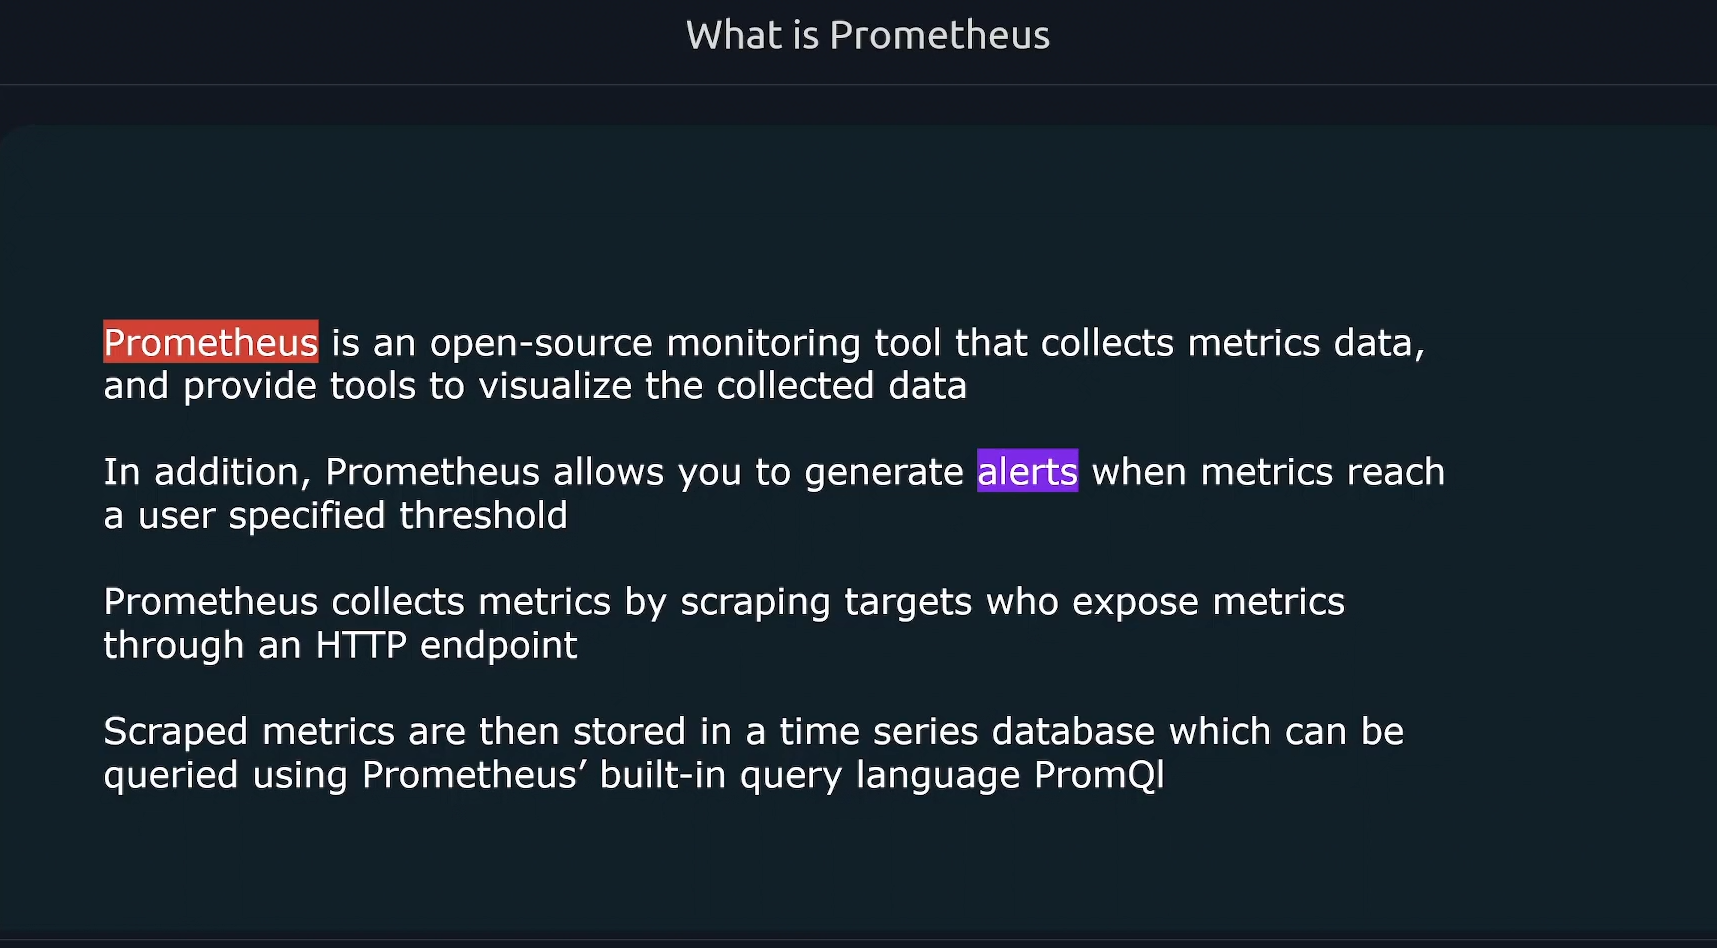
In this blog we are going to discuss about the Prometheus. It is opensource Observability tool for the applications.
As system architecture continue to get more and more complex, new challenges arise as tracking down issues become far more challenging.
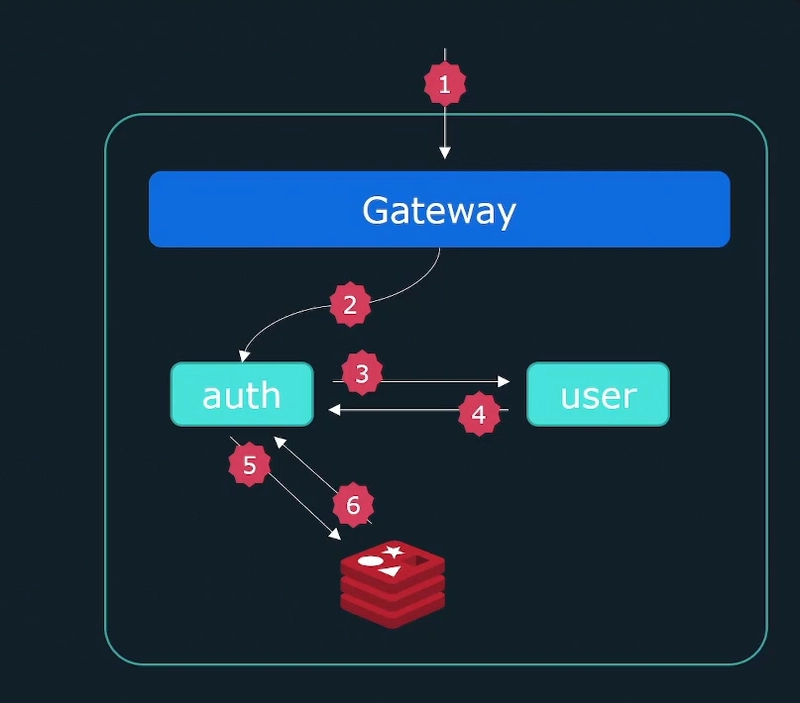
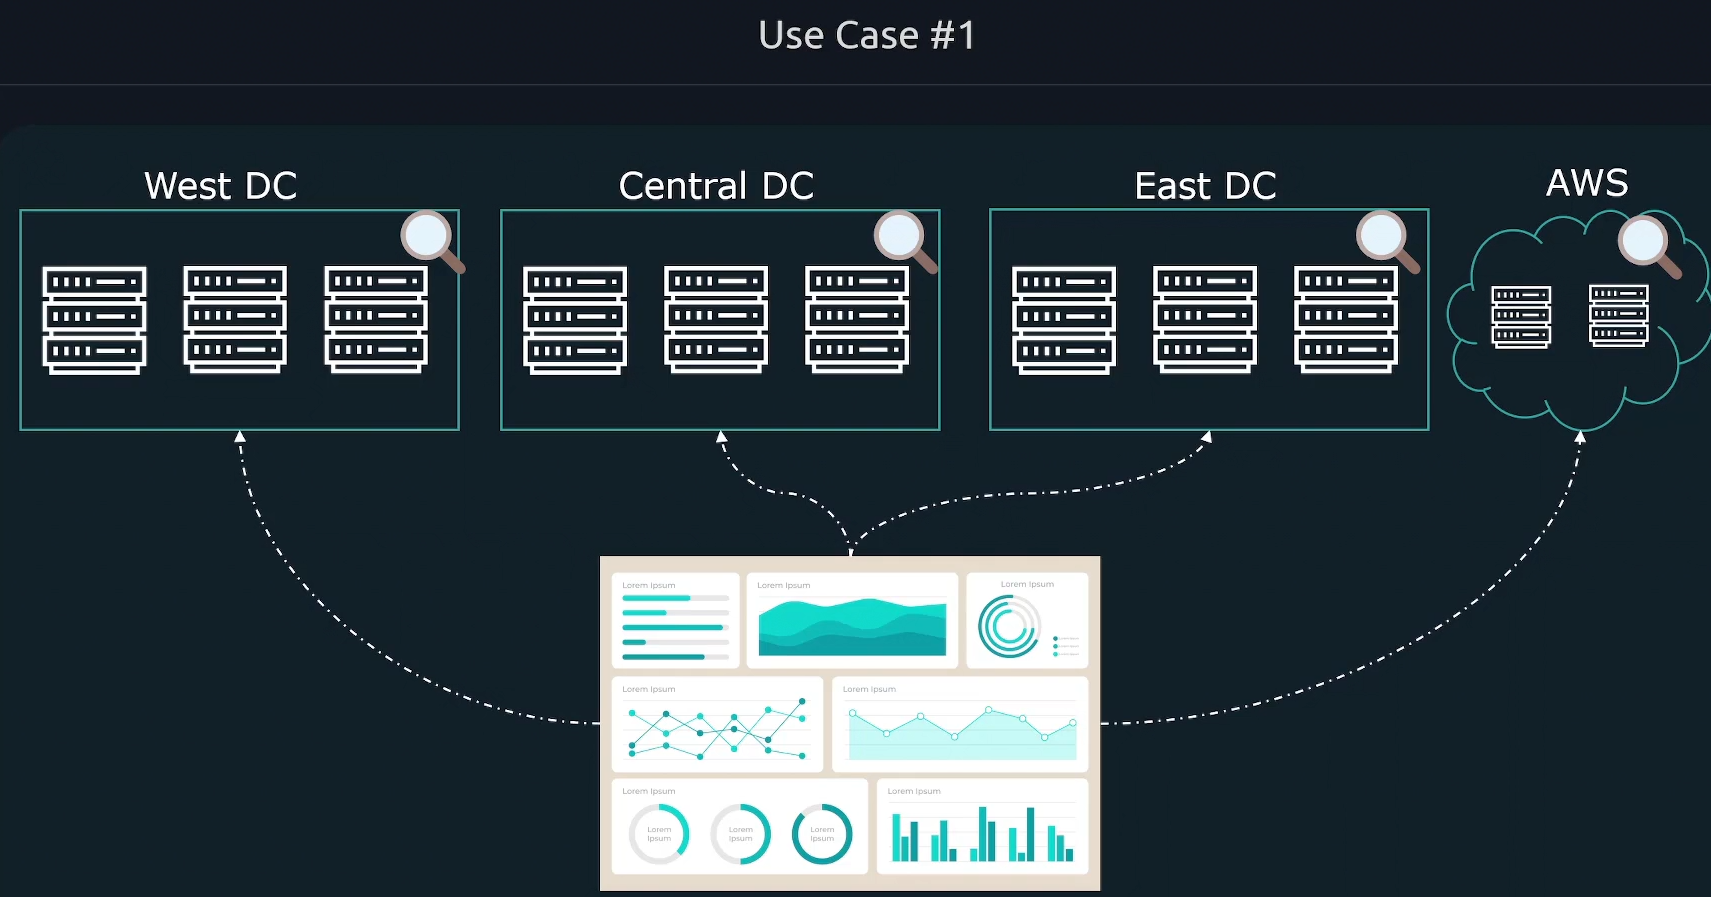
There's a greater need for observability as we move towards distributed systems & microservices based application.
When it comes to troubleshooting issues, we need more information than just what is wrong.
We need to know to know why our application entered a specific state, what component is responsible and how we can avoid it in the future.
- Why are error rates rising
- Why is there high latency
- Why are services timing out
Observability gives you the flexibility to understand unpredictable events.
How do we accomplish observability?
- Logging
- Metrics
- Tracing
Logging
Logs are records of events that have occurred and encapsulate information about the specific event.
Logs are comprised of:
- Timestamp of when the log occured
- Message containing information
Logs are the most common form of observation produced by systems.
However, they can be difficult to use due to the verbosity of the logs outputted by the applications.
Logs of processes are likely to be interwoven with other concurrent processes spread across multiple systems.
Traces
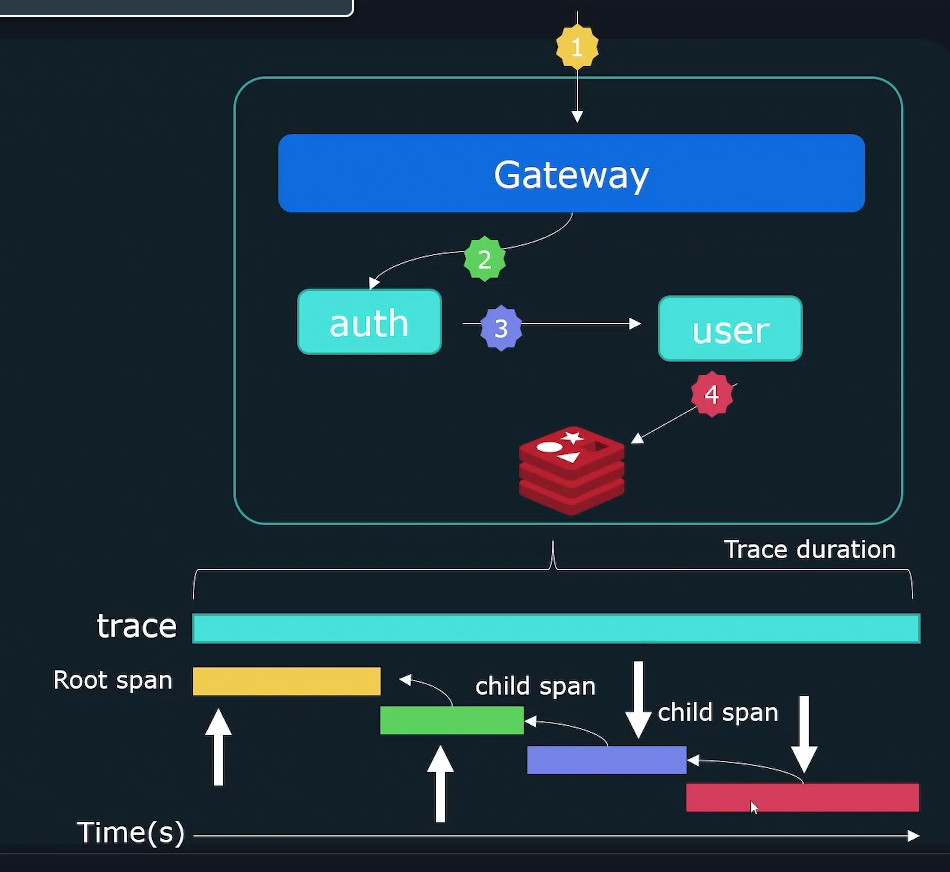
Traces allow you to follow operations as they traverses through various systems & services.
So, we can follow an individual request and see it flow through our system hop by hop.
Traces help us connect the dots on how processes and services work together.

Each trace has a trace-id that can be used to identify a request as it traverses the system.
Individual events forming a trace are called spans.
Each span tracks the following:
- Start time
- Duration
- Parent-Id
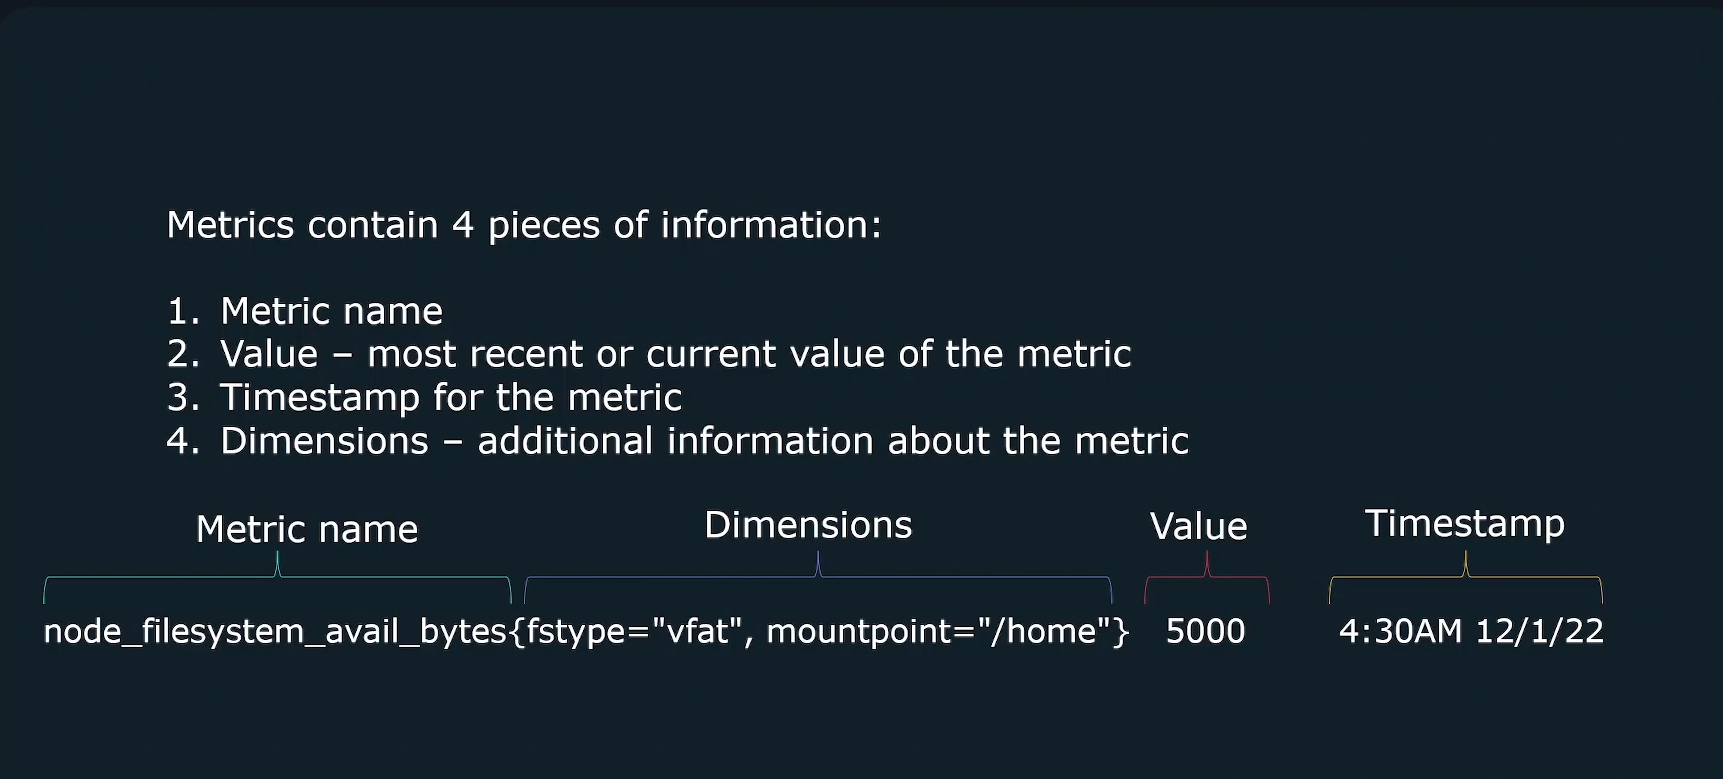
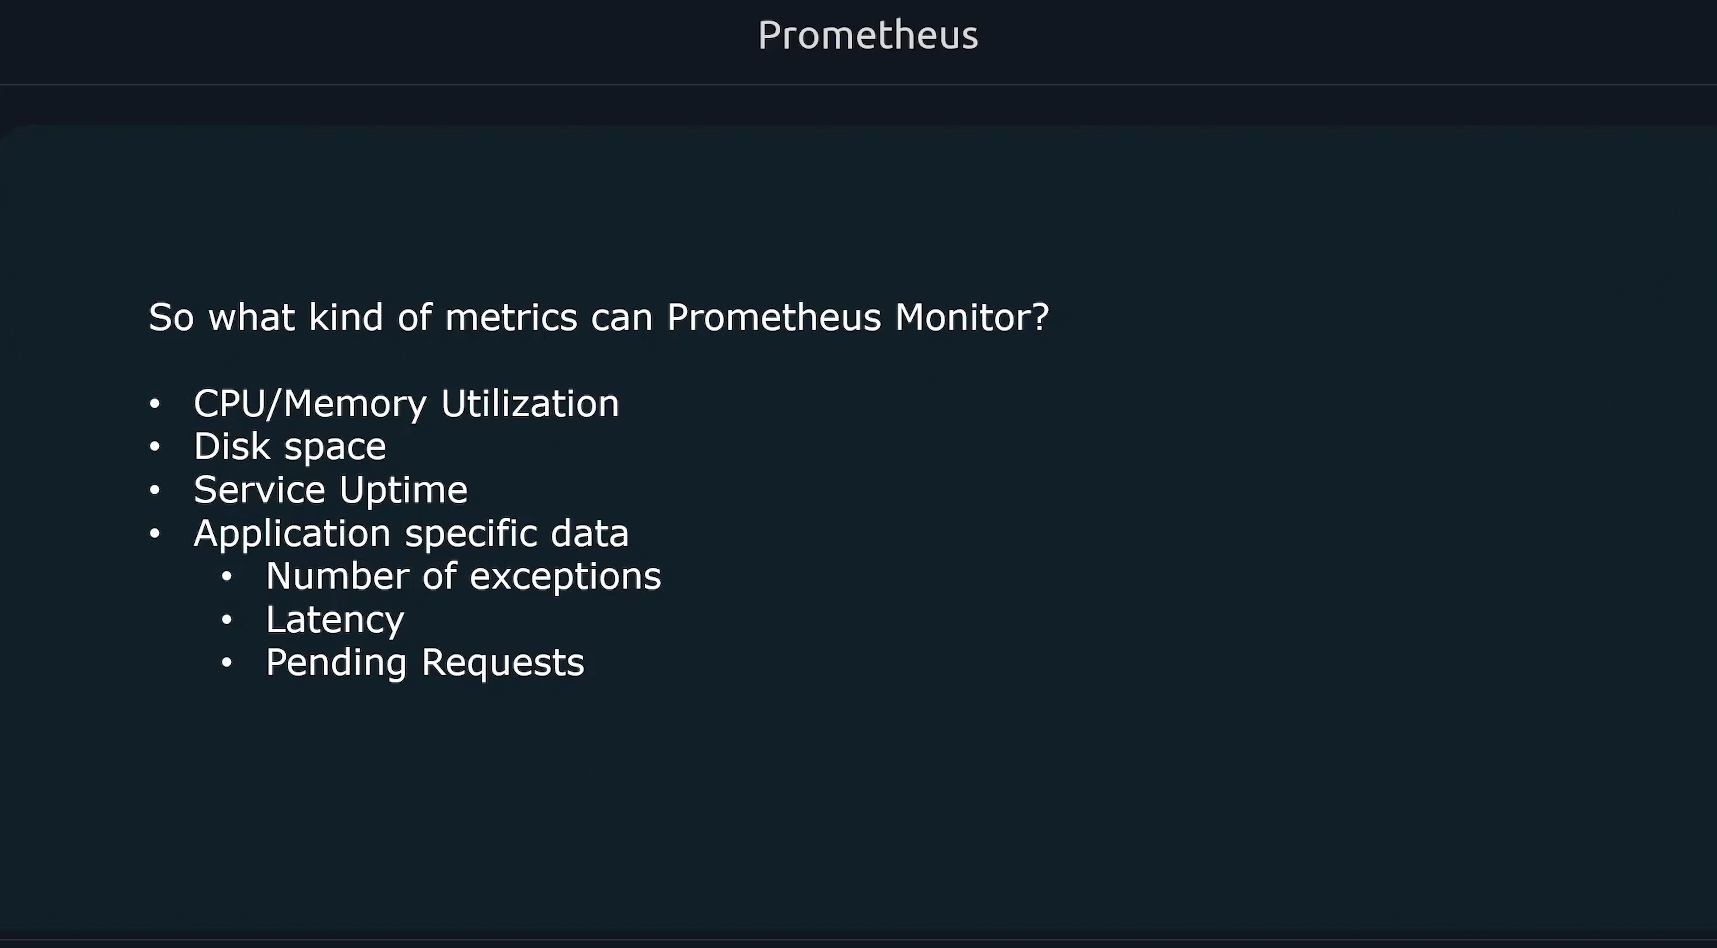
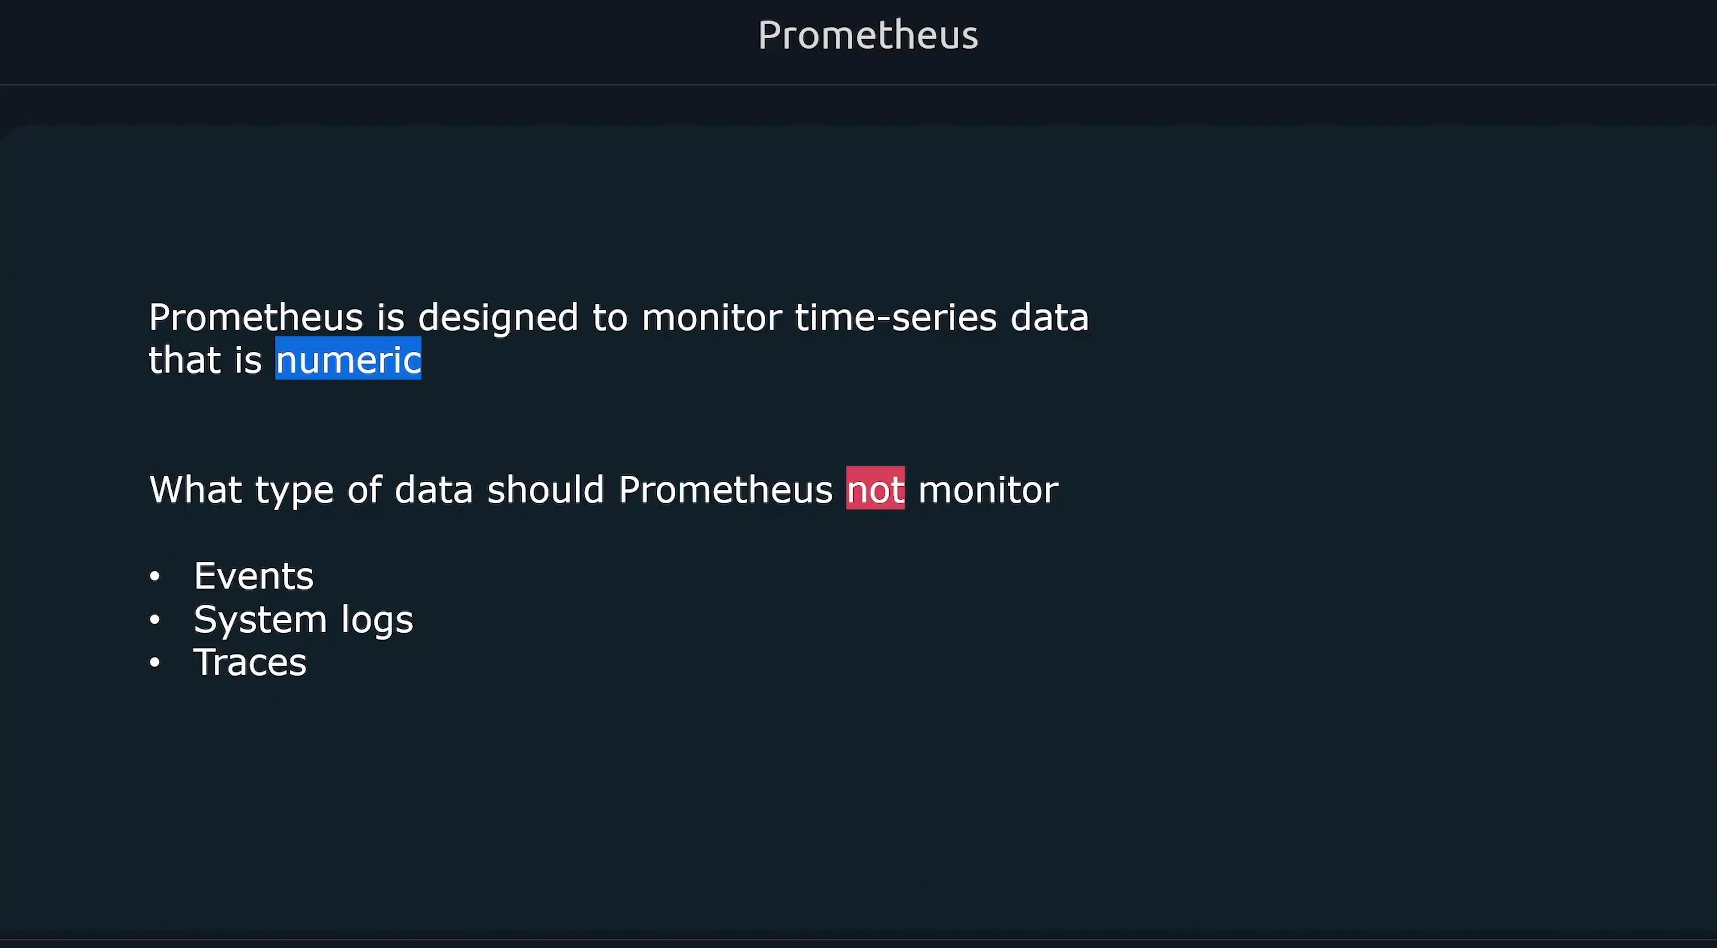
Metrics
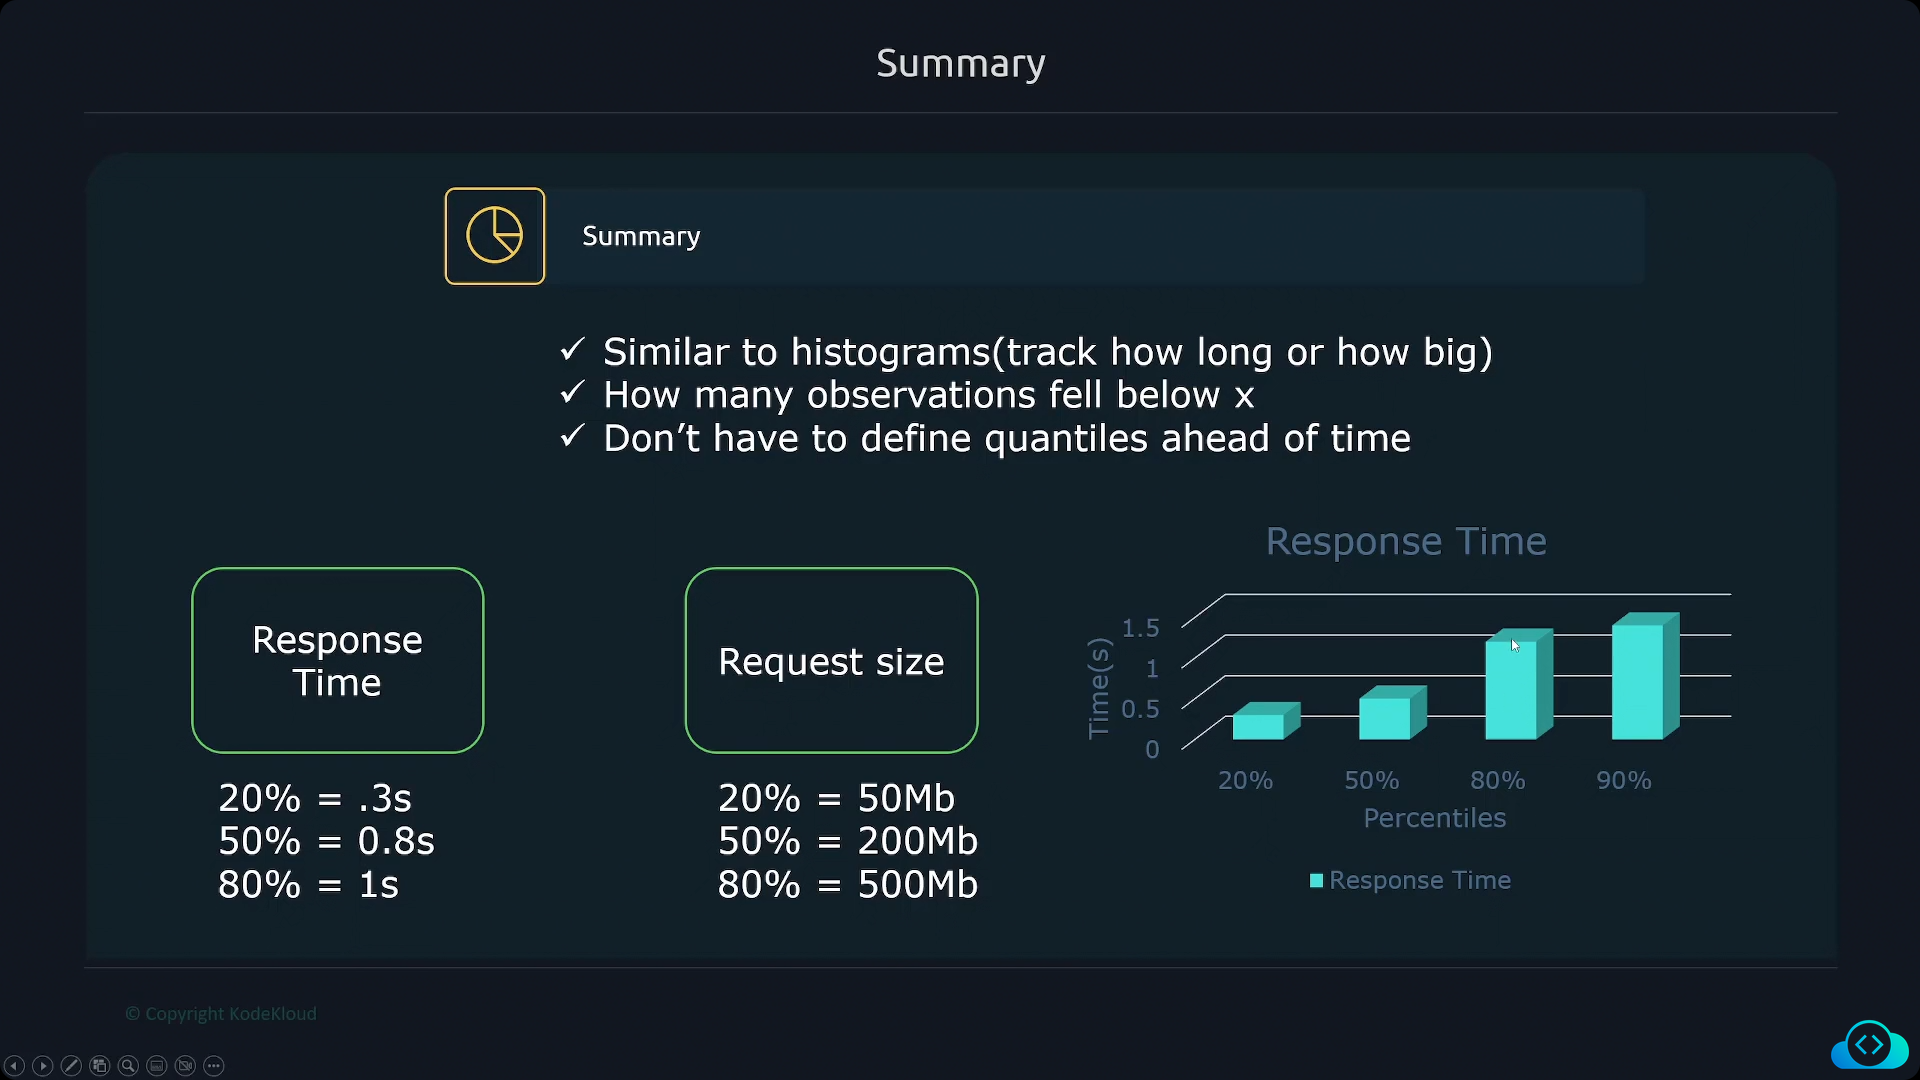
Metrics provide information about the state of a system using numerical values
- CPU Load
- Number of open files
- HTTP response times
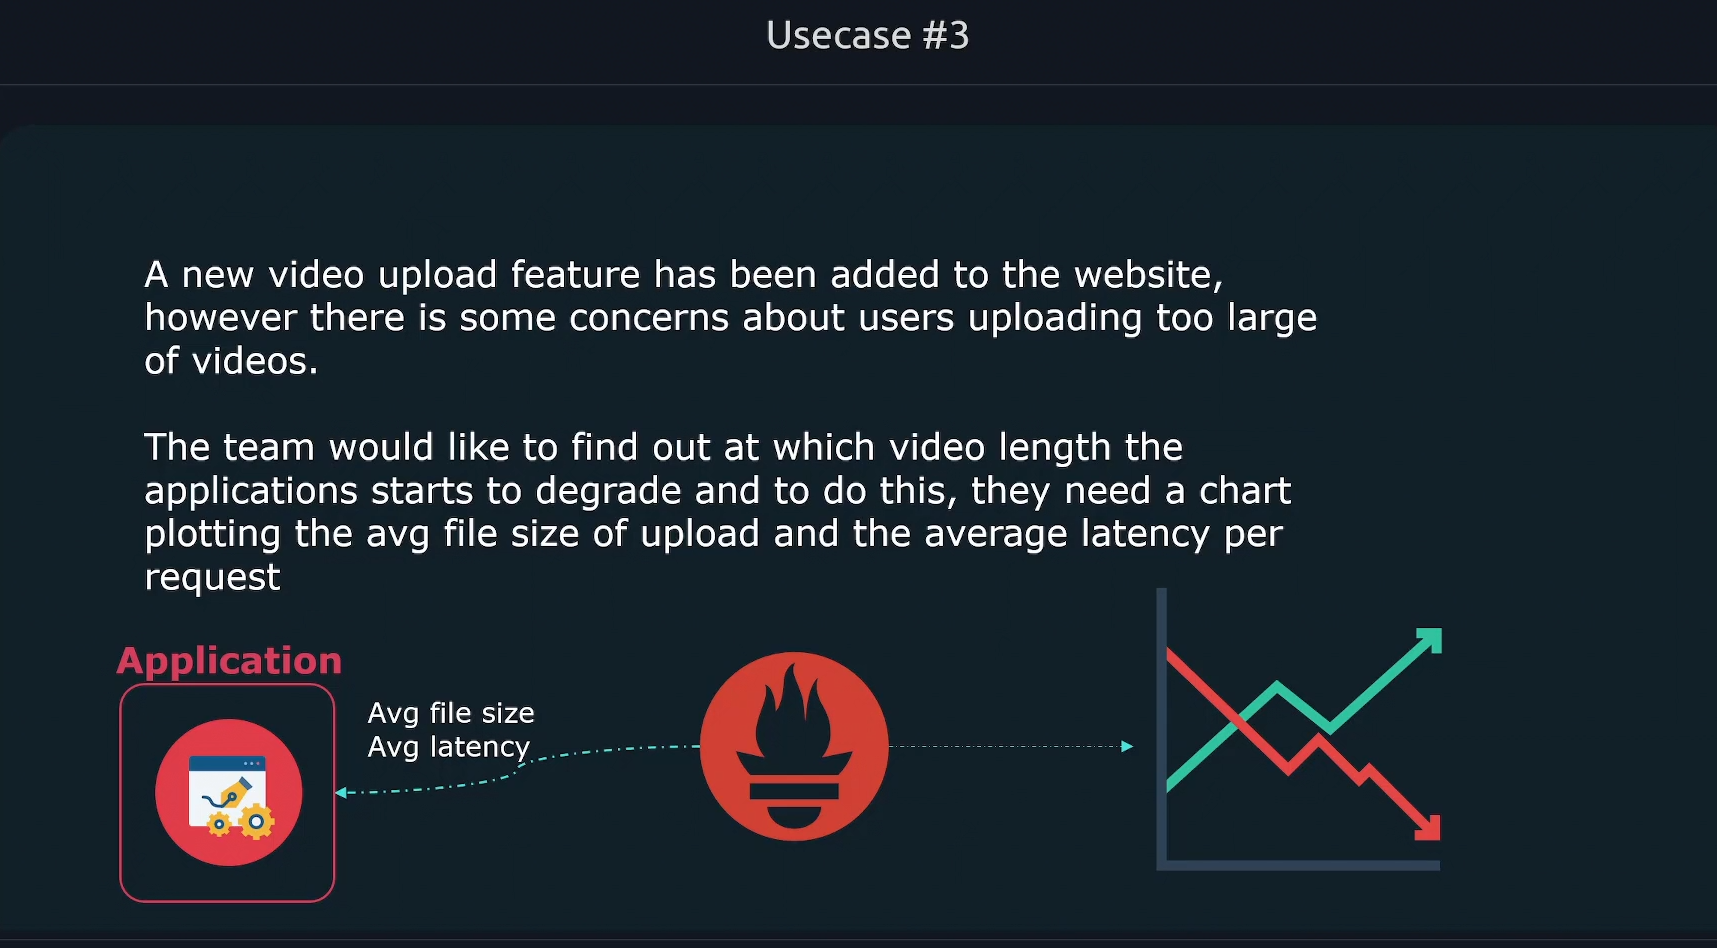
- Number of errors The data collected can be aggregated over time and graphed using visualization tools to identify trends over time.

Usecases
Prometheus is primarily written in Go Lang.
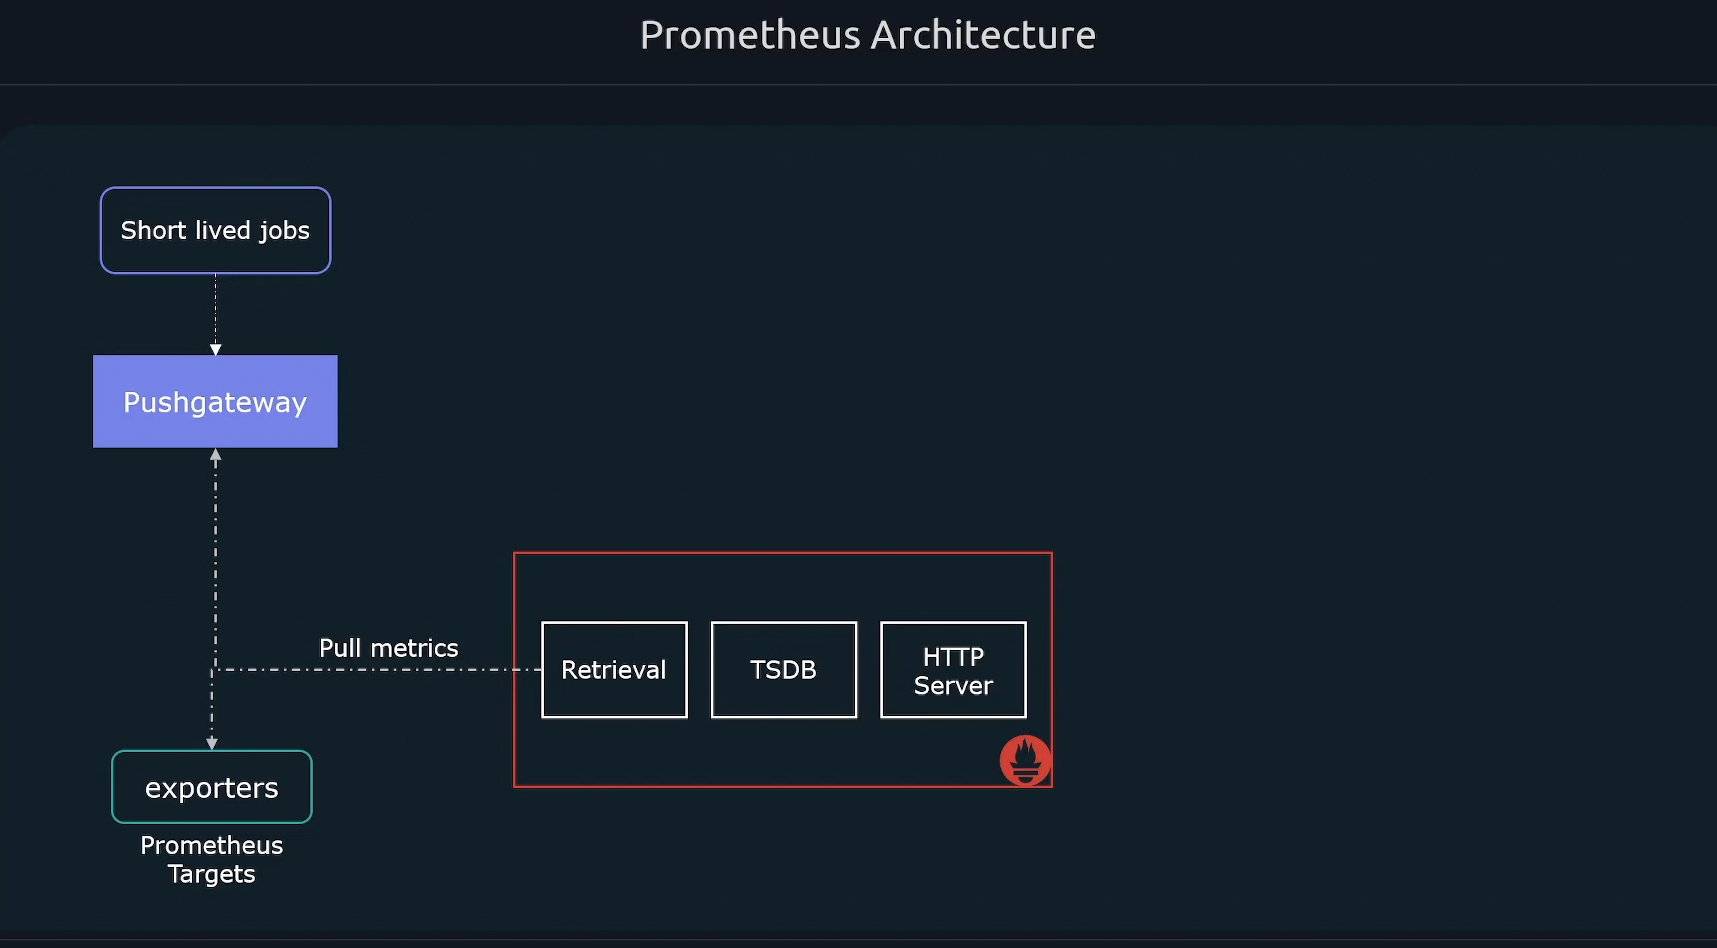
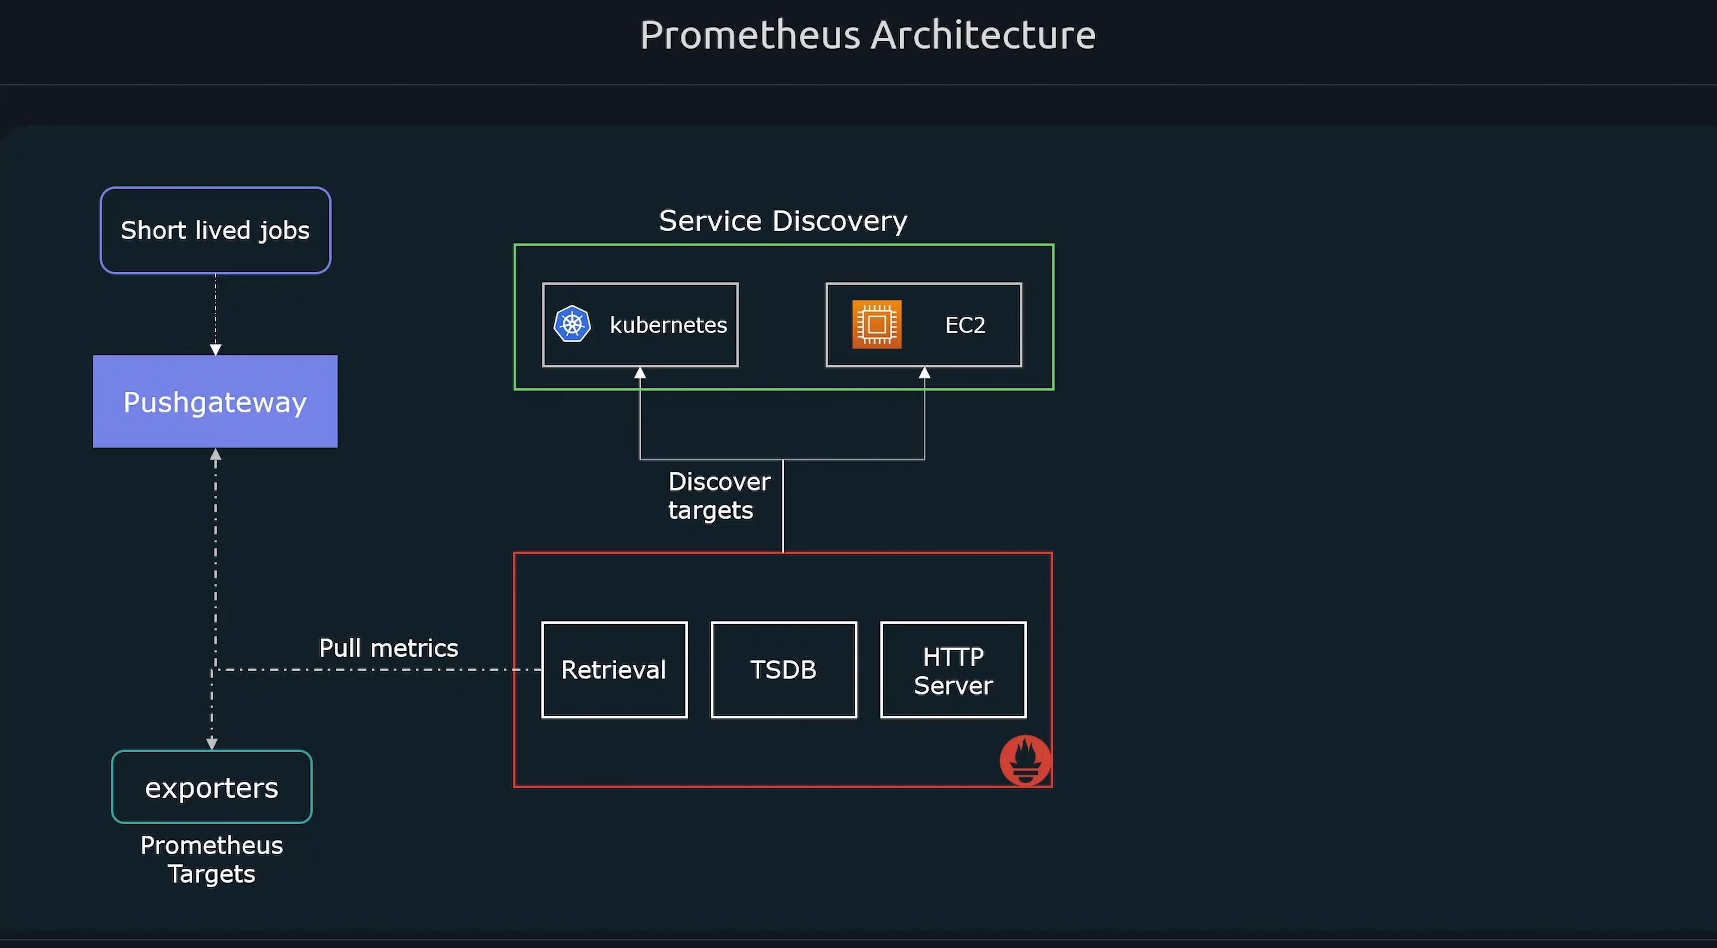
Prometheus Architecture
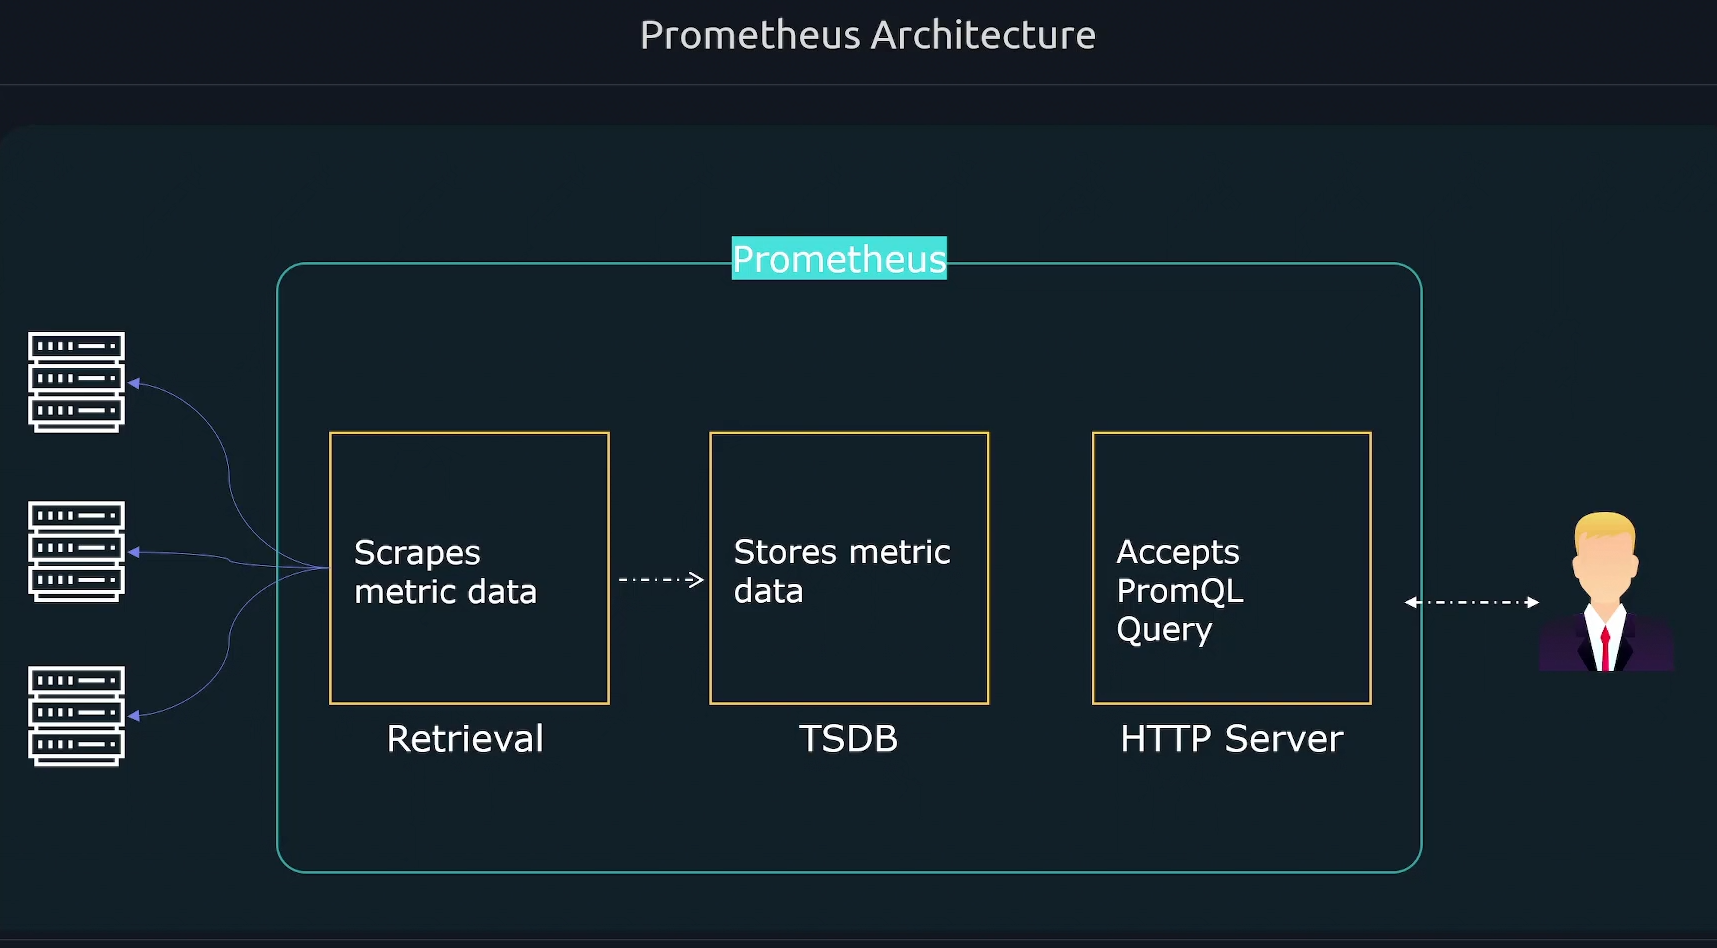
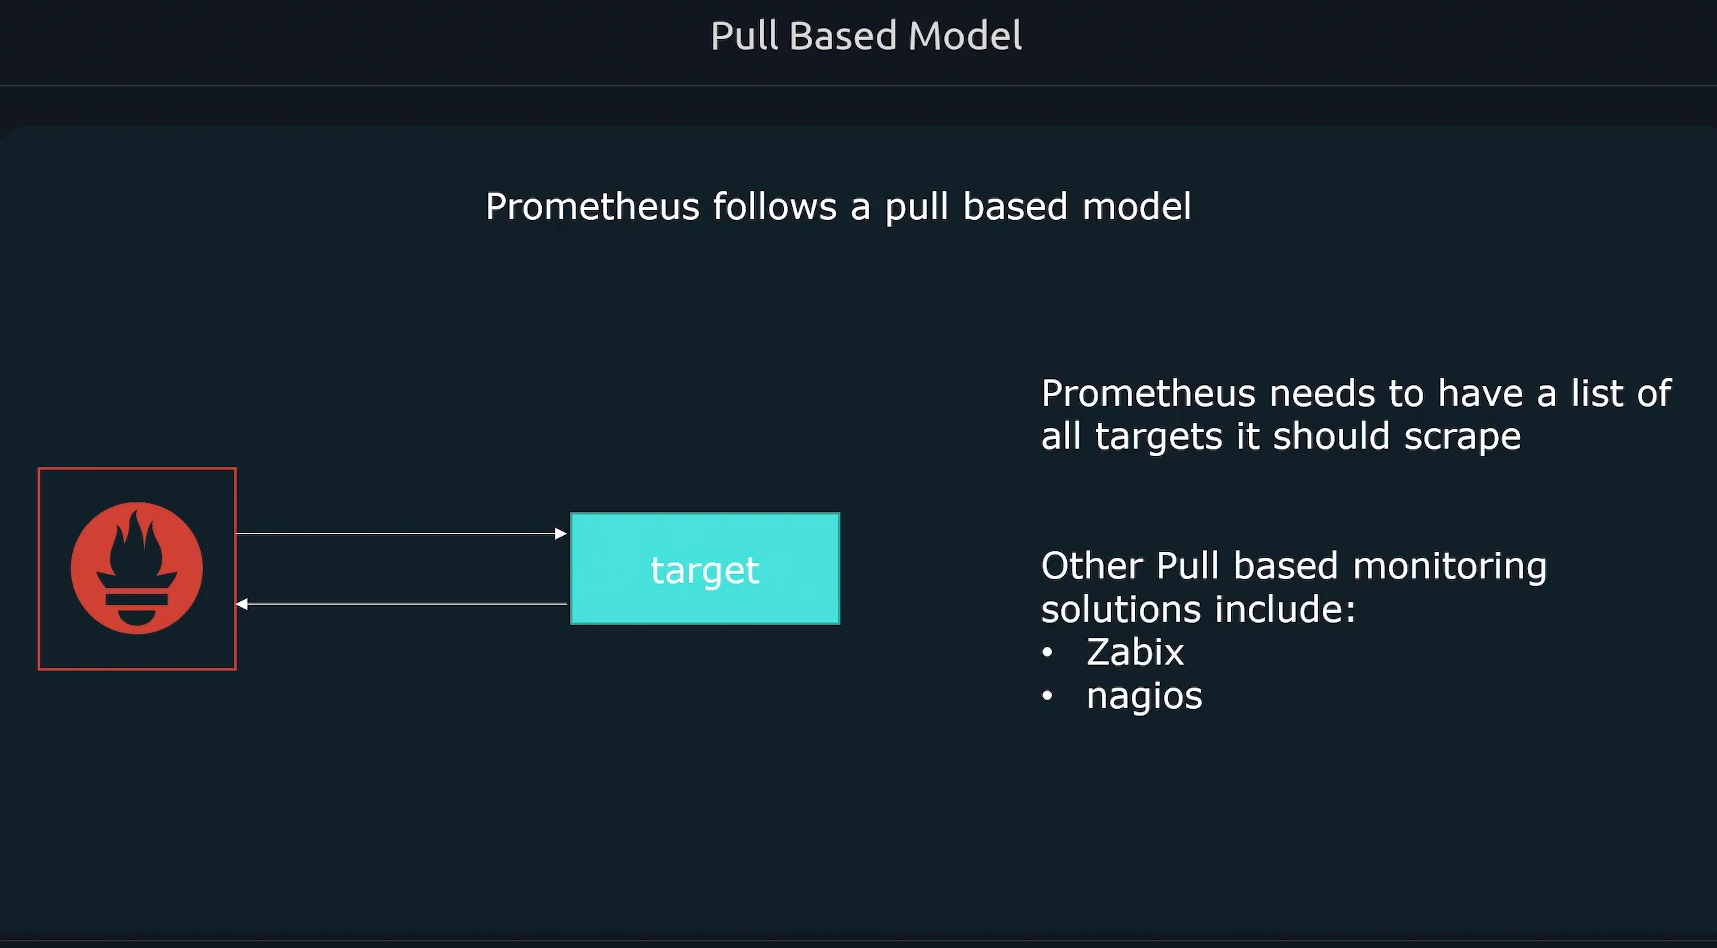
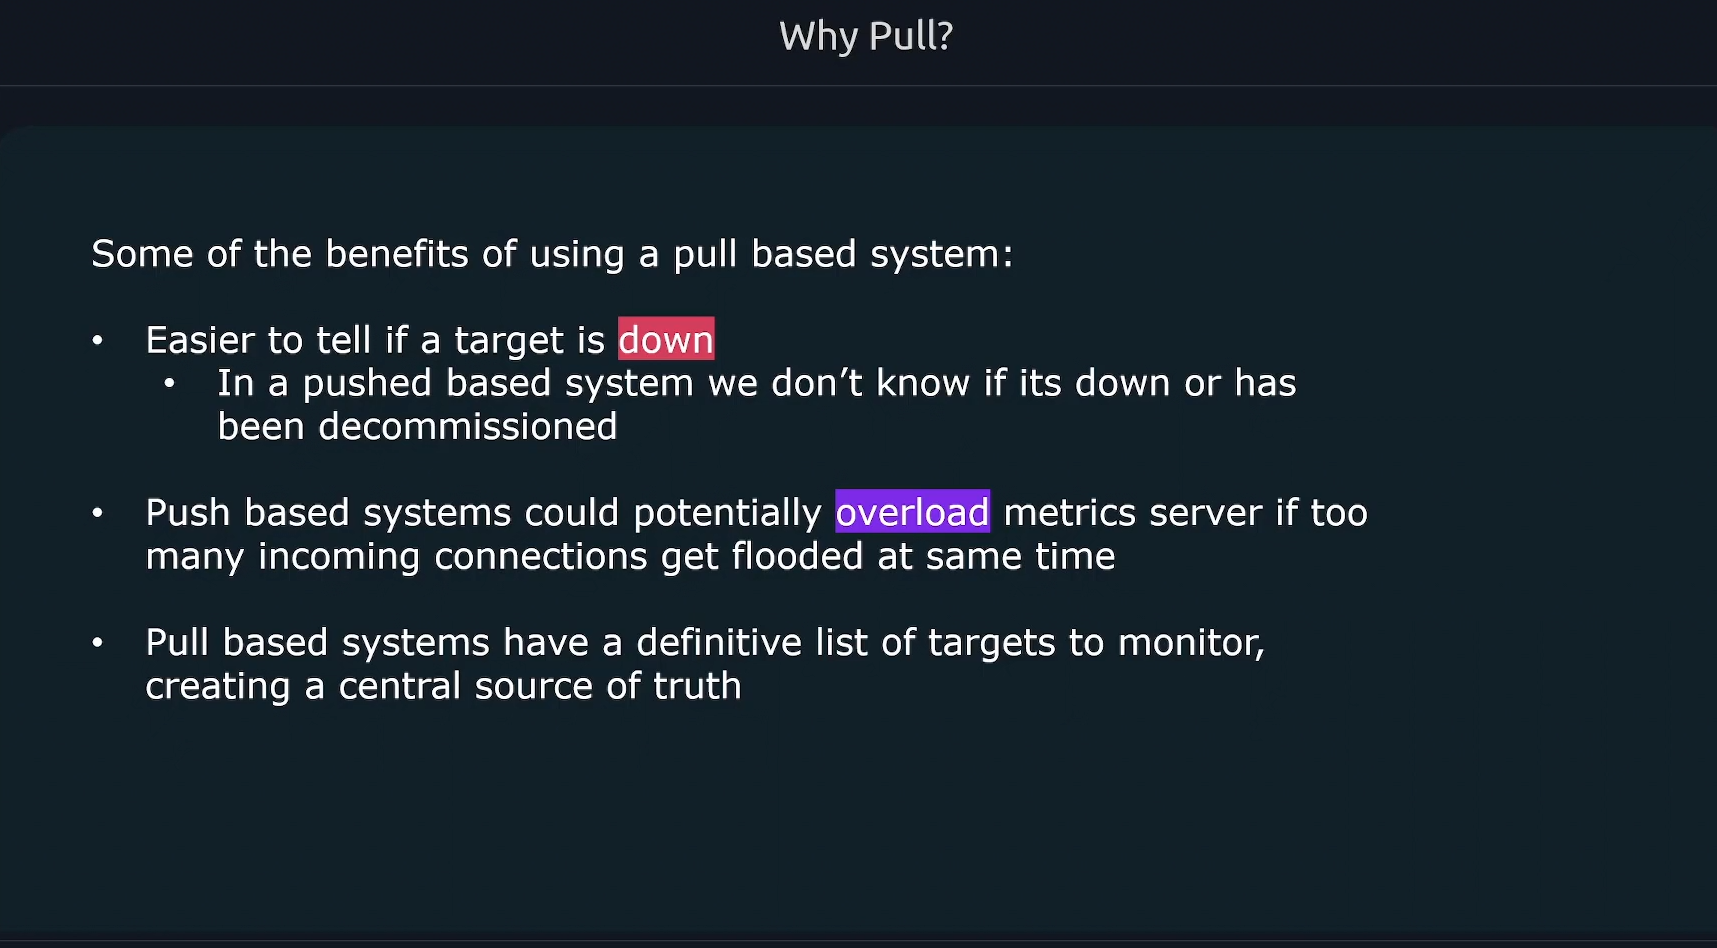
Prometheus Node exporters on each worker node captures the metrics and the prometheus hosted server runs a retrieval process to pull those metrics from exporters. So, Prometheus follow pull mechanism.
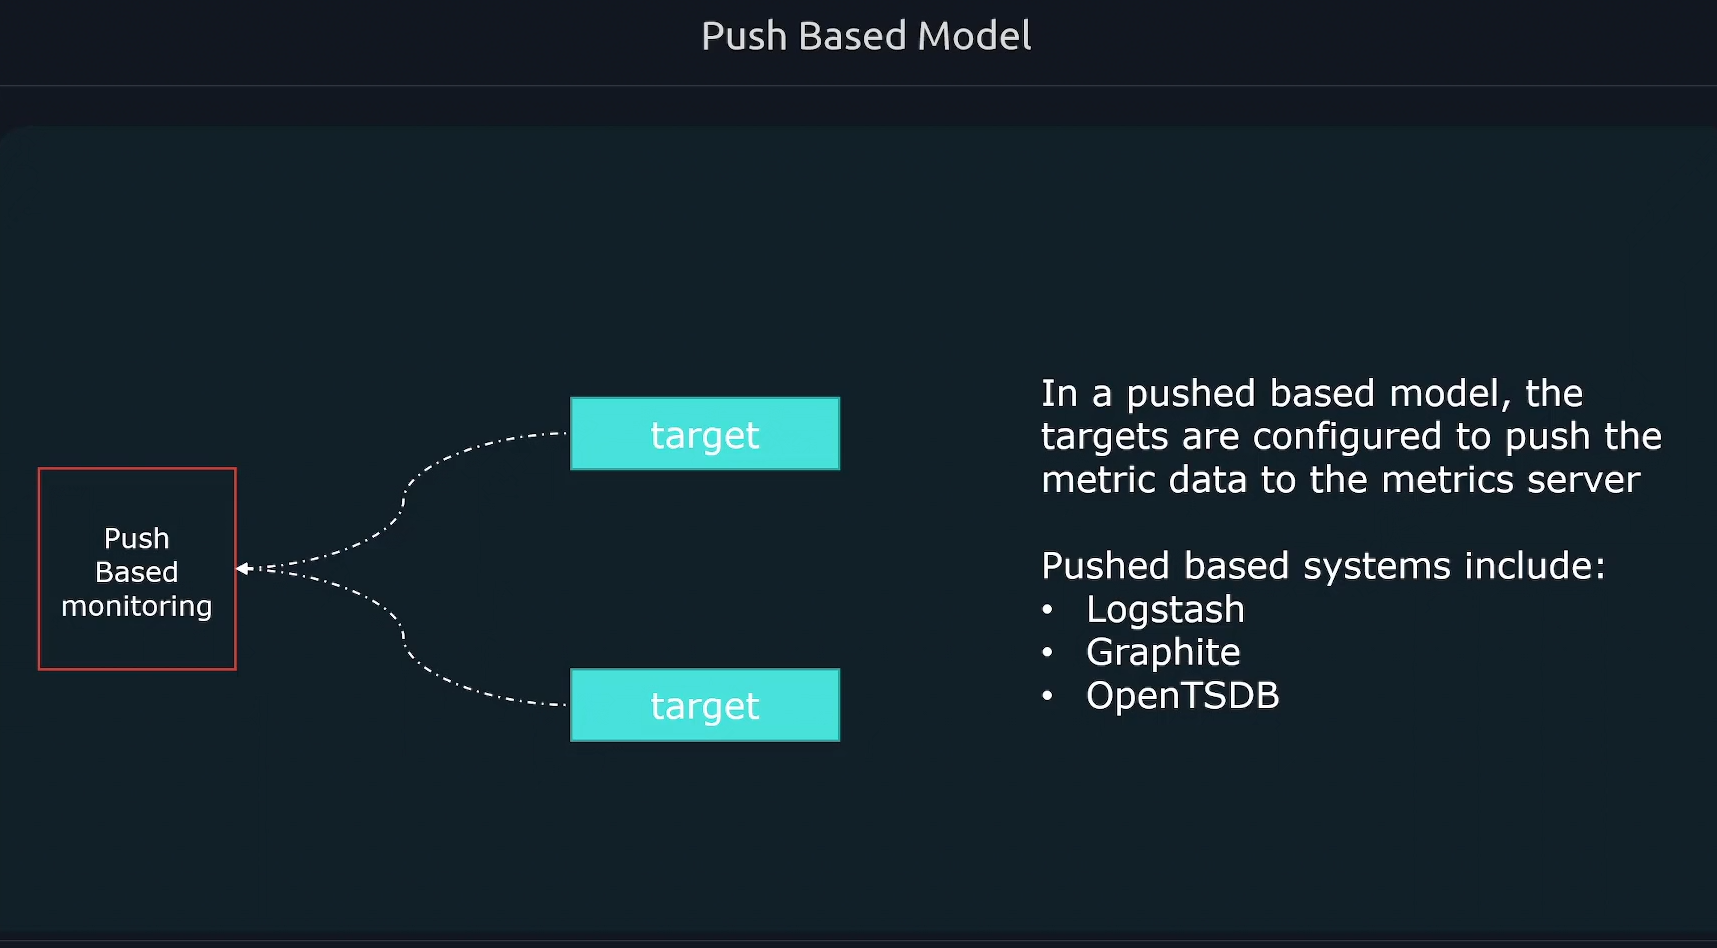
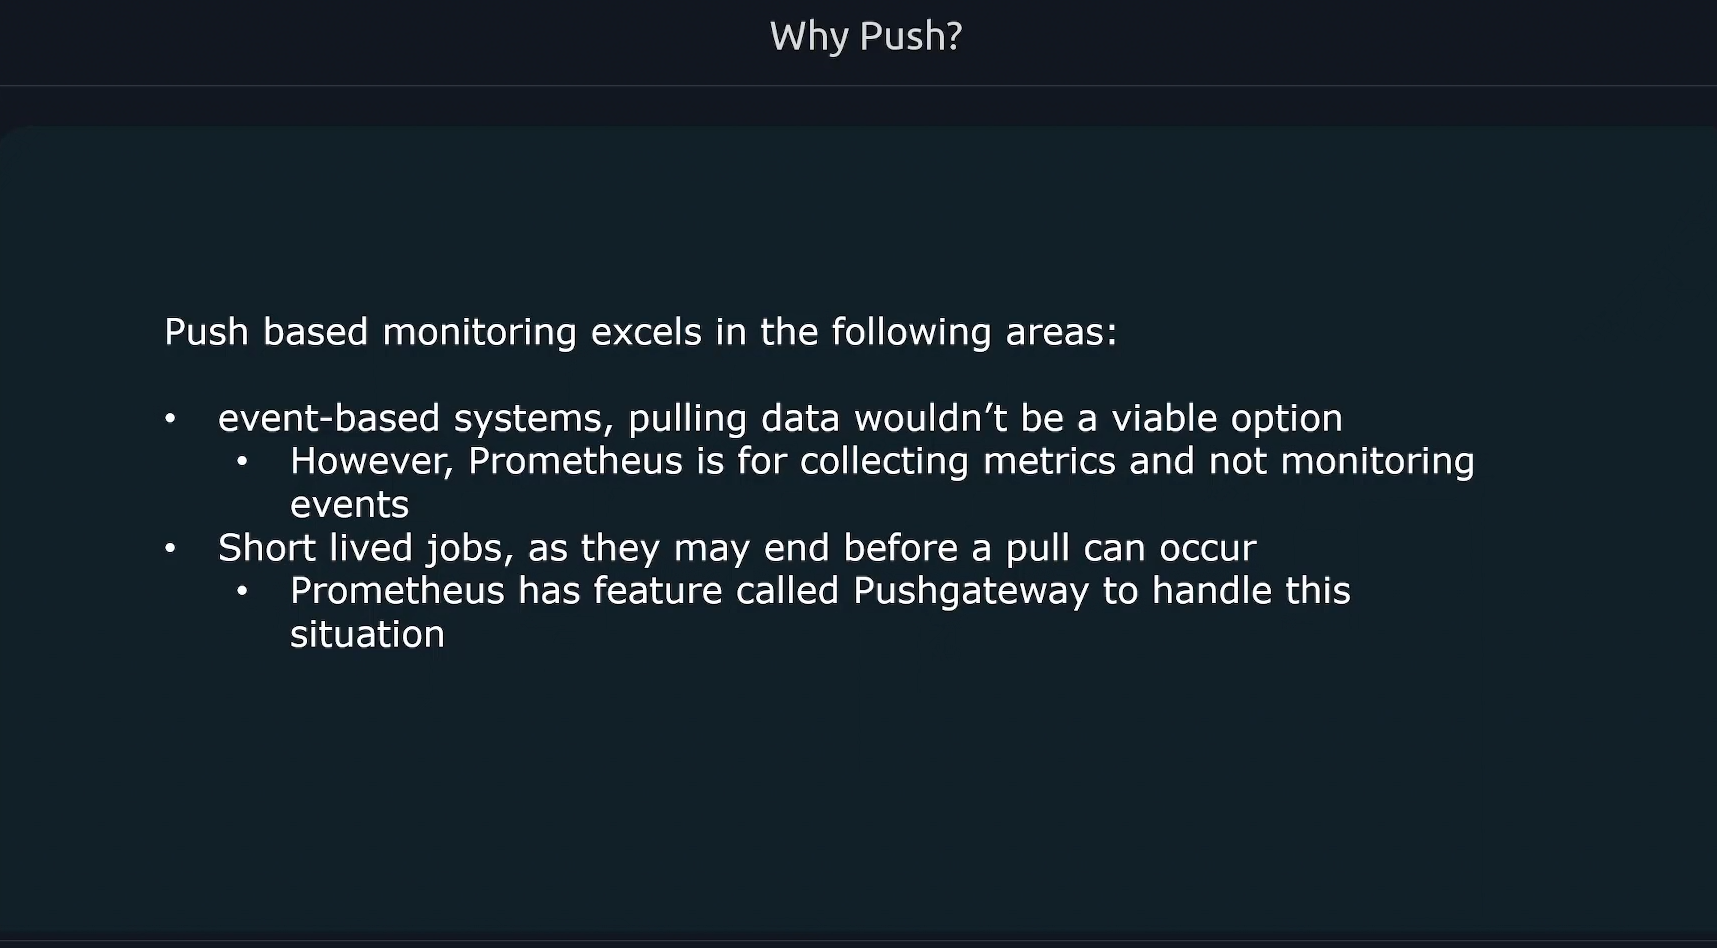
Whereas there were cases some shortlived jobs present and it being collected but the retrieval not able to pull them instantly. For this reason Node exporters push those shortlived metrics to Push Gateway. Then the retrieval collectes from the Push Gateway.
The target groups need to know by the prometheus to know where to retrieve the metrics. For this we use the Service discovery. There is also some case we can configure in the configuration file are the componets as targets by in Auto-Scaling Group/ Kubernetes like we need dynamic mechanism.
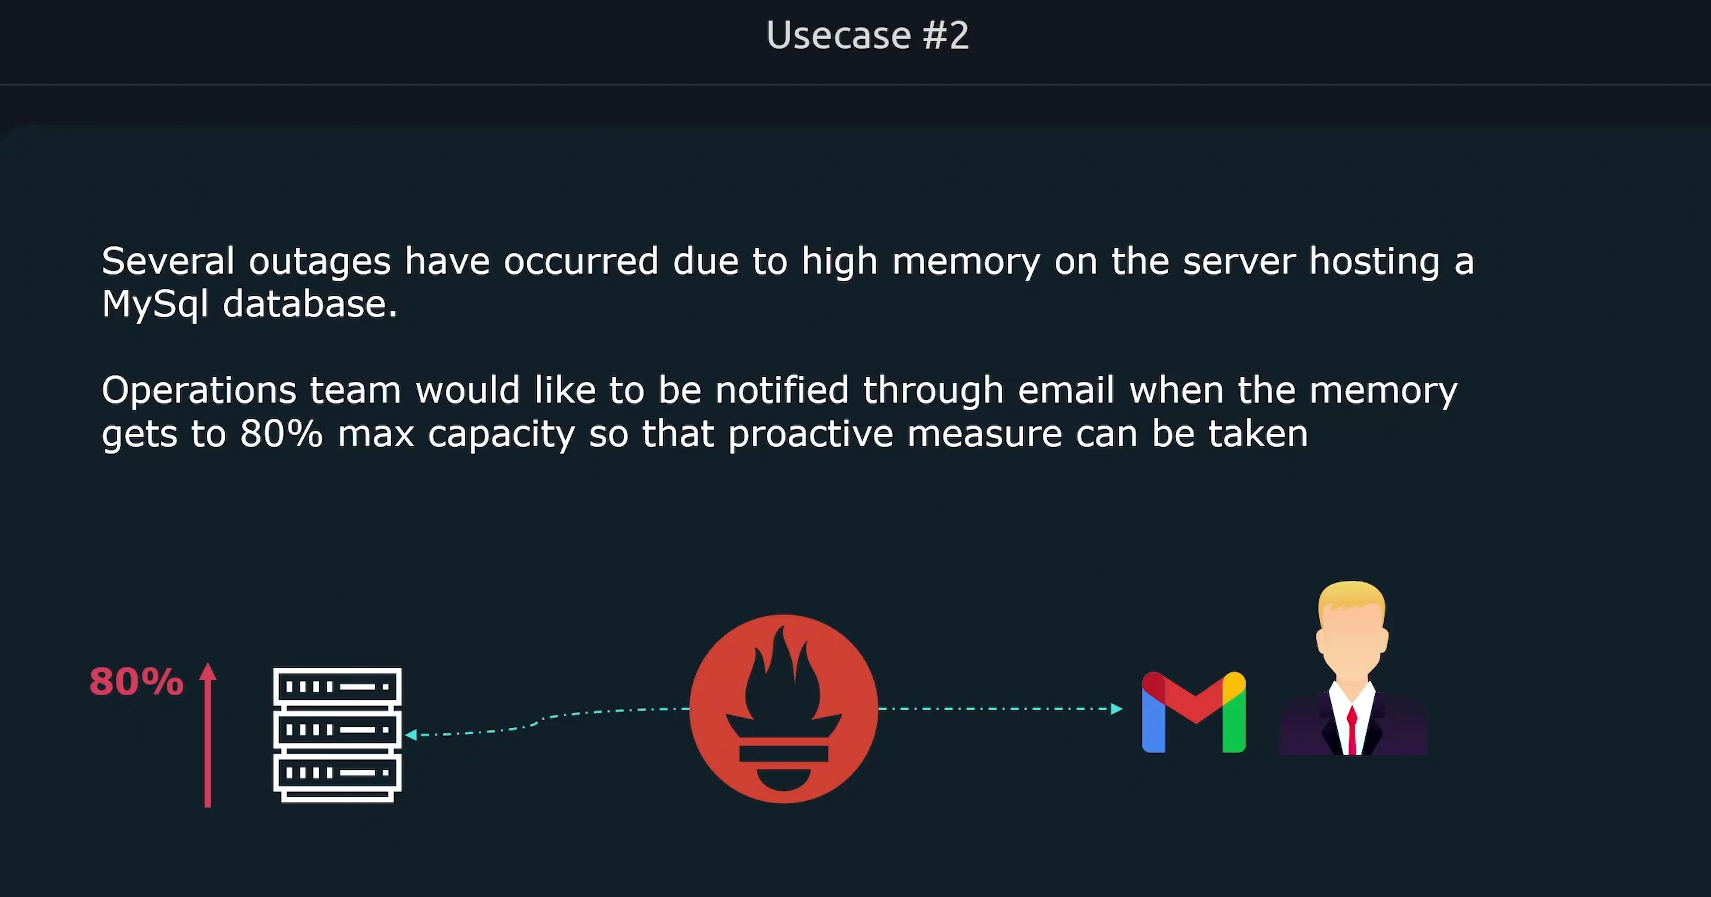
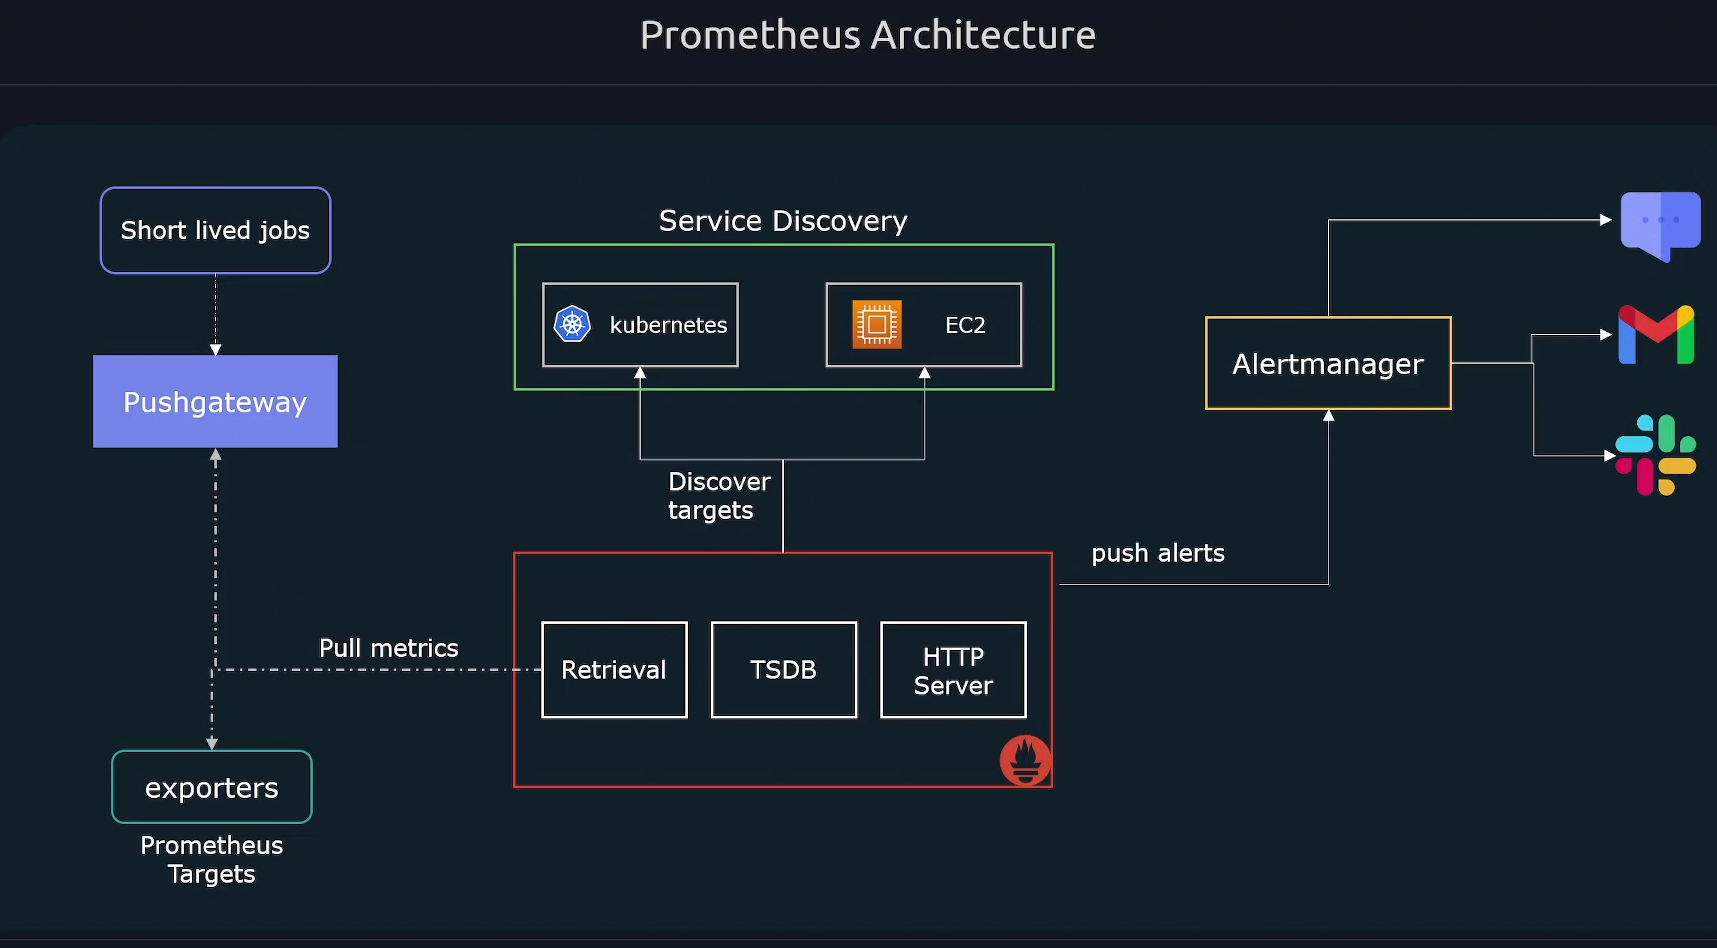
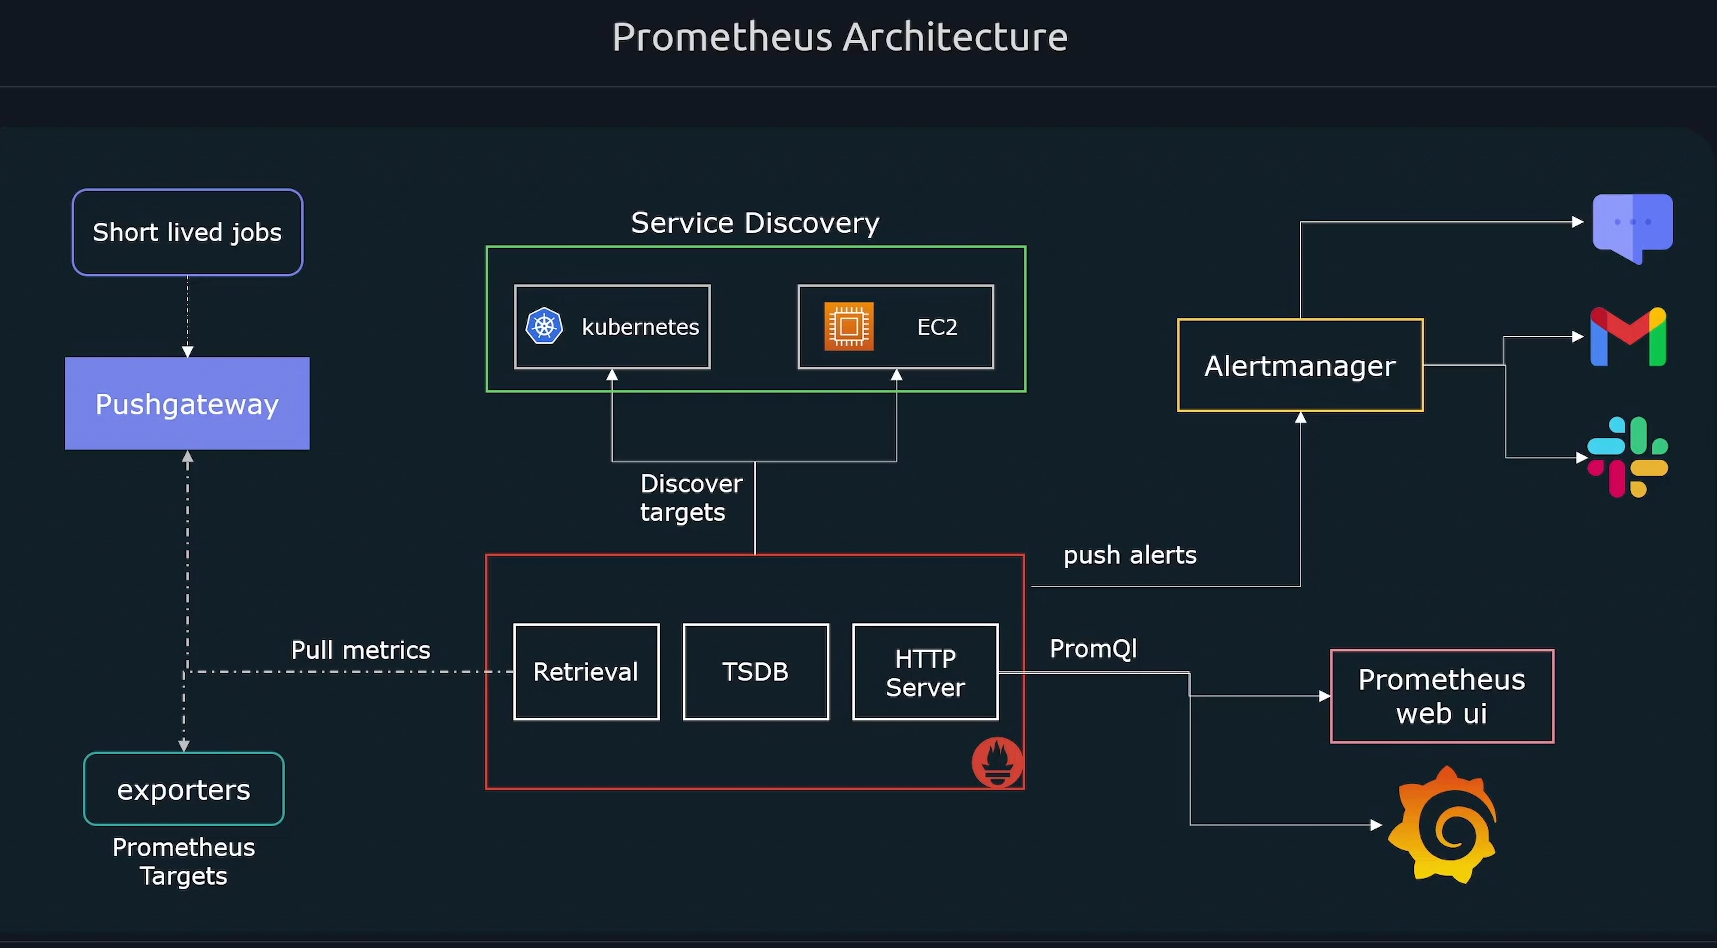
Alerting we can setup some threshold to trigger the alerts to send mails/ messages to slack.
For visualization we follow either Prometheus webpage or Grafana.
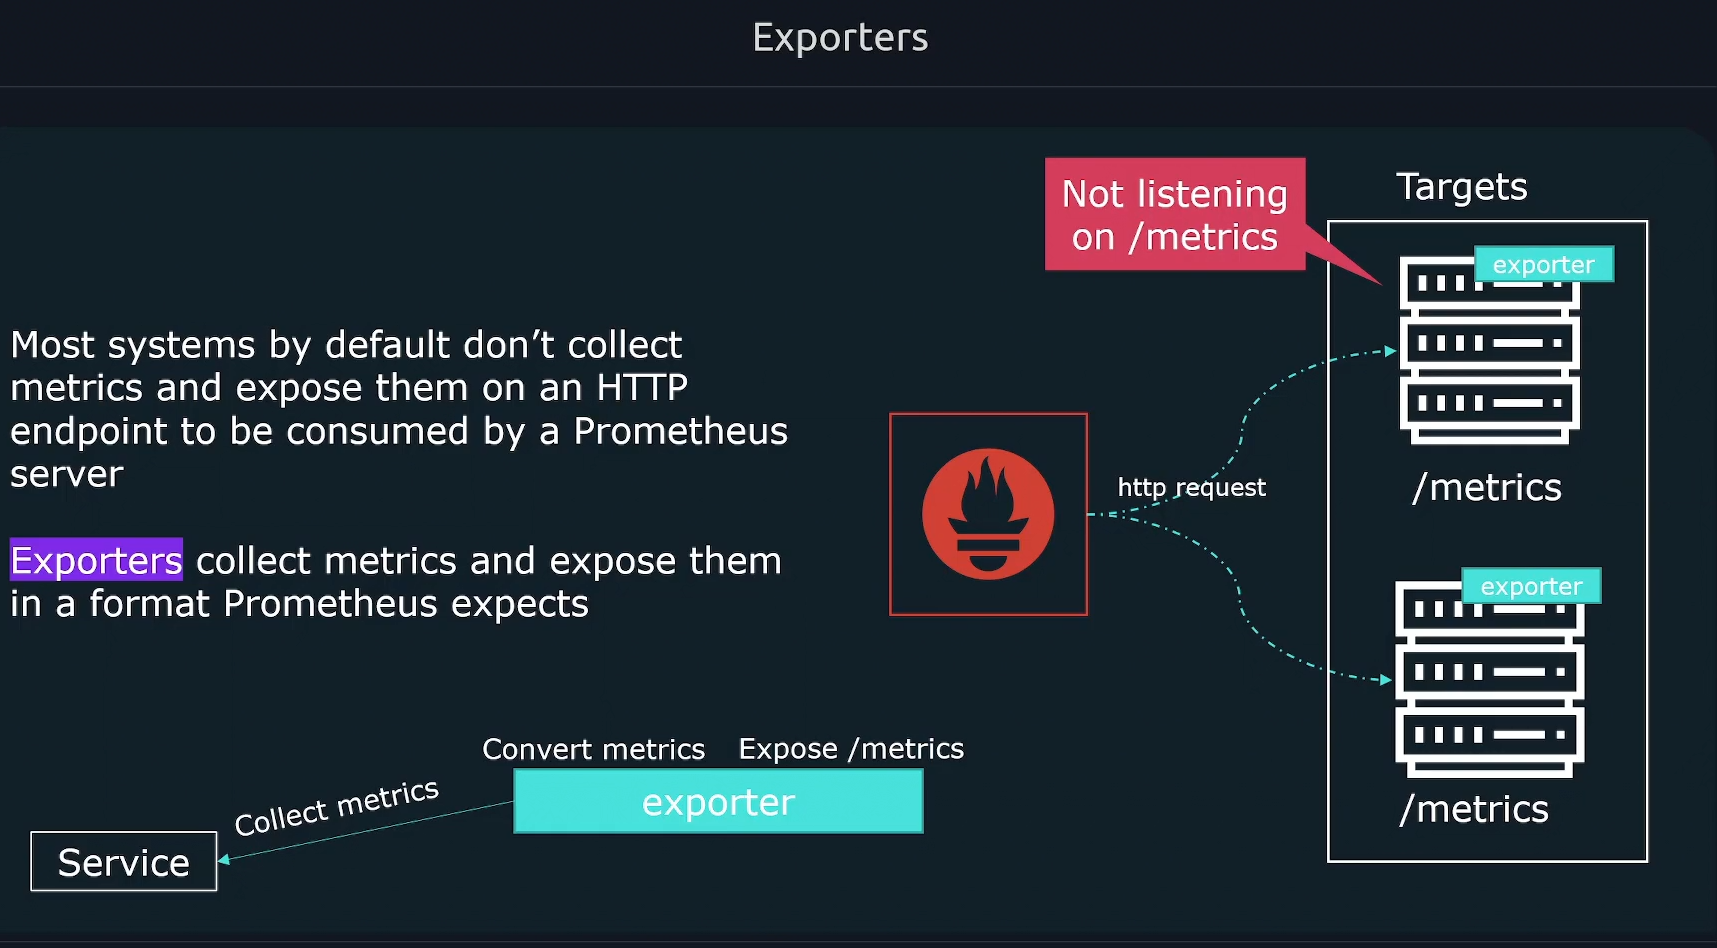
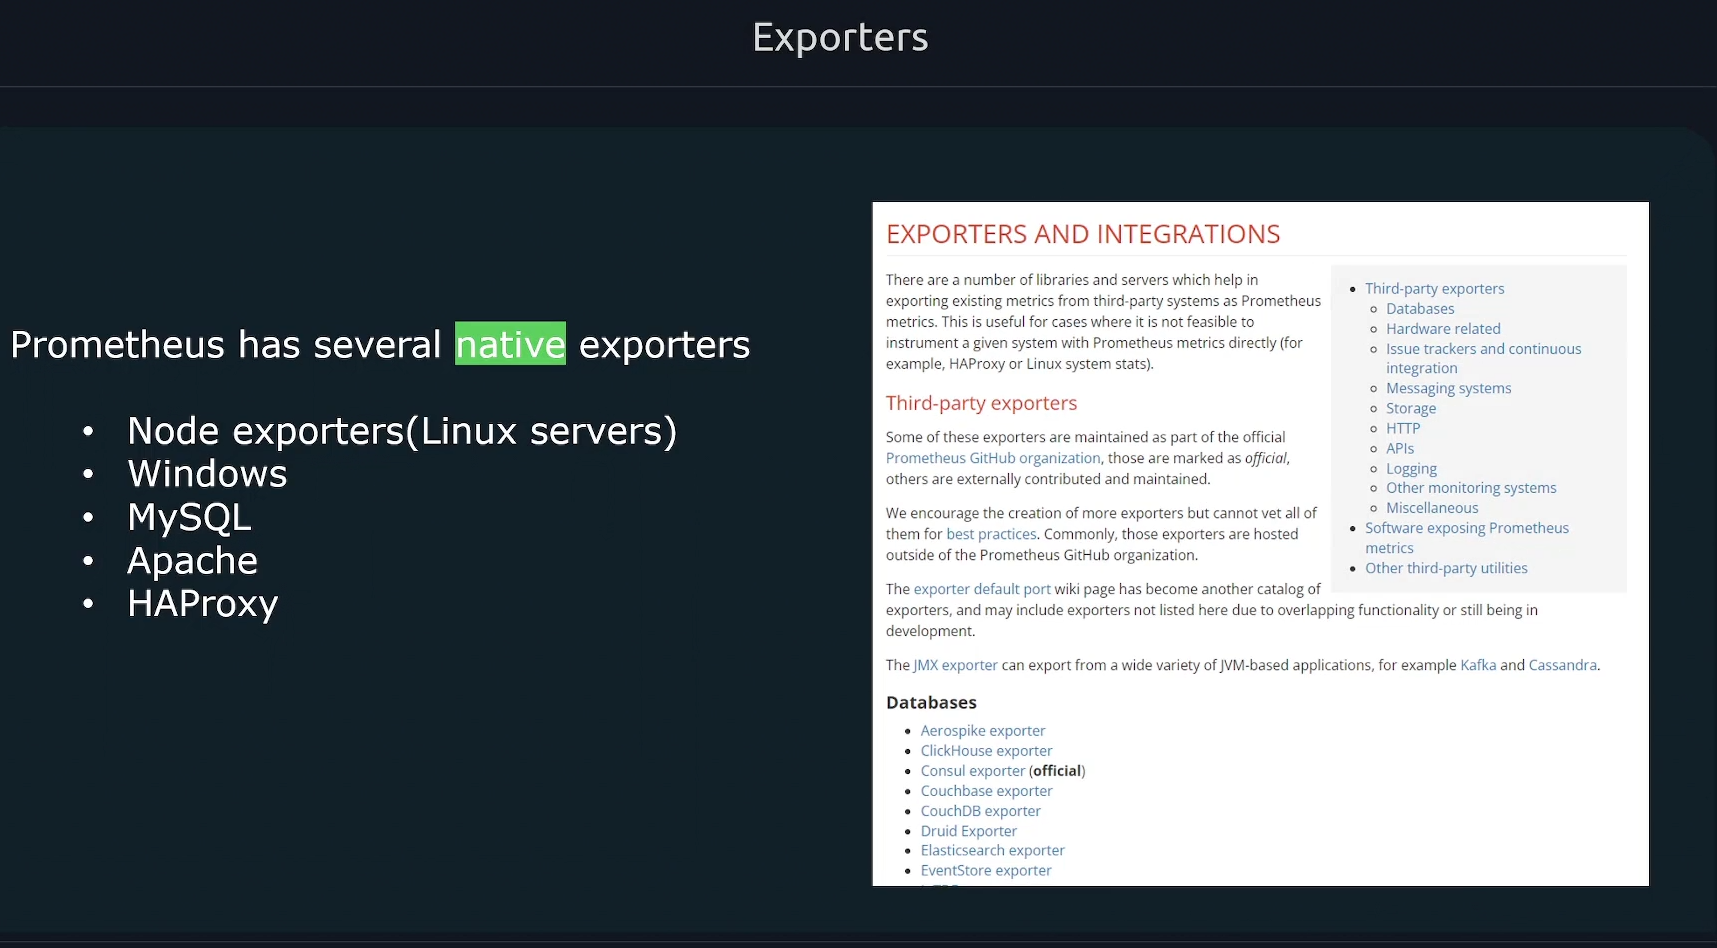
Node exporters
Installing Prometheus
Let's install the prometheus from the official docs
wget https://github.com/prometheus/prometheus/releases/download/v3.2.1/prometheus-3.2.1.linux-amd64.tar.gz- prometheus -> Application Executable
- prometheus.yml -> Configuration File
- promtool -> CMD Utility
tar -xvf
cd
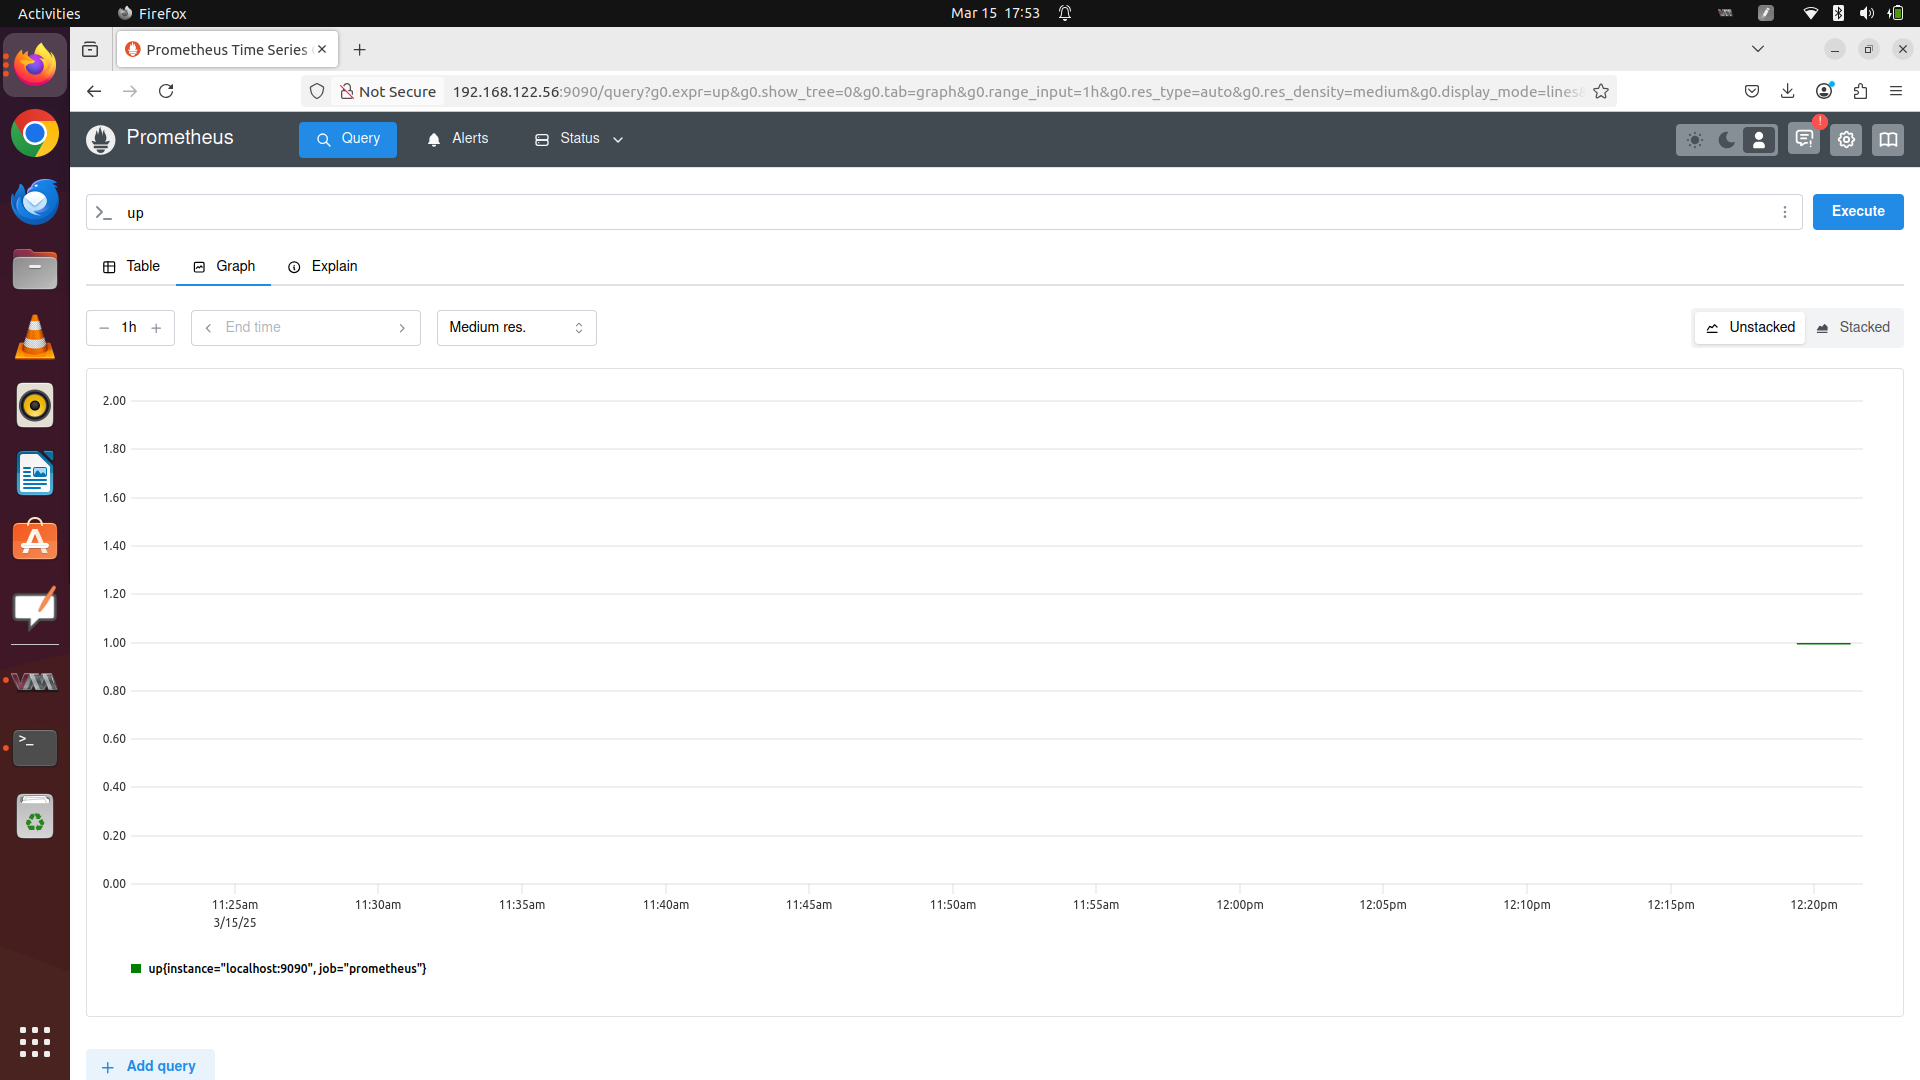
./prometheusNow open in the browser http://localhost:9090. It also monitors its hosted server too like cpu/mem/disk space.
Type UP in search bar of prometheus.
Here is the initial dashboard...!!!
Prometheus SystemD Unit
Running everytime on terminal is very poor approach.
Lets deploy it in the Linux machine as Systemd daemon.
Here we are creating a prometheus user for systemd service. It dont create the home directory and shell for it.
sudo useradd --no-create-home --shell /bin/false prometheuscreate the prometheus directory under etc directory to store the executables. In the /var/lib/prometheus directory we store all the collected metric data. Now we change the ownership for the directories created.
sudo mkdir /etc/prometheus
sudo mkdir /var/lib/prometheus
sudo chown prometheus:prometheus /etc/prometheus
sudo chown prometheus:prometheus /var/lib/prometheus
sudo cp -r data /var/lib/prometheus/
sudo chown -R prometheus:prometheus /var/lib/prometheus
Run the prometheus server on cmdline
sudo -u prometheus /usr/local/bin/prometheus --config.file /etc/prometheus/prometheus.yml --storage.tsdb.path /var/lib/prometheus --web.console.libraries=/etc/prometheus/prometheus.ymlcreate file sudo vim /etc/systemd/system/prometheus.service with the content as for systemd daemon process setup for prometheus.
[Unit]
Description=Prometheus
Wants=network-online.target
# startup after network is up
After=network-online.target

[Service]
User=prometheus
Group=prometheus
Type=simple
# normally we want to start the server usedto on cmdline
ExecStart=/usr/local/bin/prometheus \
  --config.file /etc/prometheus/prometheus.yml \
  --storage.tsdb.path /var/lib/prometheus  \
  --web.console.libraries=/etc/prometheus/prometheus.yml

[Install]
# Start the service as part of normal system start-up, whether or not
# local GUI is active.
WantedBy=multi-user.target# reload systemd daemon
sudo systemctl daemon-reload
# start the daemon
sudo systemctl start prometheus
# enable to start on systemboot
sudo systemctl enable prometheus
# Check status
sudo systemctl status prometheusNode Exporter
Download the binary and run in cmdline.
wget https://github.com/prometheus/node_exporter/releases/download/v1.9.0/node_exporter-1.9.0.linux-amd64.tar.gz
tar -xvf node_exporter-1.9.0.linux-amd64.tar.gz
cd node_exporter-1.9.0.linux-amd64/
./node_exporter
Deploying in systemd process.
# copy the binary
sudo cp node_exporter /usr/local/bin
# create node_exporter user
sudo useradd --no-create-home --shell /bin/false node_exporter
# change the ownership of binary executable copied to node_exporter
sudo chown node_exporter:node_exporter /usr/local/bin/node_exporter
Create systemd node_exporter service file /etc/systemd/system/node_exporter.service.
[Unit]
Description="Node Exporter"
Wants=network-online.target
After=network-online.target

[Service]
User=node_exporter
Group=node_exporter
Type=simple
ExecStart=/usr/local/bin/node_exporter --web.config.file=/etc/node_exporter/config.yaml --web.listen-address=:9100

[Install]
WantedBy=multi-user.target
Now start and enable the process
sudo systemctl enable node_exporter
sudo systemctl start node_exporter
sudo systemctl status node_exporter
Self-Signed Certs generation
Lets create self signed certs for the localhost running node_exporter process.
sudo openssl req -new -newkey rsa:2048 -days 365 -nodes -x509 -keyout node_exporter.key -out node_exporter.crt -subj "/C=US/ST=California/L=Oakland/O=MyOrg/CN=localhost" -addext "subjectAltName = DNS:localhost"update the file config.yaml in /etc/node_exporter/config.yaml file.
tls_server_config:
  cert_file: /etc/node_exporter/node_exporter.crt
  key_file: /etc/node_exporter/node_exporter.key
Reload the daemon processes and restart the node_exporter service. Now wait for sometime 5 to 10 mins to load all the things as self-signed certs loading takes time.
sudo systemctl daemon-reload
sudo systemctl restart node_exporter
sudo systemctl status node_exporter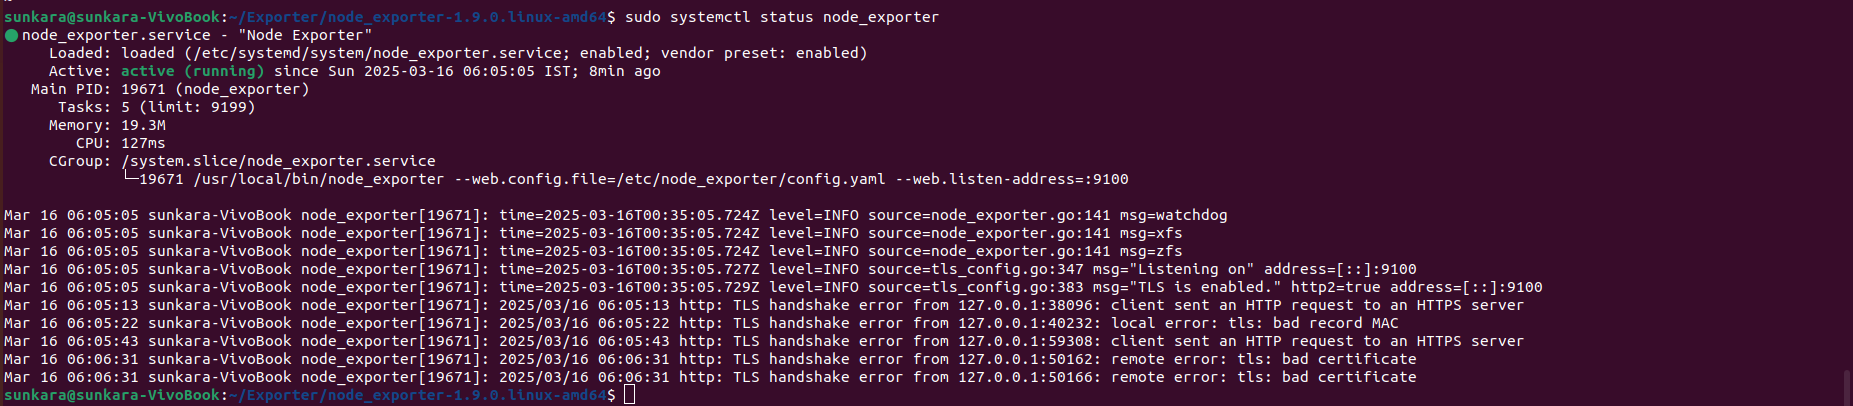
Now copy the cert file from node exporter to the prometheus server.
rsync -aurvz /etc/node_exporter/node_exporter.crt alex@worker:/etc/prometheus/In the /etc/prometheus/prometheus.yml file update the tls cert copied from node_exporter.
scrape_configs:
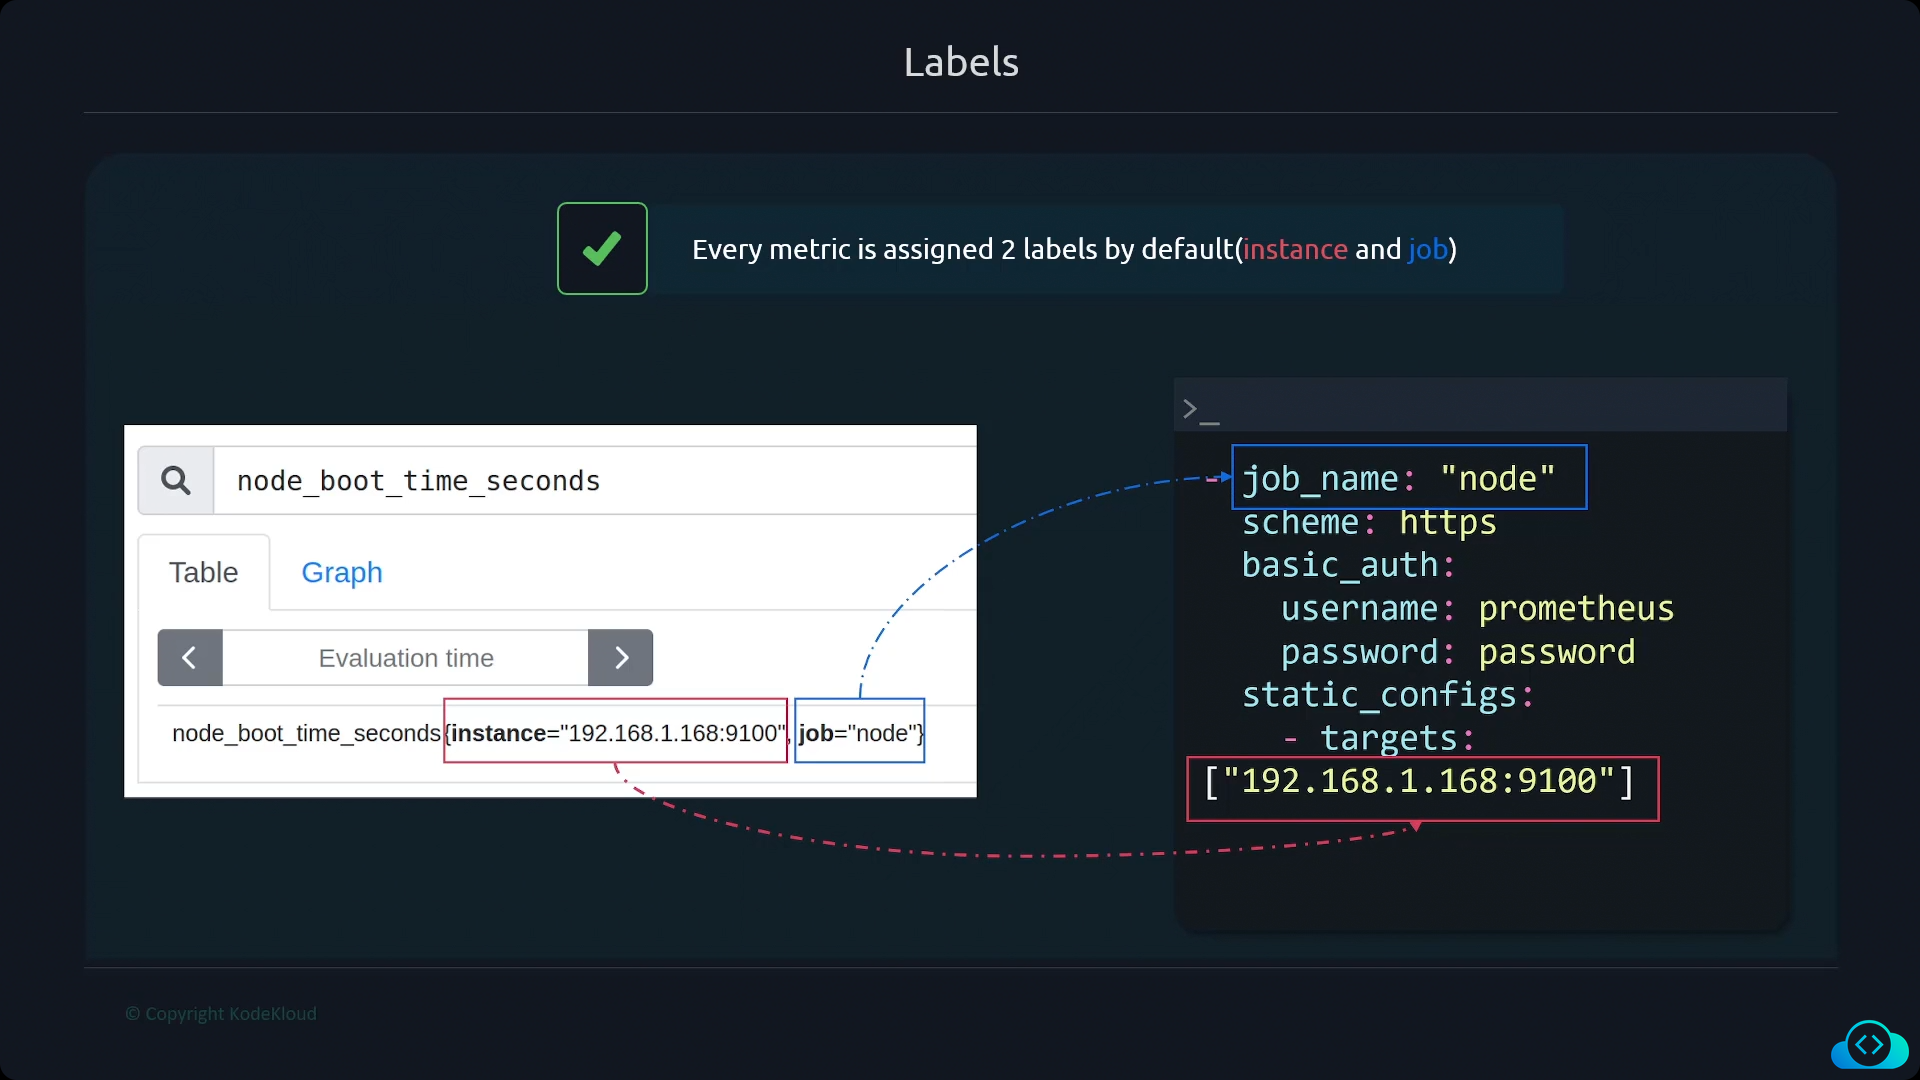
# The job name is added as a label `job=` to any timeseries scraped from this config.
- job_name: "prometheus"
# metrics_path defaults to '/metrics'
# scheme defaults to 'http'.
scheme: https
tls_config:
ca_file: /etc/prometheus/node_exporter.crt
# only need for self-signed certifcates
insecure_skip_verify: trueTo generate the hash for the passwords to authenticate.
Install apache2-utils
sudo apt install apache2-utilsCreate a password from this and it give the hash
htpasswd -nBC 12 "" | tr -d ":\n"In node exporter update the /etc/node_exporter/config.yaml file
basic_auth_users:
  prometheus:
Now access the prometheus page Check the targets the host server was down.
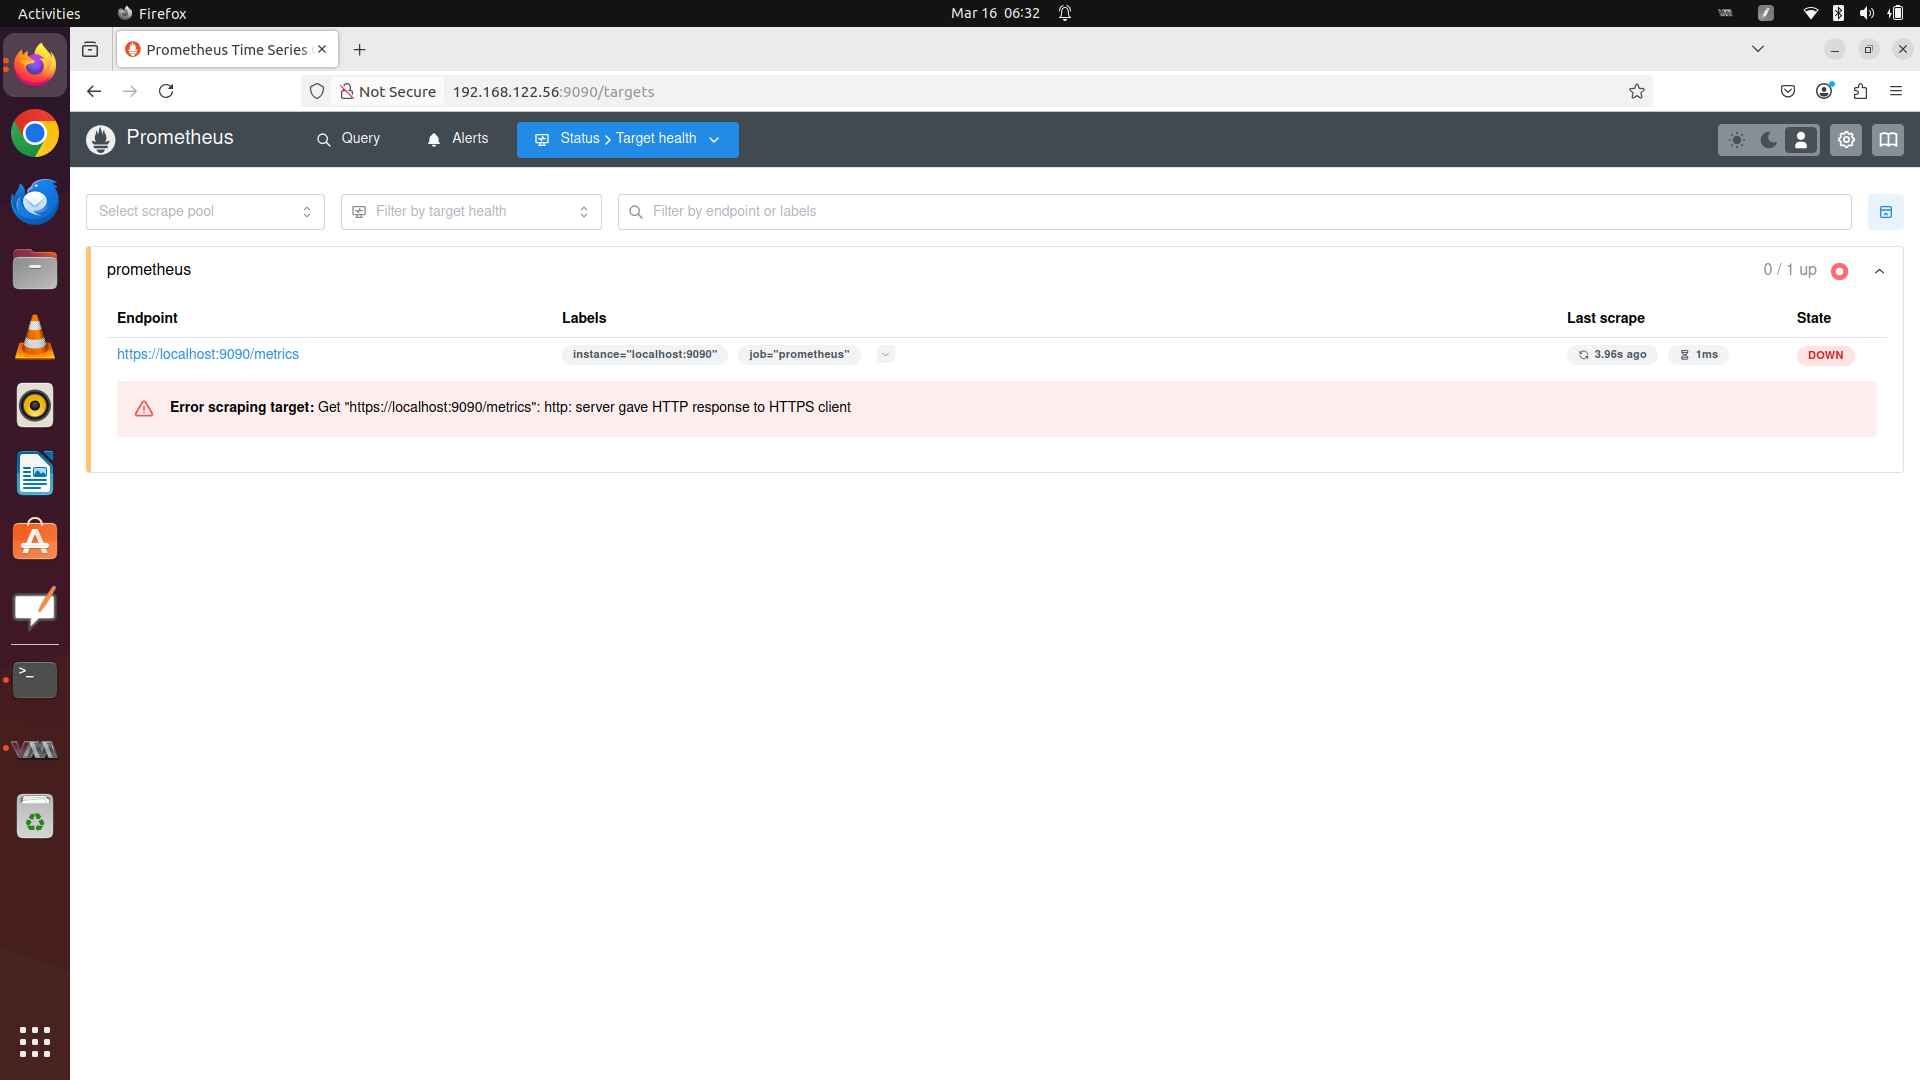
Now update the /etc/prometheus/prometheus.yml file username and password in plain text.
scrape_configs:
# The job name is added as a label `job=` to any timeseries scraped from this config.
- job_name: "prometheus"
# metrics_path defaults to '/metrics'
# scheme defaults to 'http'.
scheme: https
basic_auth:
username:
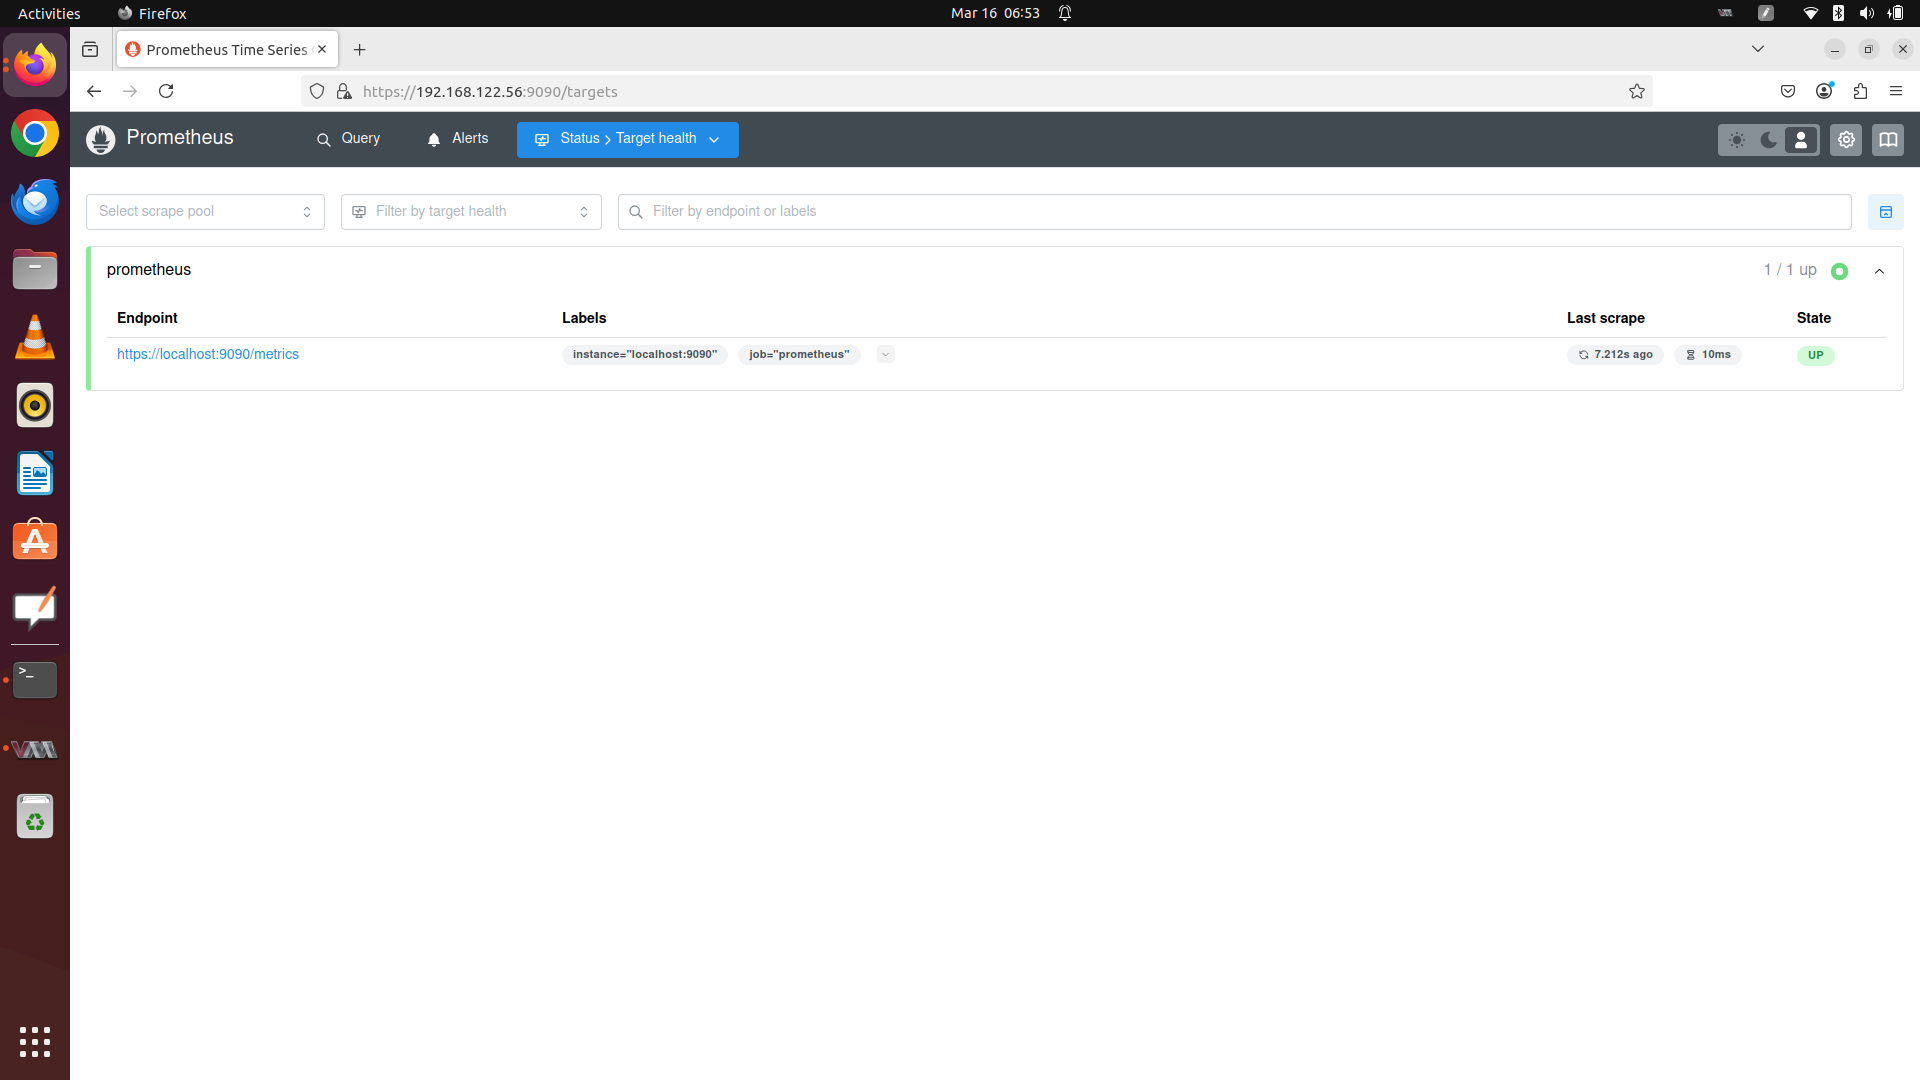
password:The Prometheus server running on http but node_exporter server running on https. Lets change the prometheus server to run in https
Update the prometheus daemon service /etc/systemd/system/prometheus.service add the web-config.yml file.
--web.config.file /etc/prometheus/web-config.yml \In the /etc/prometheus/web-config.yml file update the tls certs.
tls_server_config:
  cert_file: /etc/prometheus/example.com.crt
  key_file: /etc/prometheus/example.com.key
Try to restart the prometheus service
sudo systemctl daemon-reload
sudo systemctl restart prometheus
sudo systemctl status prometheus
Lets check the target health.
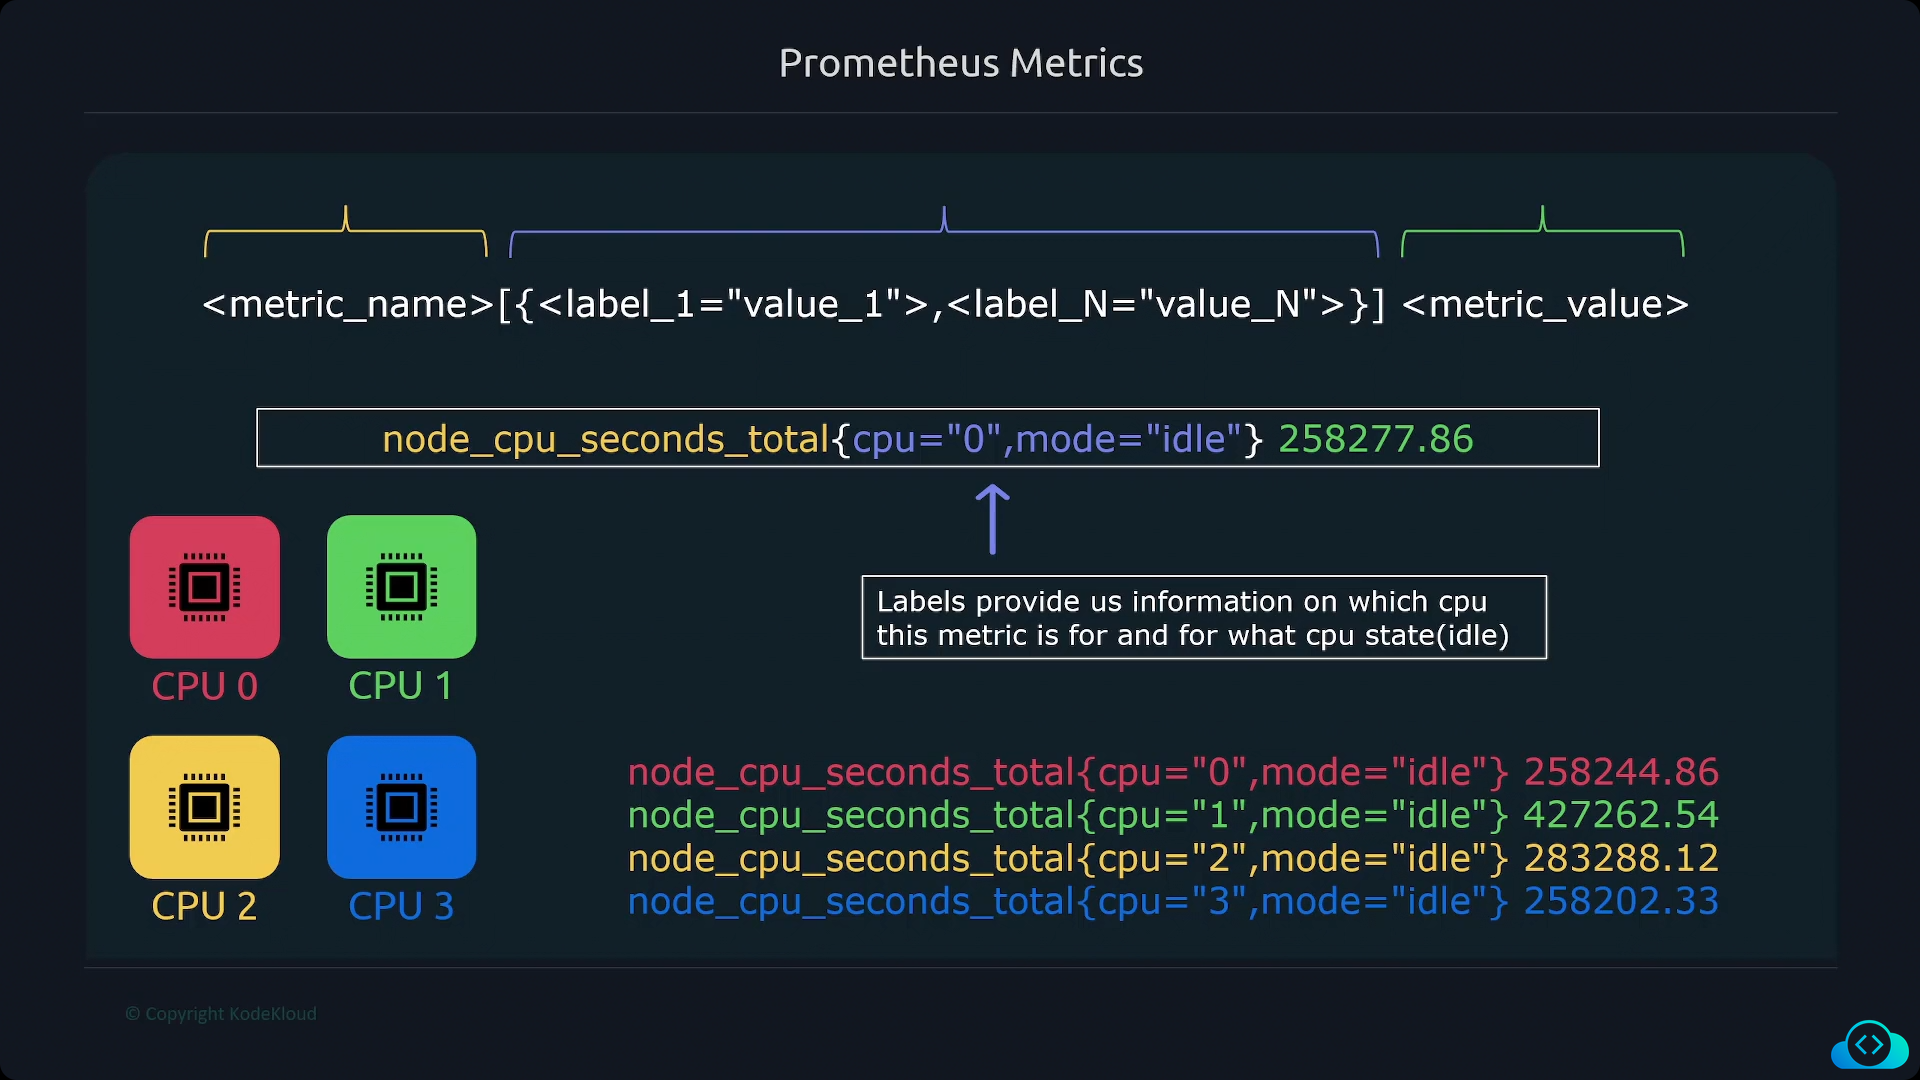
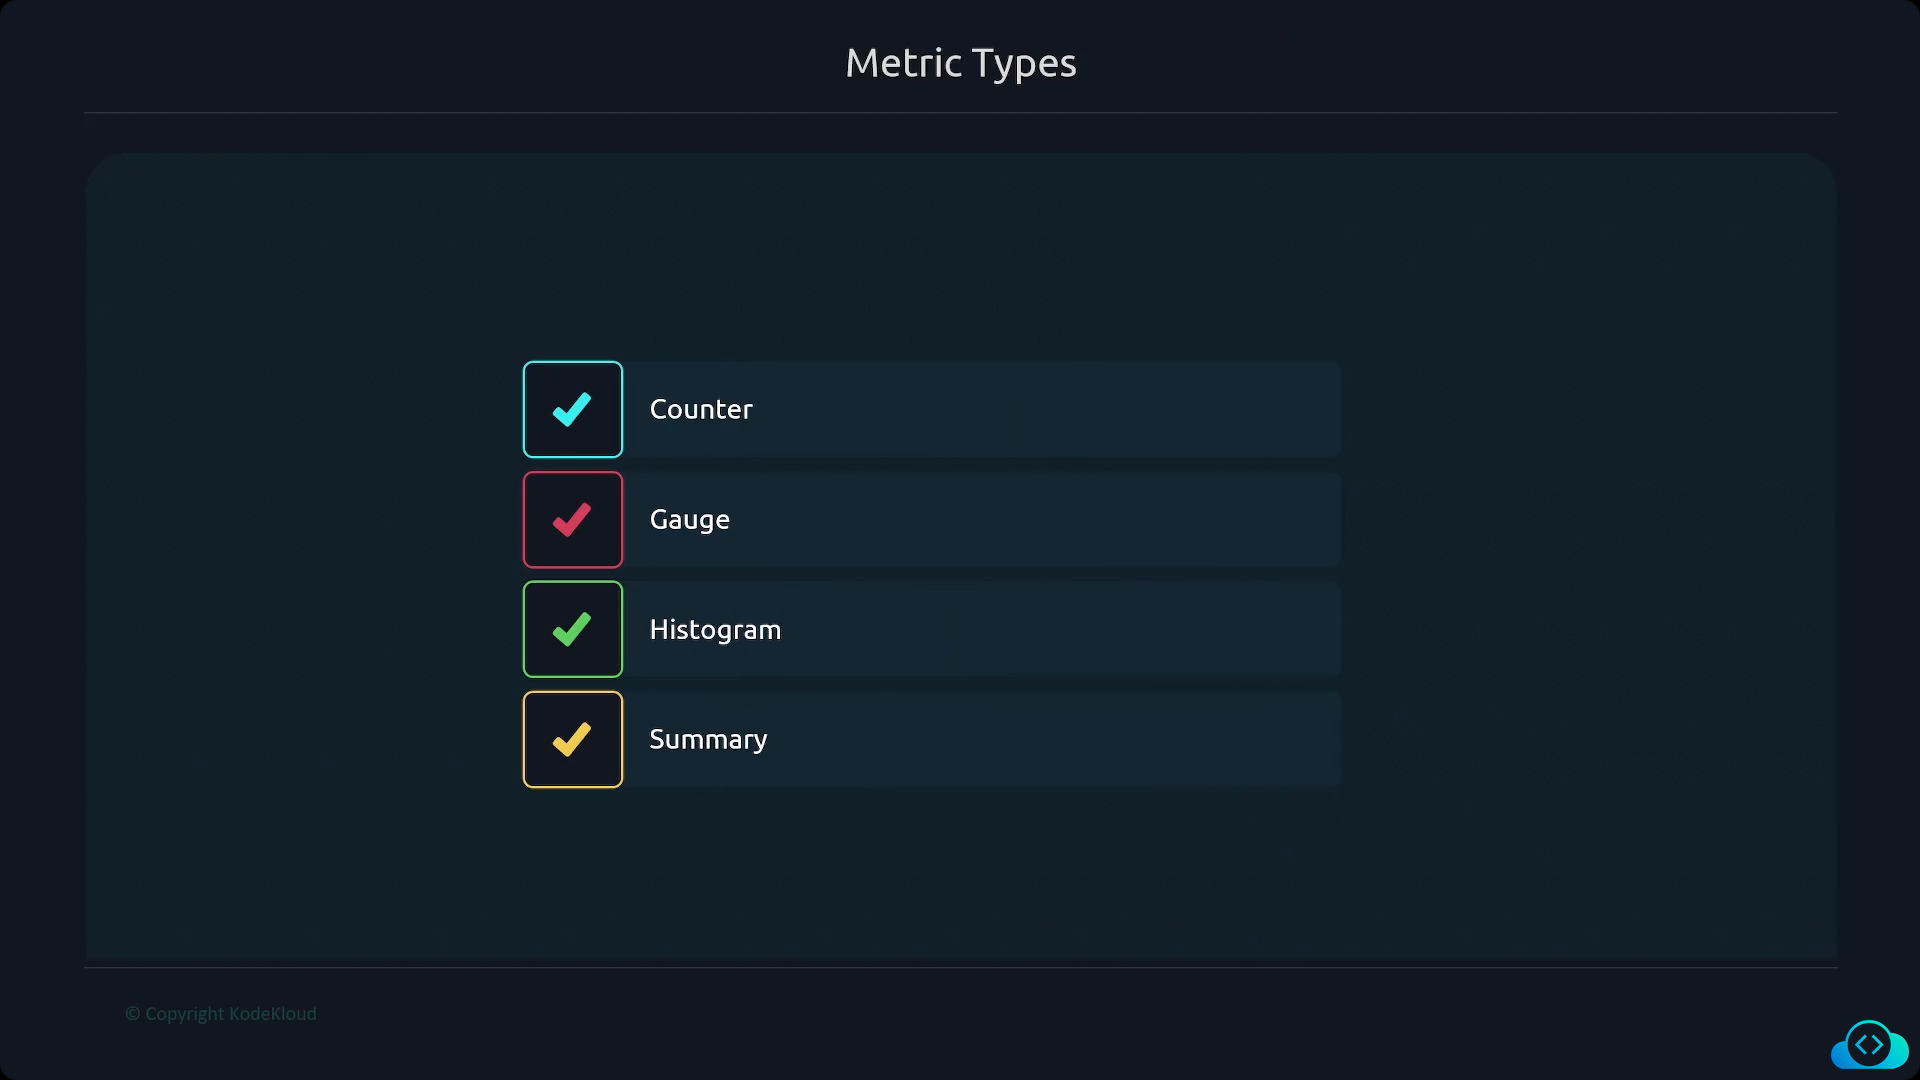
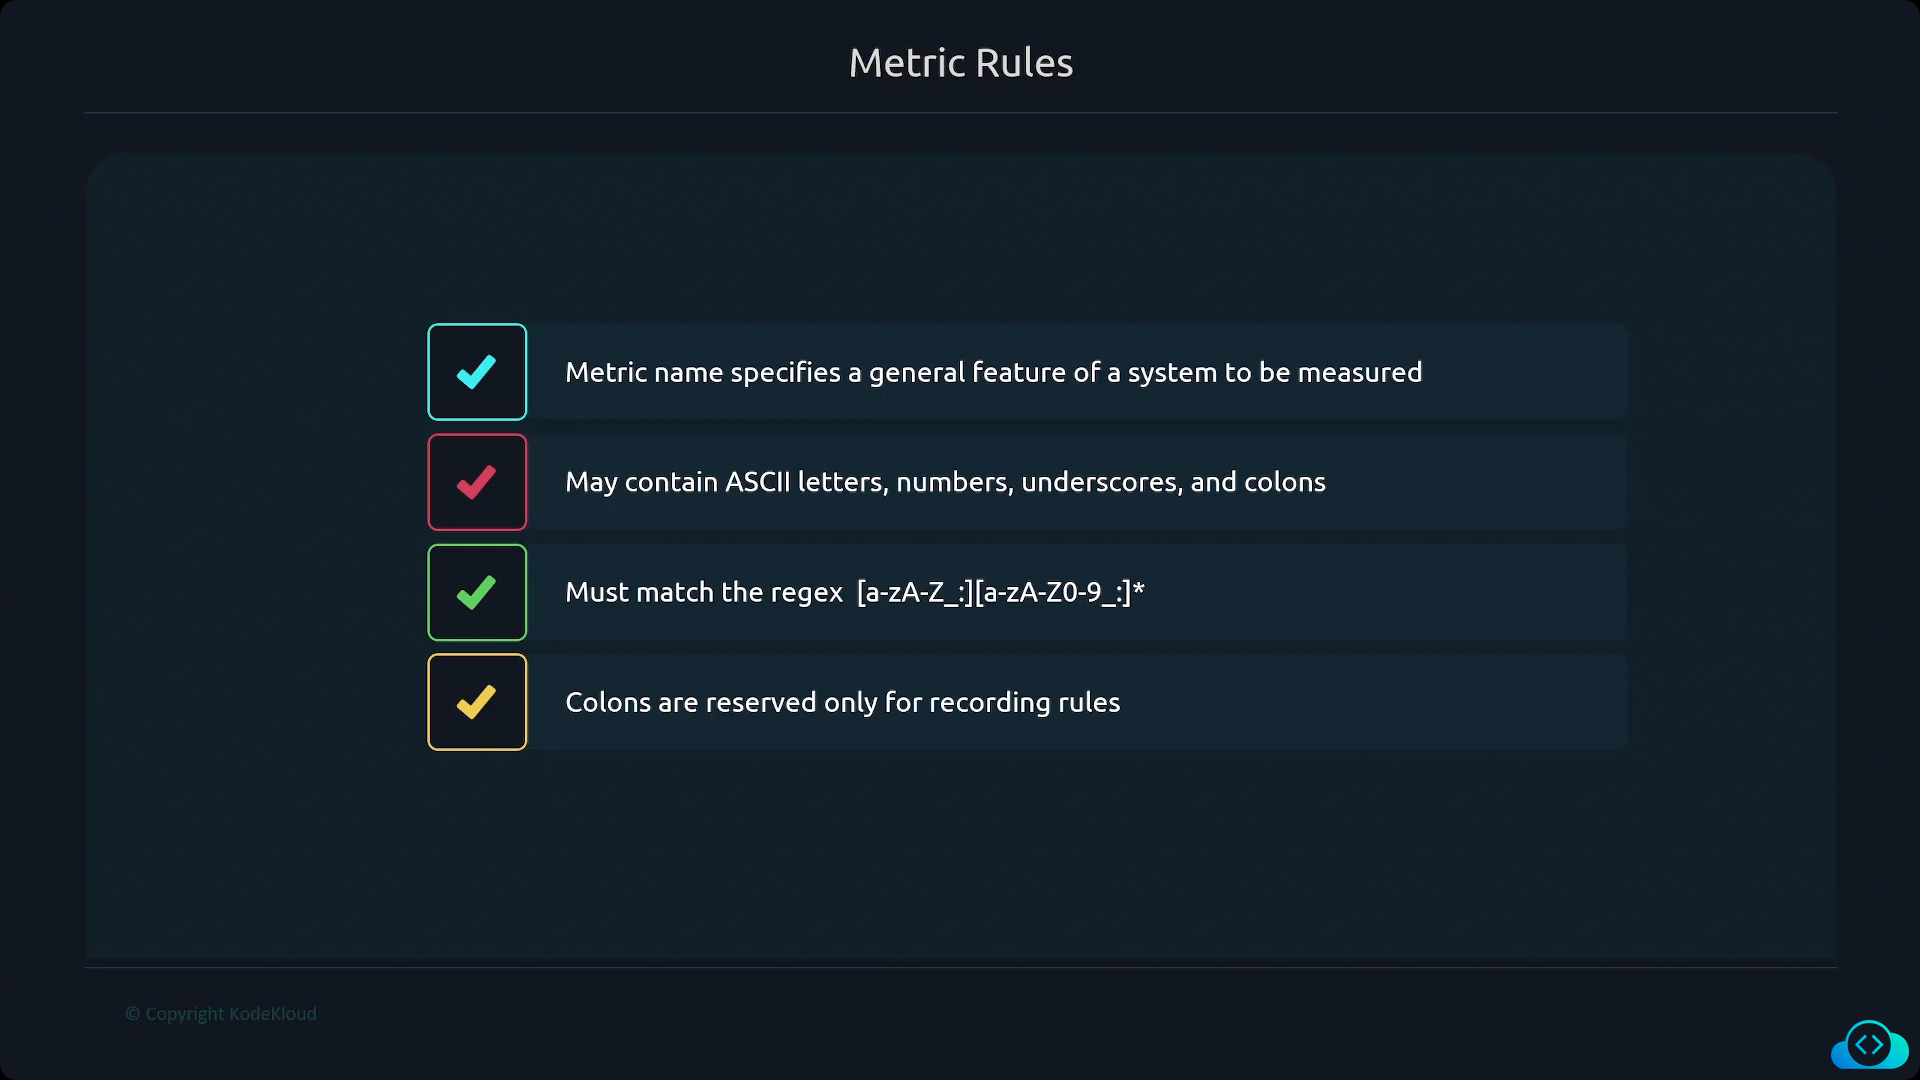
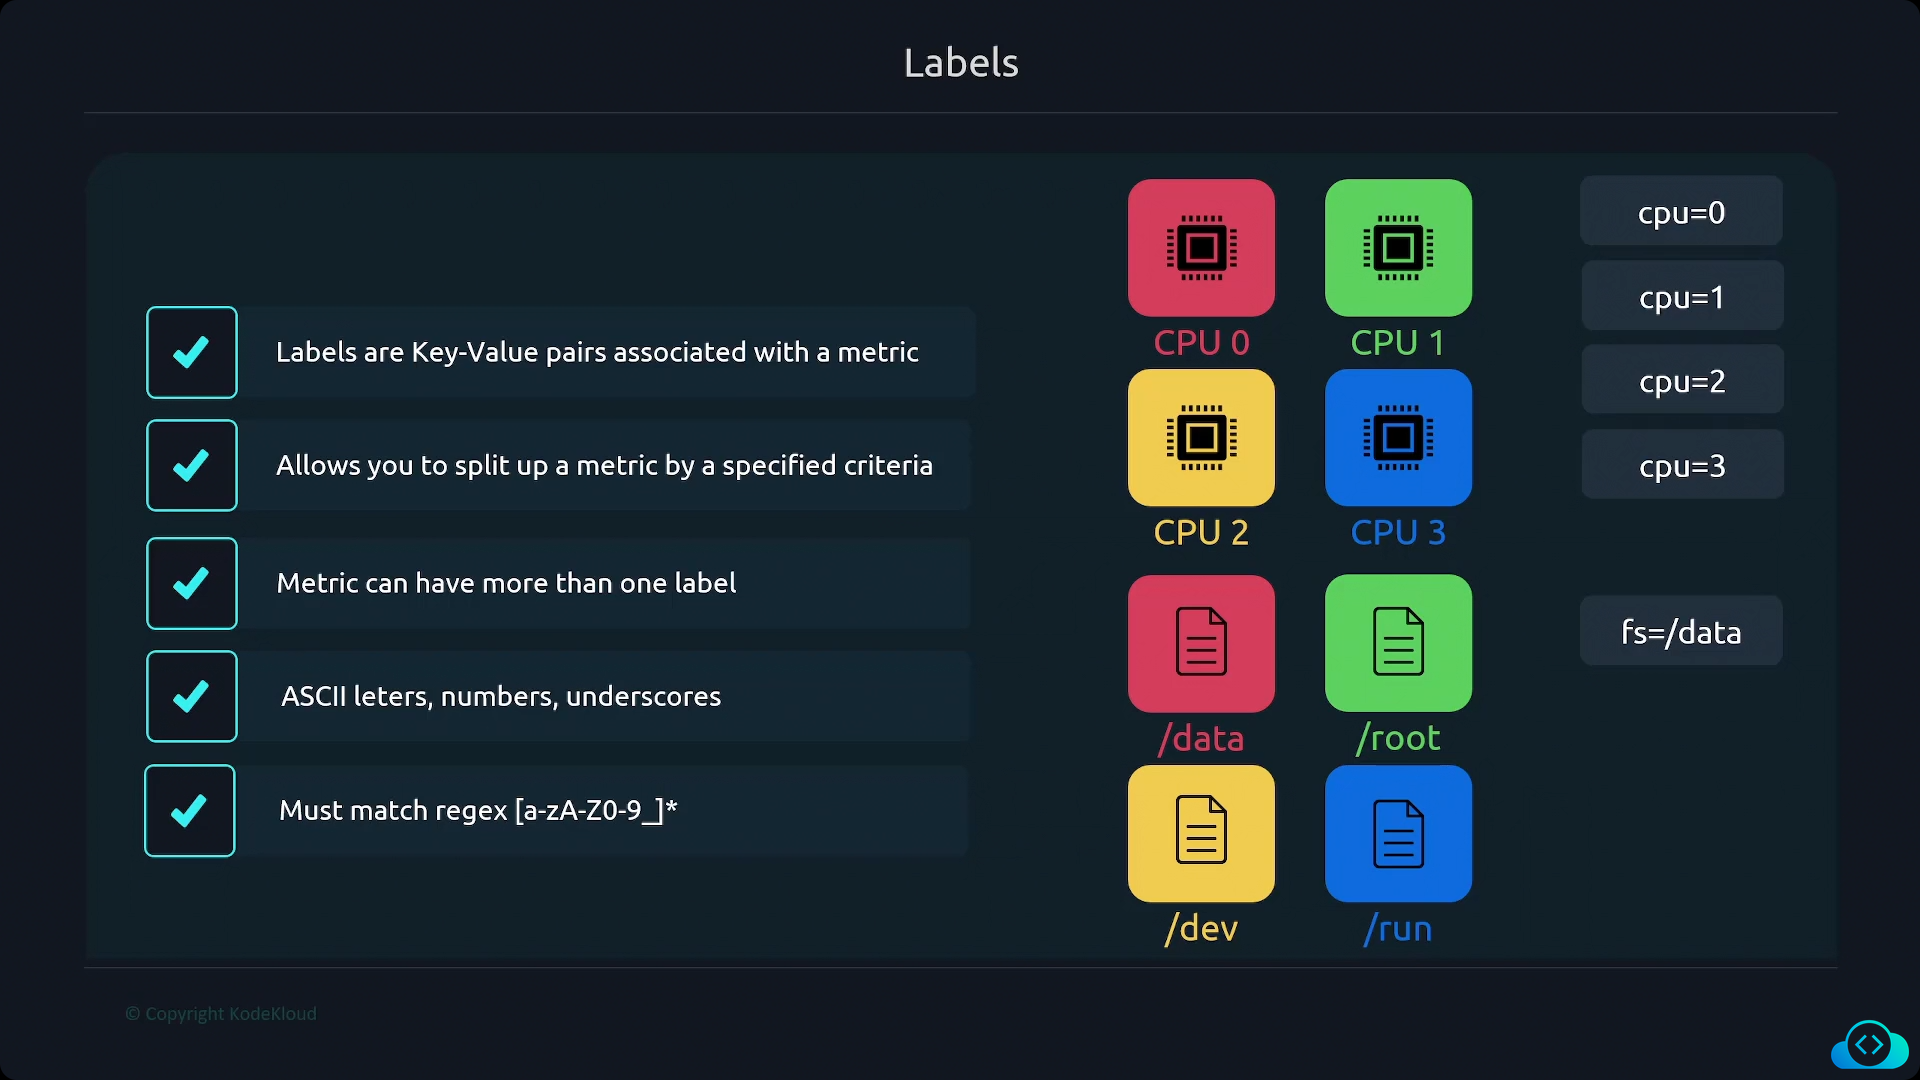
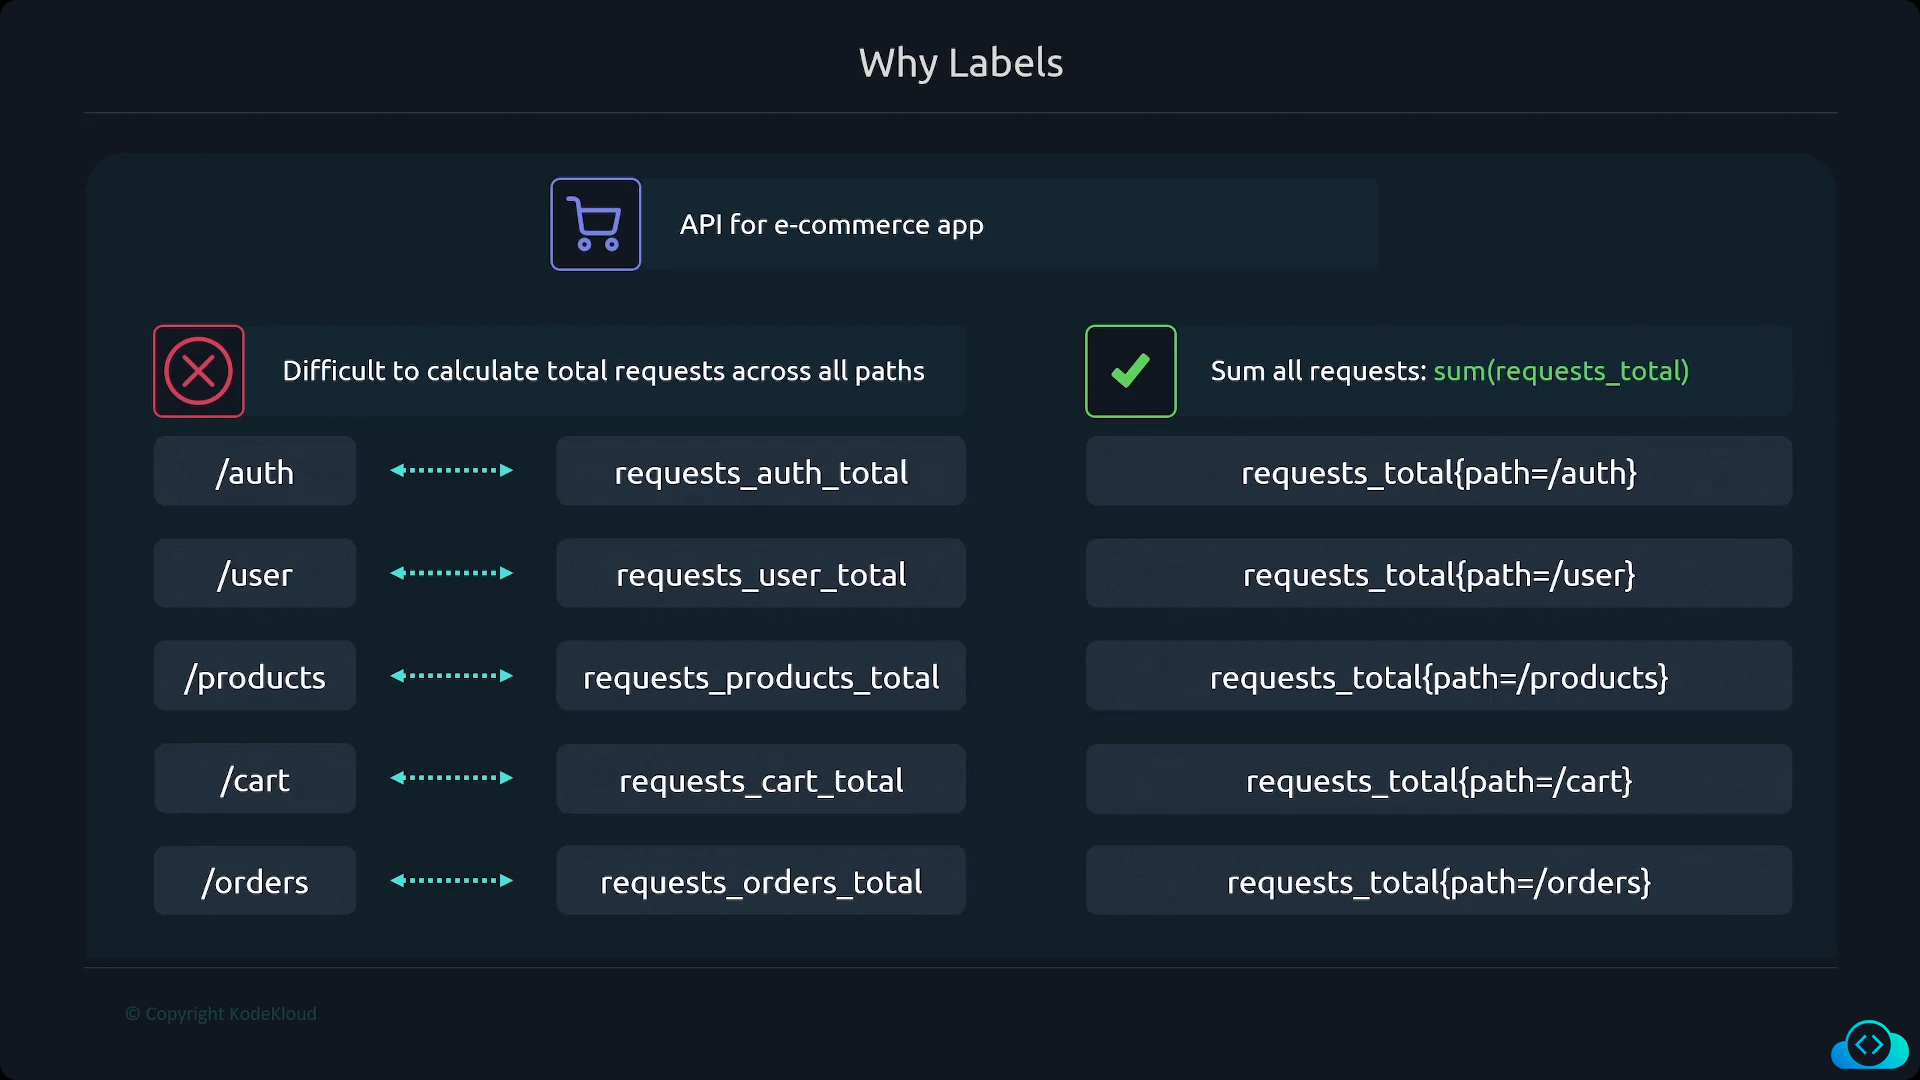
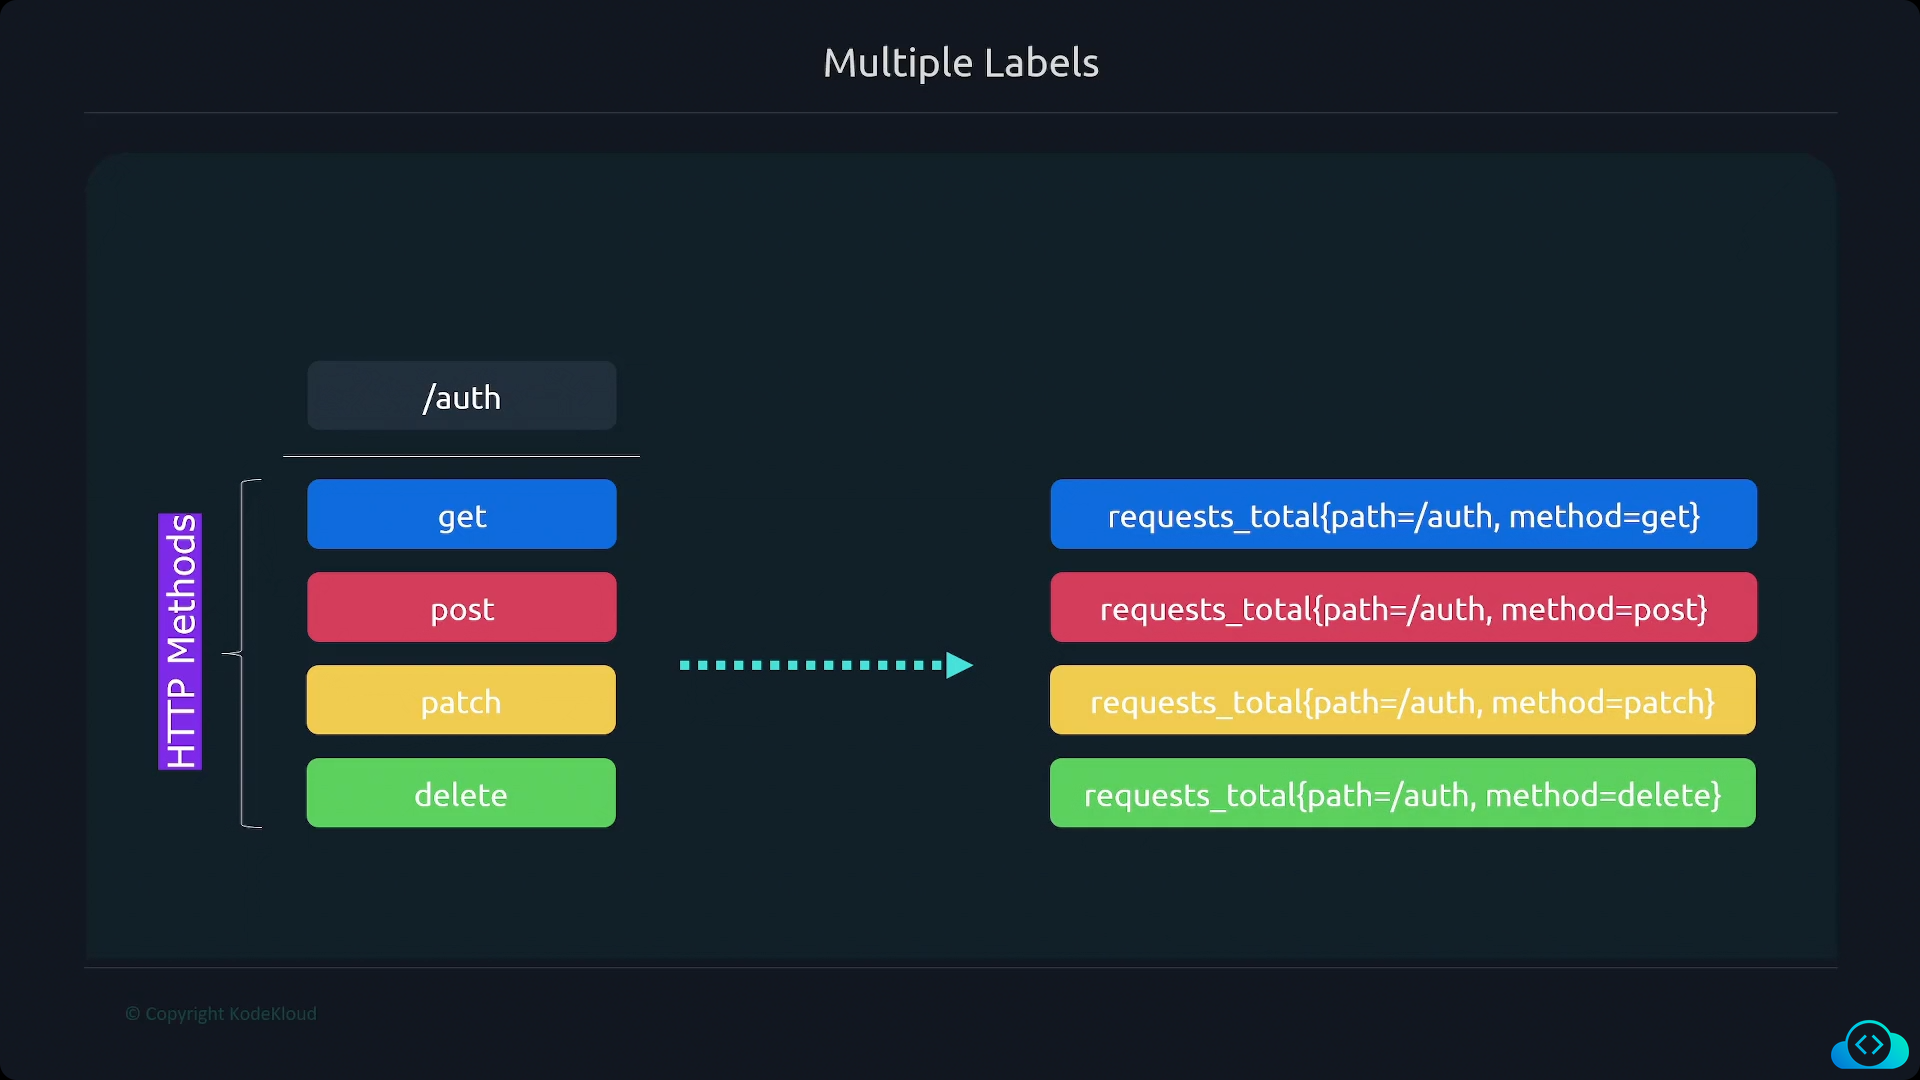
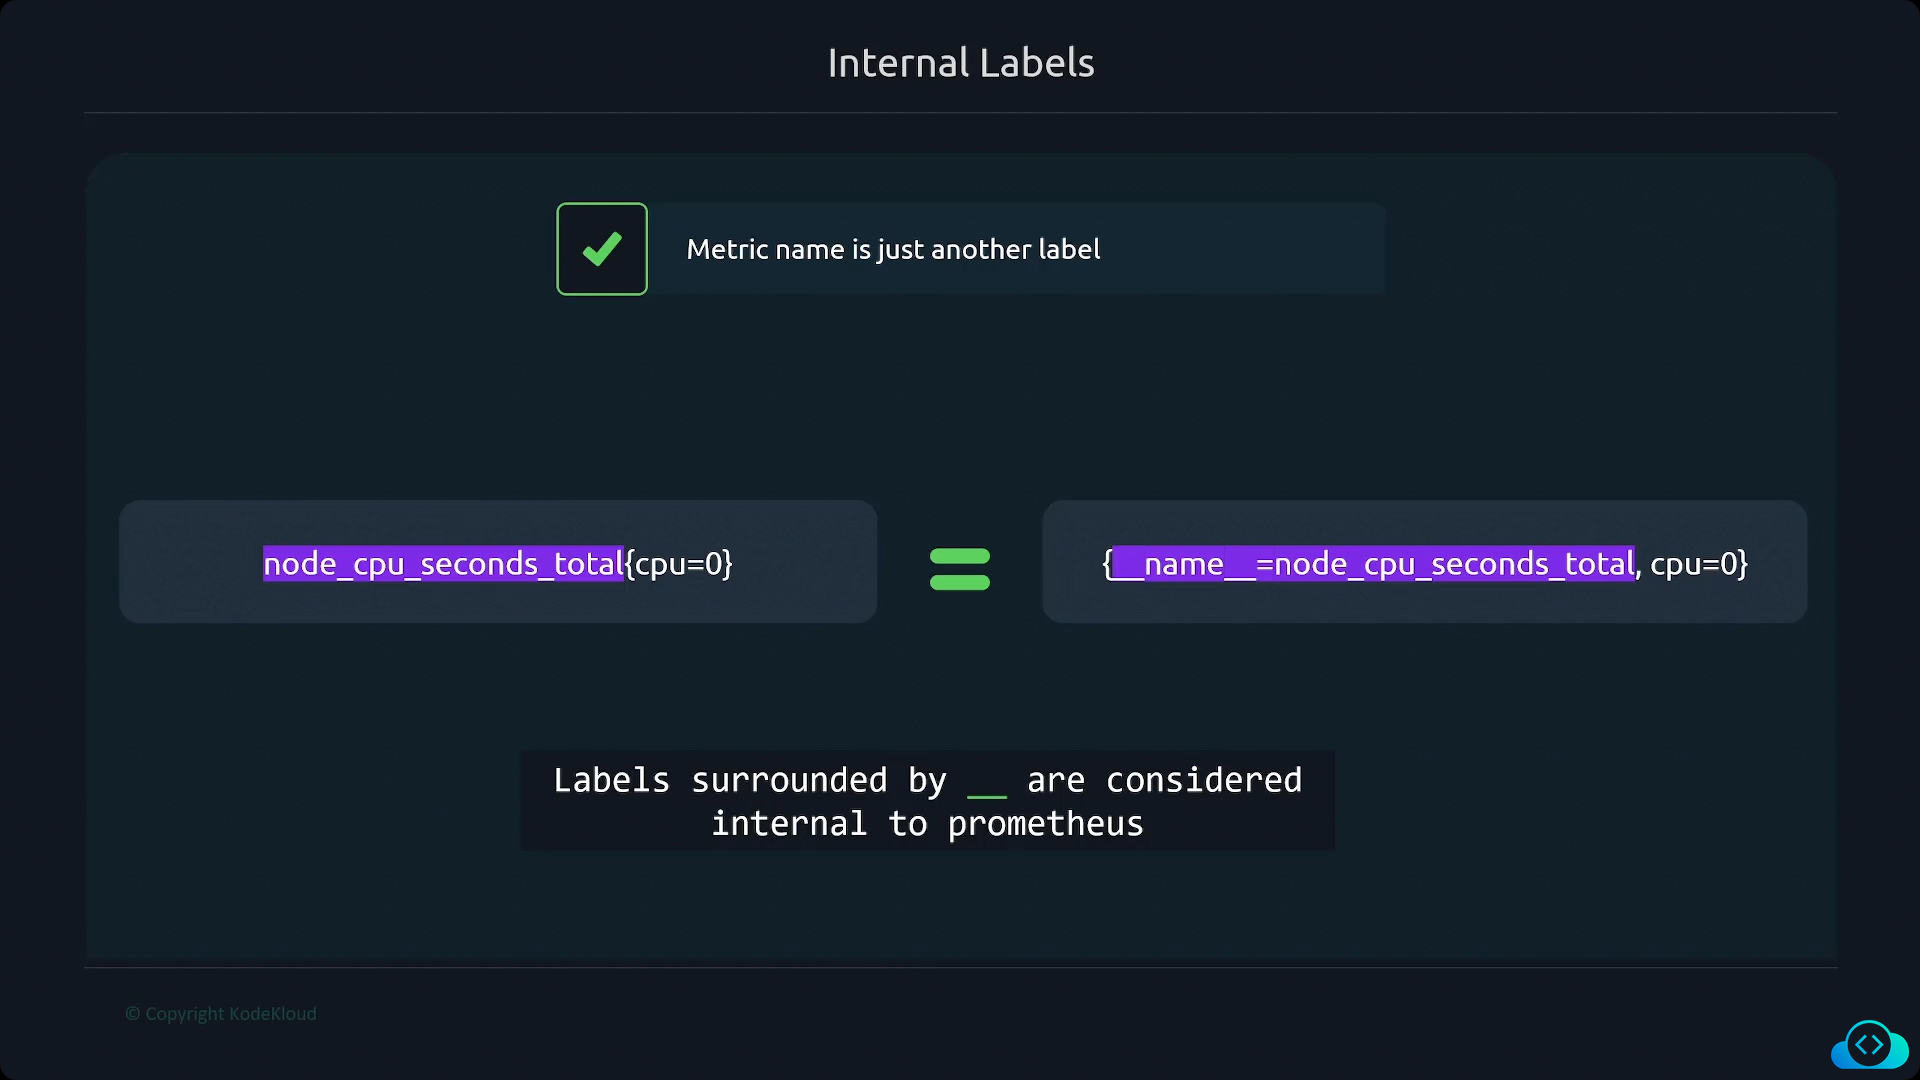
Prometheus Metrics