Hey Devs!
Previously, I explored how we can monitor OSS activity metrics based on GitHub repository data.


Building on that, I implemented a Google Apps Script (GAS) that continuously stores traffic data from GitHub repositories.


This time, while adding GAS functions to store other metrics, I have published the repository as OSS. I’d like to take this opportunity to introduce it once again.
Published Repository
The published repository is available here.
 route06inc
/
ospo-google-apps-script
route06inc
/
ospo-google-apps-script
OSPO Google Apps Script by ROUTE06, Inc.
The initial setup is summarized in the README. I will focus mainly on why I decided to store these metrics.
Stored Metrics
1. Stargazers
Objectives
- To understand the daily increase in stars.
- To correlate the days with star increases with possible reasons or initiatives.
Issues
- On GitHub’s web UI, only the total number of stars and the accounts that starred are visible.
- With Star History, the counts for nearby days are rounded off, and it does not allow for note-taking.
Solution
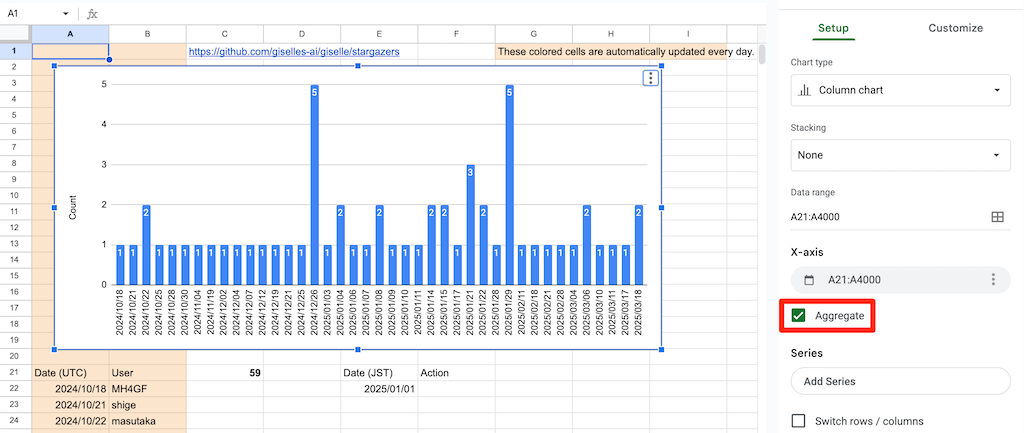
I implemented the function updateSheetWithStargazers to record who starred on which day.
The graph was created as shown below. The key is to enable “Aggregate” on the X-axis. Except for the colored cells, you can freely add notes.
2. Traffic views
Objectives
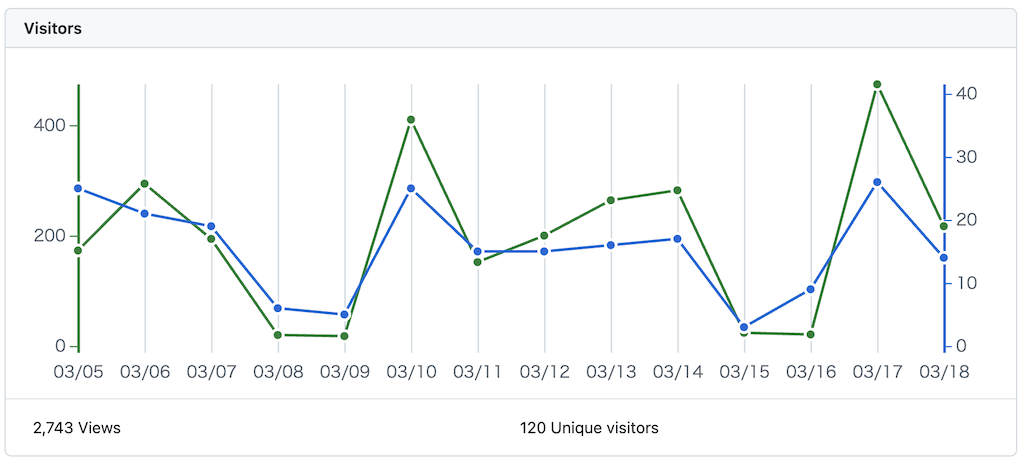
- To permanently store the numerical data from the
Visitorsgraph in the repository’sInsights > Trafficsection.https://github.com/[ORG]/[REPO]/graphs/traffic
Issues
- The graph does not display data older than two weeks.
- The GitHub REST API Get traffic views has the same limitation.
Solution
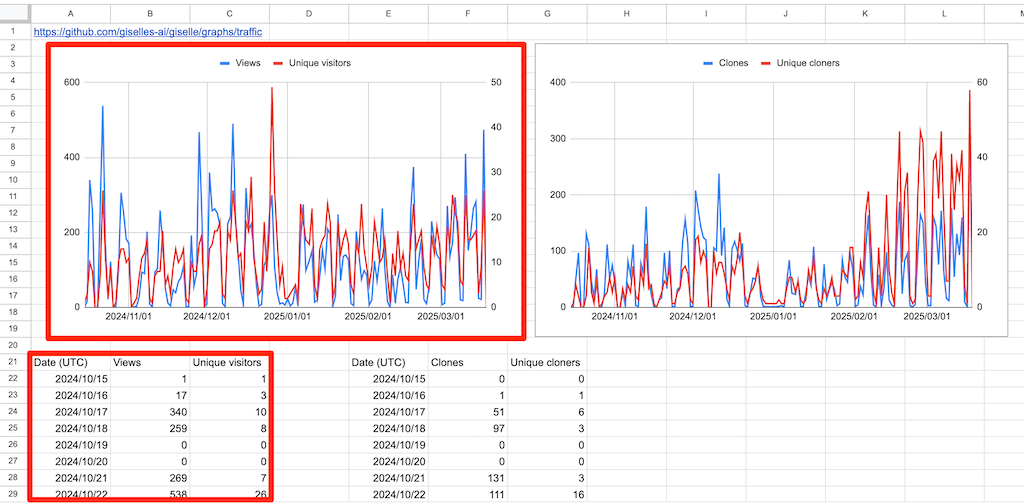
I implemented the function updateSheetWithLatestTrafficViews that uses this API to store the daily Views and Unique visitors in a spreadsheet.
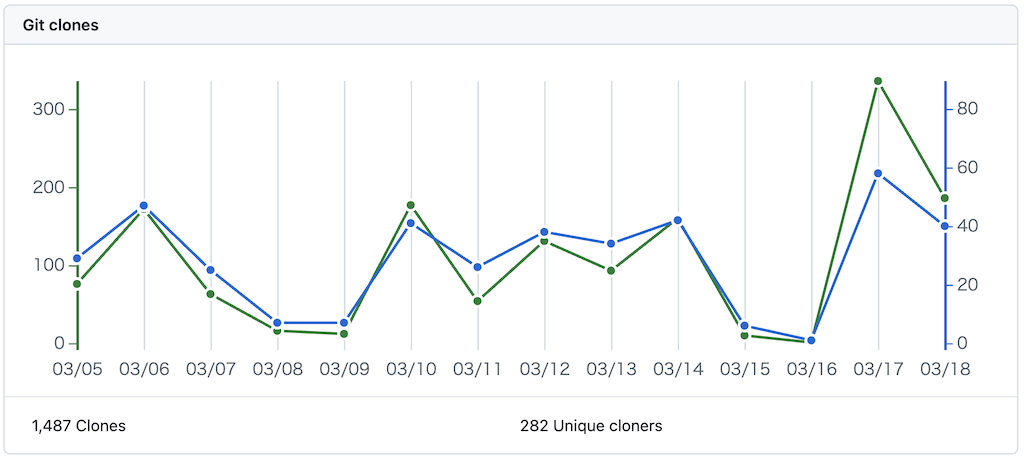
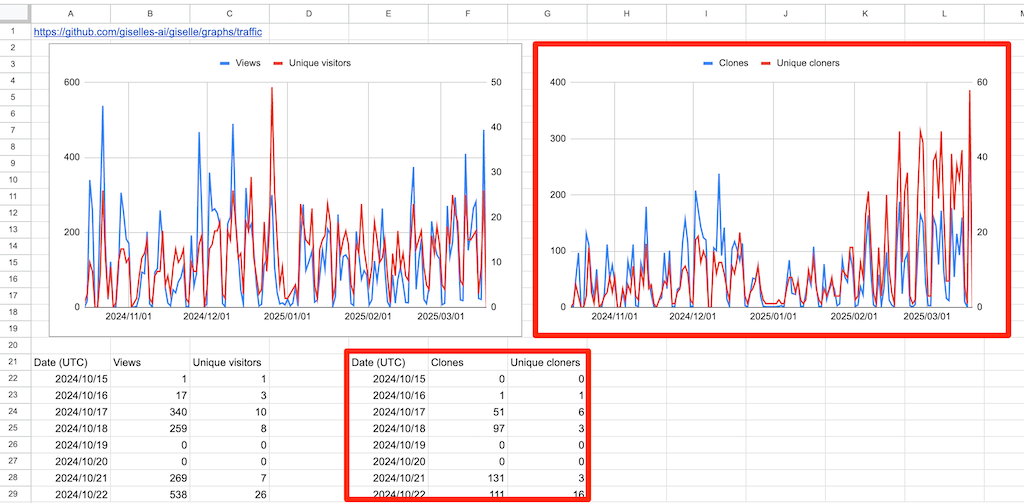
3. Traffic clones
Objectives
- To permanently store the numerical data from the
Git clonesgraph in the repository’sInsights > Trafficsection.https://github.com/[ORG]/[REPO]/graphs/traffic
Issues
- The graph does not display data older than two weeks.
- The GitHub REST API Get traffic clones has the same limitation.
Solution
I implemented the function updateSheetWithLatestTrafficClones that uses this API to store the daily Clones and Unique cloners in a spreadsheet.
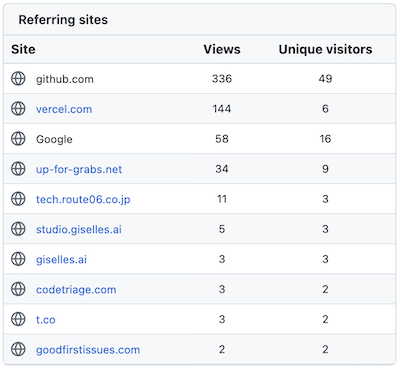
4. Top referral sources
Objectives
- To permanently store the numerical data from the
Referring sitesgraph in the repository’sInsights > Trafficsection.https://github.com/[ORG]/[REPO]/graphs/traffic
Issues
- The graph does not display data older than two weeks.
- The GitHub REST API Get top referral sources has the same limitation.
- Each value is the total for the past 14 days, which is not very user-friendly.
Solution
I implemented the function updateSheetWithLatestTrafficReferrers using this API to store the daily Referring sites in a spreadsheet.
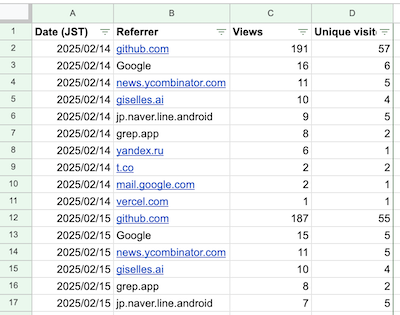
To create a stacked graph, I made a pivot table of Views and Unique visitors on a separate sheet, along with their respective graphs.
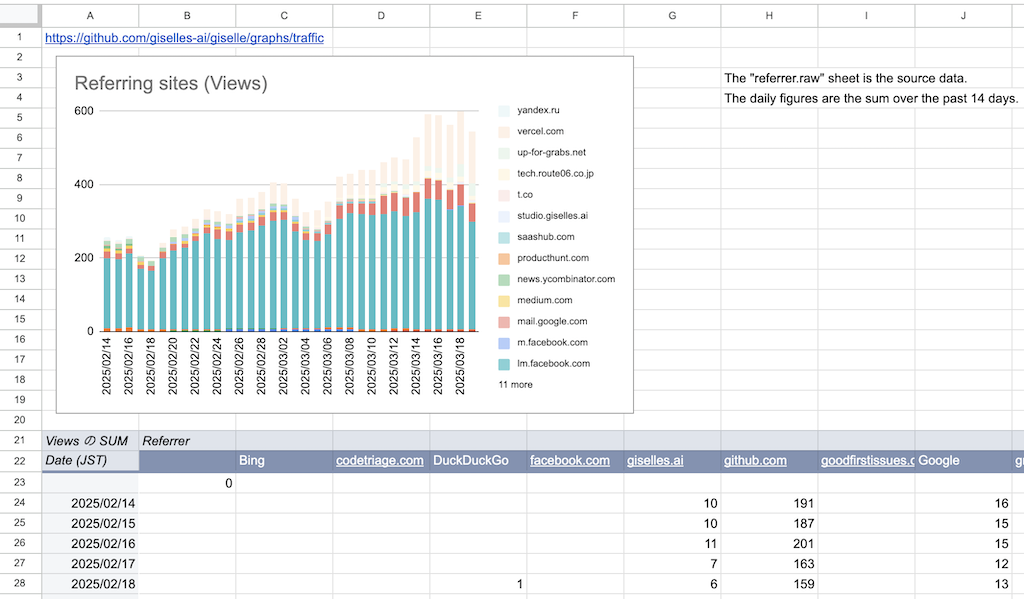
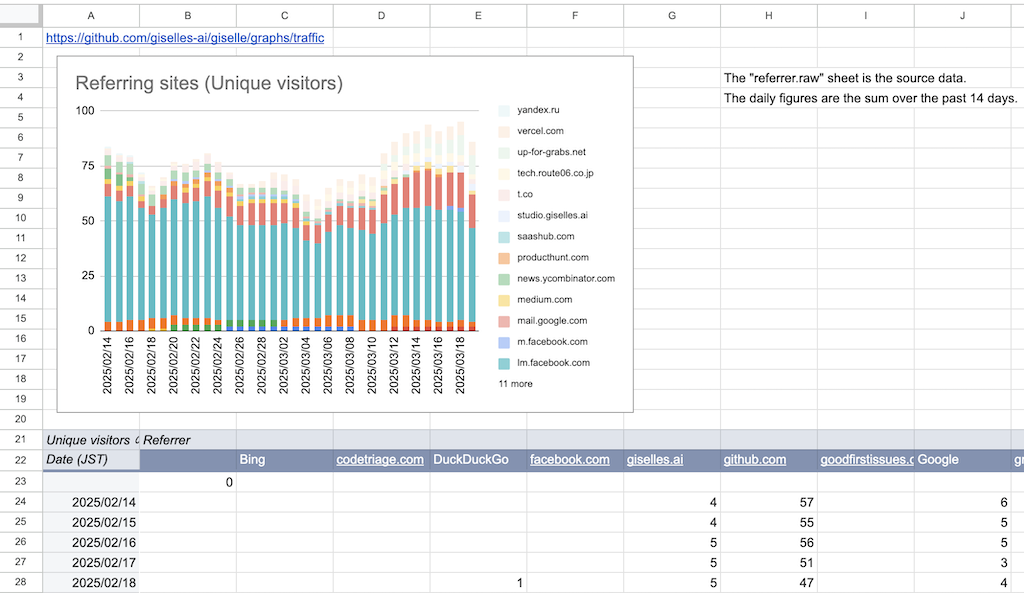
While the issue of each value being a total for the past 14 days remains unsolved, it seems possible to separate them using spreadsheet functions.
Conclusion
I have published the OSS repository https://github.com/route06inc/ospo-google-apps-script that continuously stores GitHub repository metrics using GAS.
This tool is already in daily use on the repositories of Giselle and Liam, and the data is being effectively utilized.