TLDR: In this blog post we introduce a brand new open source library called scichart-react (npm, GitHub). This makes it easy to create stunning high-performance charts and data visualizations in React.
SciChart-React has now been released and is on npm as scichart-react. Examples, samples, documentation & tutorials are coming soon.
The official SciChart / React package solves the problem of component lifecycle with SciChart.js and avoids common pitfalls when creating charts in React. Code examples are given below of how to create React Charts, as well as where to find further information about this new React chart component.
Why Choose React JS for Chart Creation?
React JS has become the preferred choice for enterprises seeking robust and efficient application development, largely due to its component-based architecture, high performance, and rich ecosystem. Unlike other frameworks like Angular, React stands out for its virtual DOM, which ensures faster rendering and smooth handling of complex, data-intensive visualizations. Its modular nature allows for the creation of reusable, maintainable chart components, streamlining development and scalability. Additionally, React’s vast library of tools and strong community support offers a wealth of resources, making it more adaptable to various charting requirements. The combination of flexibility, efficient data handling, and cross-platform compatibility positions React as a dominant force in the realm of enterprise-level data visualization, outpacing competitors in terms of performance and versatility.
Why Choose SciChart.js for React Charts?
SciChart.js is an advanced react chart library for use in complex and advanced mission critical applications. SciChart’s key features include extremely high performance for big-data sets, a wide set of chart types, deep features and customisability.
For a full run-down of SciChart.js’ features and why you should consider it for enterprise apps with complex requirements, read the following post:
The Best JavaScript Chart Library: 10 Compelling Reasons to Choose SciChart.js in 2024
Create React Charts easily with SciChart-React
Earlier in the year, we published an article titled How to create a re-usable react component for SciChart.js. This demonstrated how to create charts in React by applying a few criteria for creation of a React Chart component:
- The component should be reusable for different chart configurations
- It should be possible to safely create several instances of the component
- It should be easy to add custom functionality to the component
- When chart instantiation is an async function, this should be properly handled
- When the chart requires a root element in the DOM it should exist before chart instantiation
- Finally, the chart should be properly disposed and memory deleted after the component is unmounted. As background reading it’s worth reading the article. Problems which occurred in the past when creating React Charts with SciChart.js included double re-render, and potential memory leaks if your code improperly disposed of a chart surface by failing to call .delete().
We’ve created a new library called scichart-react which is open sourced and available on Github and npm. This solves the problems above and ensures that you have good quality code managing your react components and provides a clean, neat way to instantiate charts in react using simple props.
Step-by-Step Guide: Building Your First Chart in React with SciChart.js
SciChartReact provides an easy solution for using the SciChart core library for charts in React.
In the next sections, we will demonstrate a basic usage of the component.
Basic React Chart Example
Follow the prerequisites and installation sections from https://www.npmjs.com/package/scichart-react.
And just with few lines of code, you can set up a chart in React.
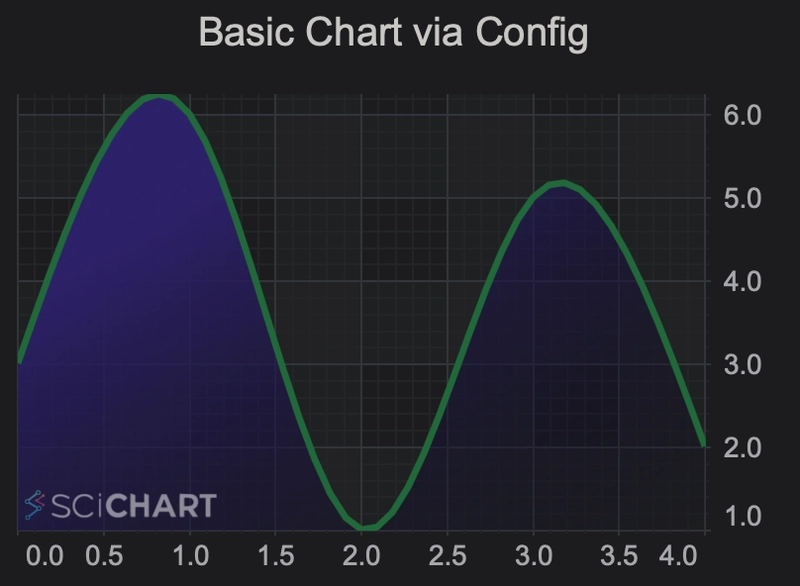
Create a Chart with Config (Builder) API
The Builder API in SciChart allows you to create charts in JavaScript with JS objects or JSON. This can be translated into React using scichart-react as follows.
The example uses the config property which accepts a configuration object of the chart. You can also pass a string with serialized chart configuration.
import { SciChartReact } from "scichart-react";
import { ESeriesType, EThemeProviderType } from "scichart";
/**
* The chart configuration object acceptable by the Builder API
* @type {import("scichart").TSurfaceDefinition}
*/
const chartConfig = {
surface: {
theme: { type: EThemeProviderType.Dark },
title: "Basic Chart via Config",
titleStyle: {
fontSize: 20,
},
},
series: {
type: ESeriesType.SplineMountainSeries,
options: {
strokeThickness: 4,
stroke: "#216939",
fillLinearGradient: {
startPoint: { x: 0, y: 0 },
endPoint: { x: 1, y: 1 },
gradientStops: [
{ offset: 0.3, color: "#2d2169" },
{ offset: 1, color: "transparent" },
],
},
},
xyData: { xValues: [0, 1, 2, 3, 4], yValues: [3, 6, 1, 5, 2] },
},
};
export const BasicChart = () => (
Here’s the output
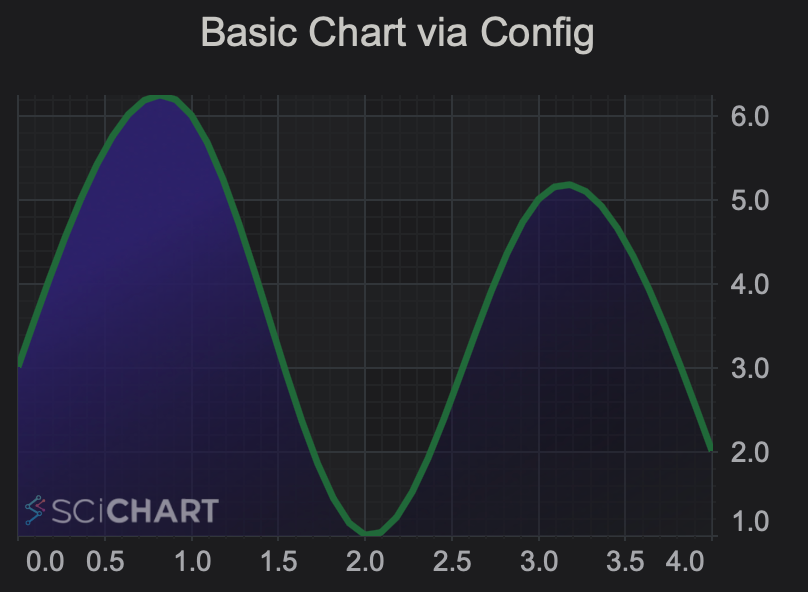
Note SciChartReact extends properties of the HTMLDivElement and propagates them to the underlying div element.
Create a React Chart with Programmatic API
Alternatively, SciChartReact accepts an initialization function. This allows the creation of a chart with the usual SciChart.js API. In this case the chartInitializationFunction below must be async and accepts the
import { SciChartReact } from "scichart-react";
import {
EThemeProviderType,
NumericAxis,
SciChartSurface,
SplineMountainRenderableSeries,
XyDataSeries,
} from "scichart";
/**
* A function executed within SciChartReact with provided chart root element,
* creates a SciChartSurface instance and returns a reference to it.
*
* @param {string | HTMLDivElement} rootElement
* @returns {Promise<{sciChartSurface: SciChartSurface}>}
*/
const chartInitializationFunction = async (rootElement) => {
const { sciChartSurface, wasmContext } = await SciChartSurface.create(
rootElement,
{
theme: { type: EThemeProviderType.Dark },
title: "Basic Chart via Init Function",
titleStyle: {
fontSize: 20,
},
}
);
sciChartSurface.xAxes.add(new NumericAxis(wasmContext));
sciChartSurface.yAxes.add(new NumericAxis(wasmContext));
sciChartSurface.renderableSeries.add(
new SplineMountainRenderableSeries(wasmContext, {
dataSeries: new XyDataSeries(wasmContext, {
xValues: [0, 1, 2, 3, 4],
yValues: [3, 6, 1, 5, 2],
}),
strokeThickness: 4,
stroke: "#216939",
fillLinearGradient: {
startPoint: { x: 0, y: 0 },
endPoint: { x: 1, y: 1 },
gradientStops: [
{ offset: 0.3, color: "#2d2169" },
{ offset: 1, color: "transparent" },
],
},
})
);
return { sciChartSurface };
};
export const BasicChartWithInitFunction = () => (
Additionally, it is possible to easily add more customizations and functionality by providing arguments to other props:
- fallback – a JSX element to render while the chart initialization is in progress
- onInit – a callback that is executed after the chart initialization has been completed
- onDelete – a callback executed when a fully initialized chart is unmounted
Advanced React Chart example – Selection and Synchronization with a DataGrid
Let’s look at another more complex example:
- For this case, we will take a setup with a Scatter Chart that fetches data asynchronously.
- The points on the chart could be selected by click and drag action.
- Upon selection, the point info appears within a grid at the side of the chart
Step 1 – Fetching Data Asynchronously and loading the Chart
Considering that the data fetching as well as a chart initialization potentially can take a noticeable amount of time, let’s make sure to set a custom loading UI with fallback property.
/**
 * @param {string | HTMLDivElement} rootElement
 * @returns {Promise<{sciChartSurface: SciChartSurface}>}
 */
const chartInitializationFunction = async (rootElement) => {
  const createChart = async () => {
    // for demonstration purposes, here we have used Builder API explicitly
    const { sciChartSurface } = await chartBuilder.build2DChart(rootElement, {
      xAxes: {
        type: EAxisType.NumericAxis,
        options: {
          autoRange: EAutoRange.Once,
          growBy: new NumberRange(0.2, 0.2),
        },
      },
      yAxes: {
        type: EAxisType.NumericAxis,
        options: { autoRange: EAutoRange.Never },
      },
      surface: {
        theme: { type: EThemeProviderType.Dark },
        title: "Scatter Chart",
        titleStyle: {
          fontSize: 20,
        },
      },
    });

    return sciChartSurface;
  };

  // a function that simulates an async data fetching
  const getData = async () => {
    await new Promise((resolve) => {
      setTimeout(() => resolve({}), 1500);
    });

    return { xValues: [0, 1, 2, 3, 4], yValues: [3, 6, 1, 5, 2] };
  };

  const [sciChartSurface, data] = await Promise.all([createChart(), getData()]);

  const wasmContext = sciChartSurface.webAssemblyContext2D;

  sciChartSurface.renderableSeries.add(
    new XyScatterRenderableSeries(wasmContext, {
      dataSeries: new XyDataSeries(wasmContext, {
        ...data,
      }),
      strokeThickness: 4,
      stroke: "#216939",
    })
  );
  return { sciChartSurface };
};

// ...
// then in JSX
// ...


      Data fetching & Chart Initialization in progress