In a world where security breaches and unstable deployments can instantly ruin user trust, building a secure and automated CI/CD pipeline is no longer optional - it's essential.
In this hands-on guide, you'll walk through a real-world DevSecOps pipeline integrating powerful open-source tools like Jenkins, ArgoCD, Trivy, SonarQube, and Vault, enhanced with Prometheus and Grafana for monitoring.
By the end of this guide, you'll be able to:
- Automate Builds, Tests, and Deployments using Jenkins and GitOps with ArgoCD
- Enforce Security and Code Quality with SonarQube and Trivy
- Manage Secrets Securely using HashiCorp Vault
- Deploy Declaratively with GitOps, enabling rollbacks and auditability
- Gain Real-Time Visibility with Prometheus and Grafana
What We'll Cover:
- GitOps Foundation: Setting up our Git repositories
- Jenkins Automation: Configuring Jenkins to drive our pipeline
- Docker and Initial Security: Containerizing our app and scanning
- Pipeline Deep Dive: Building, scanning, and pushing our Docker image
- GitOps Deployments: Automating deployments with ArgoCD
- Vault Secrets: Securely managing credentials
- Real-Time Monitoring: Using Prometheus and Grafana for observability
Architecture Overview
Our architecture combines the strengths of Continuous Integration (CI), Continuous Delivery (CD), GitOps, and DevSecOps principles to create a secure and automated workflow. Here's a visual representation of the key components and their interactions:
- Jenkins - Automates the pipeline: build, test, scan, deploy
- Docker - Builds and runs containerized apps
- Trivy - Scans code and images for vulnerabilities
- SonarQube - Analyzes code quality and security
- Vault - Securely store and manage credentials and other sensitive data
- ArgoCD - Syncs Kubernetes clusters from Git repositories
- Prometheus + Grafana - Provides real-time monitoring of the application and system
Note: During the project implementation, you will likely face issues that you will need to solve independently. Use the official documentation, Google, Stack Overflow, or ChatGPT to find solutions. This is a normal part of the learning process and reflects real-world DevOps challenges. Developing your ability to find necessary information is a crucial skill for a DevOps engineer.
Prerequisites
Before diving into the implementation, ensure the following tools are installed and configured on your local environment:
- Git, Docker, Jenkins, kubectl
- Minikube (for local Kubernetes)
- SonarQube, Trivy, Vault CLI
- Visual Studio Code (or preferred IDE)
- Helm (optional, for ArgoCD/Vault)
💡 Glossary Reminder: If you encounter unfamiliar terms, please refer to the glossary at the end of the article.
Step 1: Create Two GitHub Repositories
To establish a clean and modular CI/CD pipeline aligned with GitOps best practices, we'll begin by creating two distinct GitHub repositories.
DevSecOps-pipeline
This repository will house your application's source code, the Dockerfile defining how to containerize your application, and the Jenkinsfile which outlines the automation pipeline.
DevSecOps-pipeline/
├── Dockerfile
├── Jenkinsfile
├── src/
└── ... (your application source code)
GitOps
This repository will serve as the single source of truth for your Kubernetes cluster's desired state. It will contain Kubernetes manifests (e.g., deployment.yaml, service.yaml) and any application-specific configuration.
GitOps/
├── config/
│   └── app.yaml
│
└── k8s/
├── deployment.yaml
├── service.yaml
└── ... (other Kubernetes manifests)
Why this structure?
Keeping source code and deployment configuration in separate repositories enables GitOps best practices and promotes clear separation of concerns.
Step 2: Installing and Configuring Jenkins
Jenkins will act as the central orchestrator of our CI/CD pipeline, automating the build, test, scan, and deployment processes.
Required Jenkins Plugins
Go to Manage Jenkins > Plugins and install:
- Docker Pipeline
- Git Plugin
- SonarQube Scanner
- Trivy Plugin
- HashiCorp Vault Plugin
Instead of adding secrets manually under Manage Jenkins > Credentials, we now store all sensitive data in Vault and retrieve it dynamically during pipeline execution using the withVault block.
Secrets managed in Vault:
- GitHub Access Token →
secret/github - Docker Hub credentials →
secret/dockerhub - SonarQube Token →
secret/sonarqube - GitOps SSH Key →
secret/gitops - MongoDB Credentials →
secret/mongodb
Each of these is fetched securely from Vault at runtime using the AppRole authentication method. This eliminates the need to hardcode or store secrets in Jenkins and ensures better traceability and secret rotation.
Configure Vault Plugin in Jenkins:
Navigate to Manage Jenkins > Configure System > Vault Plugin:
- Vault URL:
https://vault.your-domain:port - Credential Type: AppRole
- Vault AppRole Role ID:
- Vault AppRole Secret ID:
Once configured, Jenkins is ready to securely communicate with Vault and fetch secrets during pipeline execution.
Configure SonarQube Scanner in Jenkins
- Go to Manage Jenkins > Configure System.
-
Scroll to SonarQube servers and click Add SonarQube:
- Name: SonarQube
- Server URL:
http://:9000 - Check Enable injection of SonarQube server configuration as build environment variables
Go to Manage Jenkins > Global Tool Configuration.
Scroll to SonarQube Scanner and click Add SonarQube Scanner:
Name: SonarScanner
Check Install Automatically (or specify a local path)
Configure Trivy Plugin in Jenkins
- Navigate to Manage Jenkins > Configure System.
- Scroll to the Trivy section and click Add Trivy Installation:
- Name: Trivy
- Check Install automatically (or specify the path to an existing Trivy binary)
Now Trivy is ready to scan Docker images for vulnerabilities as part of your pipeline.
Step 3: Containerize the Application (Multi-Stage Dockerfile)
Why Dockerize?
Docker ensures that your app runs in a consistent environment across all stages of development, testing, and production.
In your app repo (DevSecOps-pipeline/), create the following Dockerfile:
# -------- STAGE 1: Build --------
FROM node:18-bullseye AS build
WORKDIR /app
# Copy package definition files
COPY package*.json ./
# Install system and Node.js dependencies required for build
RUN apt-get update && apt-get install -y \
    python3 \
    build-essential \
    libssl-dev \
    curl \
    && rm -rf /var/lib/apt/lists/*
# Install Node dependencies
RUN npm install --legacy-peer-deps
# Copy full application source code
COPY . .
# -------- STAGE 2: Runtime --------
FROM node:18-slim
WORKDIR /app
# Copy only the build artifacts and necessary files from previous stage
COPY --from=build /app .
# Expose the app port
EXPOSE 3001
# Launch the Node.js application
CMD ["npm", "start"]
Local Testing (Optional but Recommended)
Before integrating the Docker build into the Jenkins pipeline, it's a good practice to validate the image locally:
docker build -t my-node-app .
docker run -p 3001:3001 my-node-app
Visit http://localhost:3001 to verify your app runs correctly in the container.
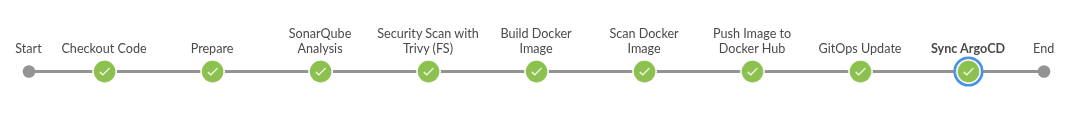
Step 4: Pipeline Breakdown: Jenkinsfile Configuration
The Jenkins pipeline outlined here automates the process of building, testing, scanning, and deploying your containerized application. The pipeline includes stages for each of these tasks.
Set Environment Variables
We define global environment variables at the start of our Jenkinsfile. These variables store reusable values like image names, repository URLs, and Vault secret paths. This makes the pipeline more readable and easier to maintain:
environment {
    IMAGE_NAME = "rihab26/nodejs-app"
    REGISTRY = "docker.io"
    GIT_REPO = "https://github.com/RihabHaddad/DevSecOps-pipeline.git"
    GITOPS_REPO = "[email protected]:RihabHaddad/GitOps.git"
    VAULT_SECRET_GITHUB = 'secret/github'
    VAULT_SECRET_DOCKERHUB = 'secret/dockerhub'
    VAULT_SECRET_SONAR = 'secret/sonarqube'
    VAULT_SECRET_GITOPS = 'secret/gitops'
}
Code Checkout
The pipeline begins by retrieving source code securely from GitHub. Credentials are retrieved dynamically from Vault to avoid storing secrets in Jenkins.
stage('Checkout Code') {
    steps {
        script {
            try {
                withVault([vaultSecrets: [[path: "${VAULT_SECRET_GITHUB}", secretValues: [[envVar: 'GITHUB_TOKEN', vaultKey: 'token']]]]) {
                    checkout scm: [
                        $class: 'GitSCM',
                        branches: [[name: '*/main']],
                        userRemoteConfigs: [[
                            url: "${GIT_REPO}",
                            credentials: [username: 'rihabhaddad', password: "${GITHUB_TOKEN}"]
                        ]]
                    ]
                }
            } catch (Exception e) {
                currentBuild.result = 'FAILURE'
                error "Checkout failed: ${e.message}"
            }
        }
    }
}
The IMAGE_TAG is dynamically generated using the latest commit hash to ensure that each build has a unique and traceable Docker image tag.
stage('Prepare') {
    steps {
        script {
            try {
                env.IMAGE_TAG = sh(script: "git rev-parse --short HEAD", returnStdout: true).trim()
            } catch (Exception e) {
                currentBuild.result = 'FAILURE'
                error "Failed to determine image tag: ${e.message}"
            }
        }
    }
}
Static Code Analysis (SonarQube)
Why use SonarQube?
It detects bugs, vulnerabilities, and code smells.
Create a docker-compose.yml file to launch SonarQube in a container:
version: '3'
services:
  sonarqube:
    image: sonarqube:latest
    container_name: sonarqube
    ports:
      - "9000:9000"
    environment:
      - SONAR_ES_BOOTSTRAP_CHECKS_DISABLE=true
    volumes:
      - sonarqube_data:/opt/sonarqube/data
      - sonarqube_extensions:/opt/sonarqube/extensions
volumes:
  sonarqube_data:
  sonarqube_extensions:
Run the following command to launch SonarQube in detached mode:
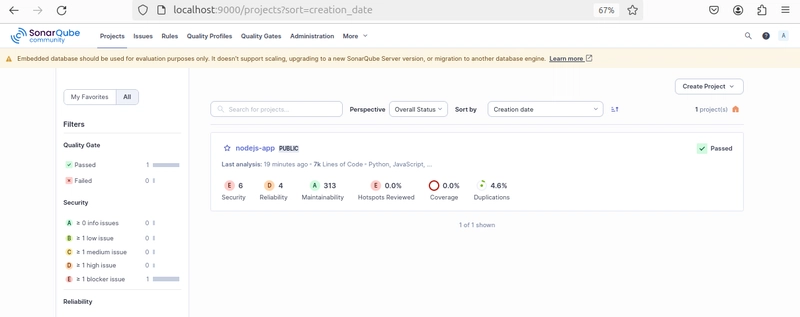
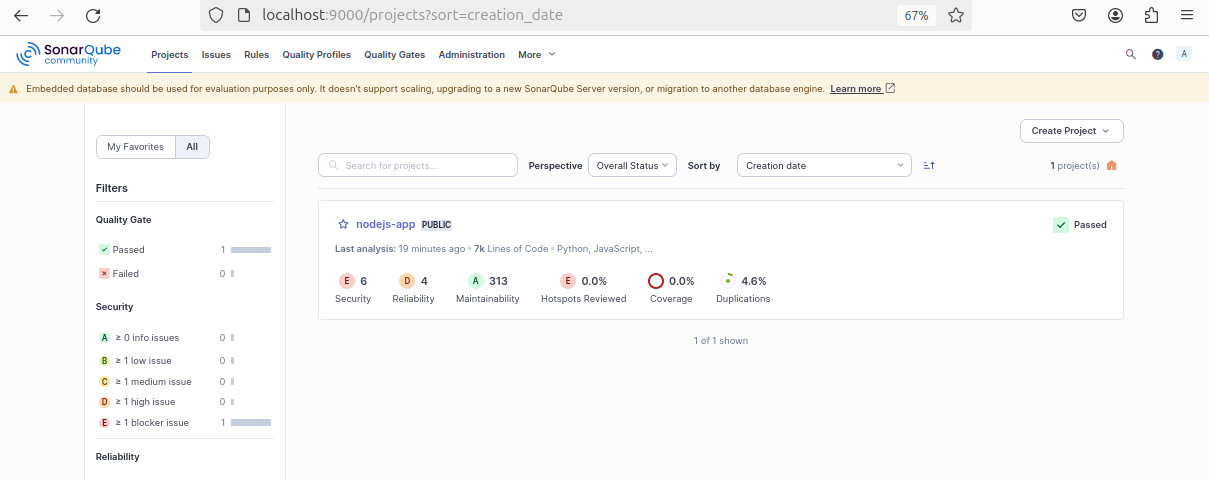
docker-compose up -dAccess: http://localhost:9000 - login with admin/admin
Jenkins Stage
The SonarQube Analysis stage scans the application's source code for quality and security issues using SonarQube. The stage dynamically retrieves the SonarQube token from Vault, ensuring that no sensitive information is stored in Jenkins. It performs the analysis on the entire codebase, excluding Java files, and reports any potential issues or vulnerabilities found.
stage('SonarQube Analysis') {
    steps {
        script {
            try {
                withVault([vaultSecrets: [[path: "${VAULT_SECRET_SONAR}", secretValues: [[envVar: 'SONAR_TOKEN', vaultKey: 'token']]]]) {
                    def scannerHome = tool name: 'SonarQube Scanner', type: 'hudson.plugins.sonar.SonarRunnerInstallation'
                    withSonarQubeEnv('SonarQube') {
                        sh """
                        ${scannerHome}/bin/sonar-scanner \
                        -Dsonar.projectKey=nodejs-app \
                        -Dsonar.sources=. \
                        -Dsonar.exclusions=**/*.java \
                        -Dsonar.login=$SONAR_TOKEN
                        """
                    }
                }
            } catch (Exception e) {
                currentBuild.result = 'FAILURE'
                error "SonarQube analysis failed: ${e.message}"
            }
        }
    }
}
Security Scanning with Trivy
Why Scan Code and Images?
You need to scan both your code and Docker images to catch known vulnerabilities before they reach production.
Filesystem Scan
Scans the application's filesystem for known vulnerabilities using Trivy. The --severity HIGH,CRITICAL flag ensures that only high and critical vulnerabilities are reported. The || true allows the pipeline to continue even if vulnerabilities are found (you can adjust this to fail the build if necessary).
stage('Security Scan with Trivy (FS)') {
    steps {
        script {
            try {
                sh 'trivy fs --scanners vuln --no-progress --severity HIGH,CRITICAL --format table --output trivy-fs-report.txt . || true'
                sh 'cat trivy-fs-report.txt'
            } catch (Exception e) {
                currentBuild.result = 'FAILURE'
                error "Trivy scan failed: ${e.message}"
            }
        }
    }
}
Build Docker Image
Builds the Docker image using the Dockerfile in the repository, tagging it with the generated IMAGE_NAME and IMAGE_TAG.
stage('Build Docker Image') {
    steps {
        script {
            try {
                sh "docker build -t ${IMAGE_NAME}:${IMAGE_TAG} ."
            } catch (Exception e) {
                currentBuild.result = 'FAILURE'
                error "Docker build failed: ${e.message}"
            }
        }
    }
}
Image Scan
Scans the newly built Docker image for vulnerabilities using Trivy. The --timeout flag prevents the scan from running indefinitely. The build will fail if high or critical vulnerabilities are detected.
stage('Scan Docker Image') {
    steps {
        script {
            try {
                def exitCode = sh(
                    script: """
                    trivy image --timeout 10m \
                    --scanners vuln \
                    --no-progress \
                    --severity HIGH,CRITICAL \
                    --format table \
                    --output trivy-report.txt \
                    ${IMAGE_NAME}:${IMAGE_TAG}
                    """,
                    returnStatus: true
                )
                sh 'cat trivy-report.txt'
            } catch (Exception e) {
                currentBuild.result = 'FAILURE'
                error "Docker image scan failed: ${e.message}"
            }
        }
    }
}
Push Docker Image to Registry
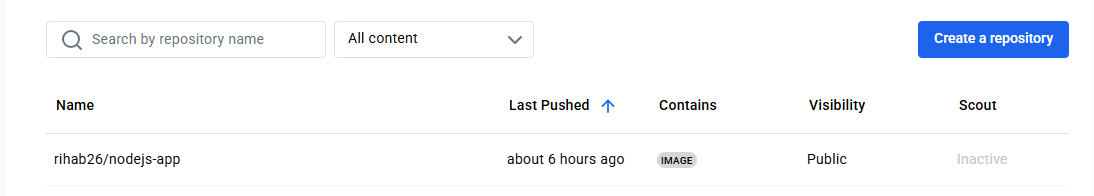
The built and scanned Docker image is then pushed to Docker Hub. Vault credentials for Docker Hub are securely retrieved to log in to the registry and push the image.
stage('Push Image to Docker Hub') {
    steps {
        script {
            try {
                withVault([vaultSecrets: [[path: "${VAULT_SECRET_DOCKERHUB}", secretValues: [
                    [envVar: 'DOCKER_USER', vaultKey: 'username'],
                    [envVar: 'DOCKER_PASS', vaultKey: 'password']
                ]]]) {
                    sh 'echo $DOCKER_PASS | docker login -u $DOCKER_USER --password-stdin'
                    sh "docker push ${IMAGE_NAME}:${IMAGE_TAG}"
                }
            } catch (Exception e) {
                currentBuild.result = 'FAILURE'
                error "Docker push failed: ${e.message}"
            }
        }
    }
}
GitOps Update and ArgoCD Sync
Here, we update the GitOps repository with the new image tag. This update triggers ArgoCD to synchronize the Kubernetes cluster with the GitOps repository, ensuring that the latest image is deployed.
stage('GitOps Update') {
    steps {
        script {
            try {
                withVault([vaultSecrets: [[path: "${VAULT_SECRET_GITOPS}", secretValues: [[envVar: 'SSH_KEY', vaultKey: 'key']]]]) {
                    sh 'rm -rf temp-repo'
                    sh "mkdir -p ~/.ssh && echo \"\$SSH_KEY\" > ~/.ssh/id_rsa && chmod 600 ~/.ssh/id_rsa"
                    sh "git clone ${GITOPS_REPO} temp-repo"
                    dir('temp-repo') {
                        sh "sed -i 's|image: .*|image: ${IMAGE_NAME}:${IMAGE_TAG}|' k8s/deployment.yaml"
                        script {
                            def changes = sh(script: "git status --porcelain", returnStdout: true).trim()
                            if (changes) {
                                sh "git add ."
                                sh "git commit -m 'Update image tag to ${IMAGE_TAG}'"
                                sh "git push origin main"
                            }
                        }
                    }
                }
            } catch (Exception e) {
                currentBuild.result = 'FAILURE'
                error "GitOps update failed: ${e.message}"
            }
        }
    }
}
GitOps Update:
- Securely clones the GitOps repository using an SSH key retrieved from Vault.
- Updates the image tag in the
k8s/deployment.yamlfile of the cloned GitOps repository with the newly builtIMAGE_NAMEandIMAGE_TAG. - Commits and pushes the changes to the GitOps repository. Crucially, it only adds the modified
deployment.yamlfile.
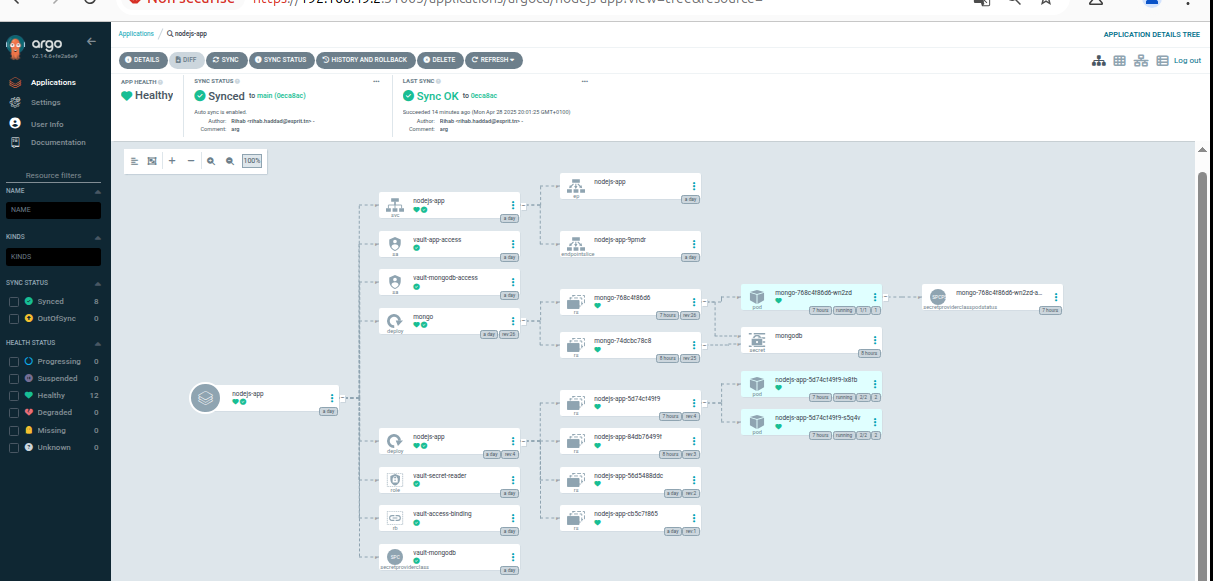
Once the GitOps repo is updated, ArgoCD will automatically detect and sync the changes to your Kubernetes cluster:
stage('Sync ArgoCD') {
    steps {
        script {
            try {
                sh "argocd app sync nodejs-app"
            } catch (Exception e) {
                currentBuild.result = 'FAILURE'
                error "ArgoCD sync failed: ${e.message}"
            }
        }
    }
}
Step 5: Prepare Your GitOps Repository
The GitOps repository serves as the declarative source of truth for your Kubernetes cluster's desired state. ArgoCD continuously monitors this repository and automatically applies any changes to your cluster.
Example Kubernetes Deployment Manifest (k8s/deployment.yaml)
This manifest defines how your application will be deployed and managed in Kubernetes.
apiVersion: apps/v1
kind: Deployment
metadata:
  name: nodejs-app
  namespace: app-ns # Ensure this matches the namespace in your ArgoCD Application
spec:
  replicas: 2
  selector:
    matchLabels:
      app: nodejs-app
  template:
    metadata:
      labels:
        app: nodejs-app
    spec:
      serviceAccountName: vault-app-access # Service account for Vault access (configured later)
      containers:
      - name: nodejs-app
        image: rihab26/nodejs-app:latest # The image tag will be updated by Jenkins
        ports:
        - containerPort: 3001
        env:
        - name: MONGODB_URI
          valueFrom:
            secretKeyRef:
              name: mongodb
              key: connection_string
      - name: node-exporter
        image: prom/node-exporter
        ports:
        - containerPort: 9100
Key Points:
- The
imagefield will be dynamically updated by the Jenkins pipeline with the uniqueIMAGE_TAG. - The namespace should match the one defined in your ArgoCD Application.
- The
serviceAccountNamewill be used for authenticating with Vault from within the Kubernetes pod to access secrets.
Example ArgoCD Application YAML
To instruct ArgoCD to manage our application deployment, create an Application resource within your Kubernetes cluster (typically in the argocd namespace):
apiVersion: argoproj.io/v1alpha1
kind: Application
metadata:
  name: nodejs-app
  namespace: argocd
spec:
  project: default
  destination:
    server: https://kubernetes.default.svc # Your Kubernetes API server address
    namespace: app-ns
  source:
    repoURL: '[email protected]:RihabHaddad/GitOps.git' # Replace with your GitOps repo URL
    targetRevision: main
    path: k8s
    directory:
      recurse: true
      exclude: '*-secret.yaml'
  syncPolicy:
    automated:
      prune: true      # Delete resources no longer in Git
      selfHeal: true   # Revert changes made outside of Git
      allowEmpty: false
    syncOptions:
    - CreateNamespace=true # Automatically create the destination namespace if it doesn't exist
    - ServerSideApply=true # Use Server-Side Apply for better conflict management
    - Replace=true       # Replace resources instead of patching (use with caution)
Explanation:
-
destination: Specifies the Kubernetes cluster and namespace where the application will be deployed. -
source: Points to your GitOps repository, the target revision (branch), and the path to the Kubernetes manifests (k8s/). -
syncPolicy: Configures how ArgoCD should synchronize the cluster with the Git repository.automatedenables automatic syncing upon changes in the Git repository.
Create a Service Account for Vault Access in Kubernetes
To enable your application pods to securely access secrets from Vault, create a dedicated Service Account in your application namespace:
apiVersion: v1
kind: ServiceAccount
metadata:
  name: vault-mongodb-access
  namespace: app-ns
annotations:
  argocd.argoproj.io/sync-wave: "-1"

---
apiVersion: v1
kind: ServiceAccount
metadata:
  name: vault-app-access
  namespace: app-ns
annotations:
  argocd.argoproj.io/sync-wave: "-1"
Apply this manifest using kubectl apply -f file -n app-ns.
In the same directory (
..), you'll also find other Kubernetes manifests (such asrbac.yamland potentially others) that are necessary for configuring Vault access within your cluster. We will link this Service Account to a specific Vault policy later to control the secrets it can access."
Step 6: Secrets Management with HashiCorp Vault (Secure Credential Handling)
Managing secrets like API keys, database passwords, or tokens directly in source code is a serious security risk. Vault helps you store and access these secrets securely.
Why use Vault?
- Centralized and secure storage of secrets
- Fine-grained access control (ACL policies)
- Dynamic secrets generation (e.g., DB credentials)
Installing Vault using Helm (Simplified Deployment)
kubectl create namespace vault
helm repo add hashicorp https://helm.releases.hashicorp.com
helm repo update
helm install vault hashicorp/vault --namespace vault
Initializing Vault (One-Time Setup)
export VAULT_ADDR=http://:8200 # Replace with your Vault service address
vault operator init
Vault will return several Unseal Keys and a Root Token. Store these keys securely, as they are required for unsealing Vault and performing administrative actions.
Unseal Vault:
Vault is sealed by default for security reasons. You need to provide a minimum of 3 Unseal Keys (out of 5) to unseal Vault.
vault operator unseal
vault operator unseal
vault operator unseal
Login to Vault using the Root Token:
vault loginEnable the Key-Value Secrets Engine (v2)
Vault supports multiple secrets engines. Here, we use the KV (Key-Value) version 2 engine to store our secrets.
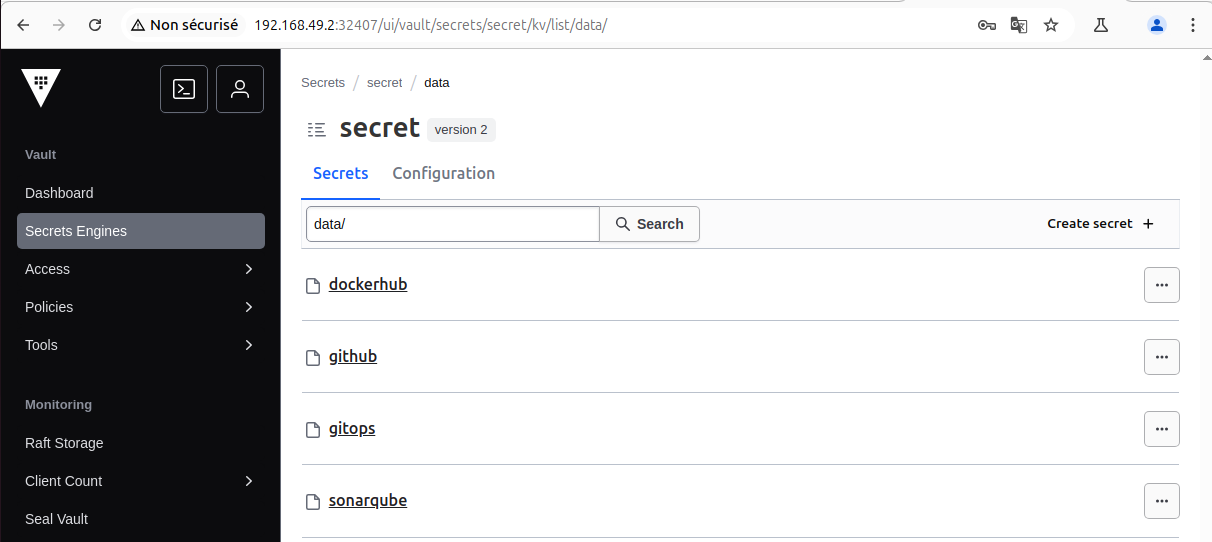
vault secrets enable -path=secret kv-v2Storing Secrets in Vault
Now, securely store the necessary secrets under the secret/ path:
vault kv put secret/github token="your_github_token"
vault kv put secret/dockerhub username="your_docker_user" password="your_docker_pass"
vault kv put secret/sonarqube token="your_sonar_token"
vault kv put secret/gitops key="$(cat ~/.ssh/id_rsa)" # Ensure your SSH private key for GitOps is available
vault kv put secret/mongodb username="your_username" password="your_password" connection_string="mongodb://username:password@mongo-service:27017"
Configure AppRole Authentication (for Jenkins)
AppRole authentication allows Jenkins to securely authenticate with Vault using a role_id and secret_id.
- Enable AppRole Authentication:
vault auth enable approle-
Create a policy for Jenkins:
Create a file named
jenkins-policy.hcl:
# jenkins-policy.hcl
path "secret/data/github" {
  capabilities = ["read"]
}
path "secret/data/dockerhub" {
  capabilities = ["read"]
}
path "secret/data/sonarqube" {
  capabilities = ["read"]
}
path "secret/data/gitops" {
  capabilities = ["read"]
}vault policy write jenkins-policy jenkins-policy.hcl-
Create an AppRole and bind the policy:
This command creates an AppRole (
jenkins-role) with thejenkins-policythat allows reading from thesecret/path.
vault write auth/approle/role/jenkins-role \
  token_policies="jenkins-policy" \
  token_ttl=1h \
token_max_ttl=4h- Retrieve Role ID and Secret ID
vault read auth/approle/role/jenkins-role/role-id
vault write -f auth/approle/role/jenkins-role/secret-id
The output of these commands provides the role_id and secret_id that you configured in the Jenkins Vault Plugin settings in Step 2.
Configure Vault Kubernetes Authentication for Dynamic Secrets Access
This allows your application pods running in Kubernetes to authenticate with Vault using their Service Account and retrieve secrets securely.
- Enable Kubernetes Authentication in Vault
vault auth enable kubernetes- Configure Kubernetes Auth Backend This step allows Vault to authenticate Kubernetes service accounts. You'll need to provide details about your Kubernetes cluster.
vault write auth/kubernetes/config \
  kubernetes_host="https://:" \
  kubernetes_ca_cert=@/var/run/secrets/kubernetes.io/serviceaccount/ca.crt \
  token_reviewer_jwt="$(cat /var/run/secrets/kubernetes.io/serviceaccount/token)" \
  issuer="https://kubernetes.default.svc.cluster.local" \
disable_iss_validation=true- Define a Vault Policy for Access Control (e.g., MongoDB Credentials): You'll define a Vault policy for controlling access to the MongoDB credentials. This policy ensures that only specific roles can access the sensitive data.
vault policy write mongodb - <<EOF
path "secret/data/mongodb" {
  capabilities = ["read"]
}
EOF-
Create a Role for Kubernetes Authentication
This role links the Kubernetes Service Account (
vault-mongodb-accessin theapp-nsnamespace) to themongodbpolicy, allowing pods with this Service Account to read MongoDB credentials.
vault write auth/kubernetes/role/mongodb-role \
  bound_service_account_names="vault-mongodb-access" \
  bound_service_account_namespaces="app-ns" \
  policies="mongodb" \
  ttl="24h"
Now, your application pods running with the vault-app-access Service Account in the app-ns namespace can authenticate to Vault using the Kubernetes Auth method and retrieve the MongoDB credentials defined in the mongodb policy. You would typically use a Vault client library within your application to perform this authentication and secret retrieval.
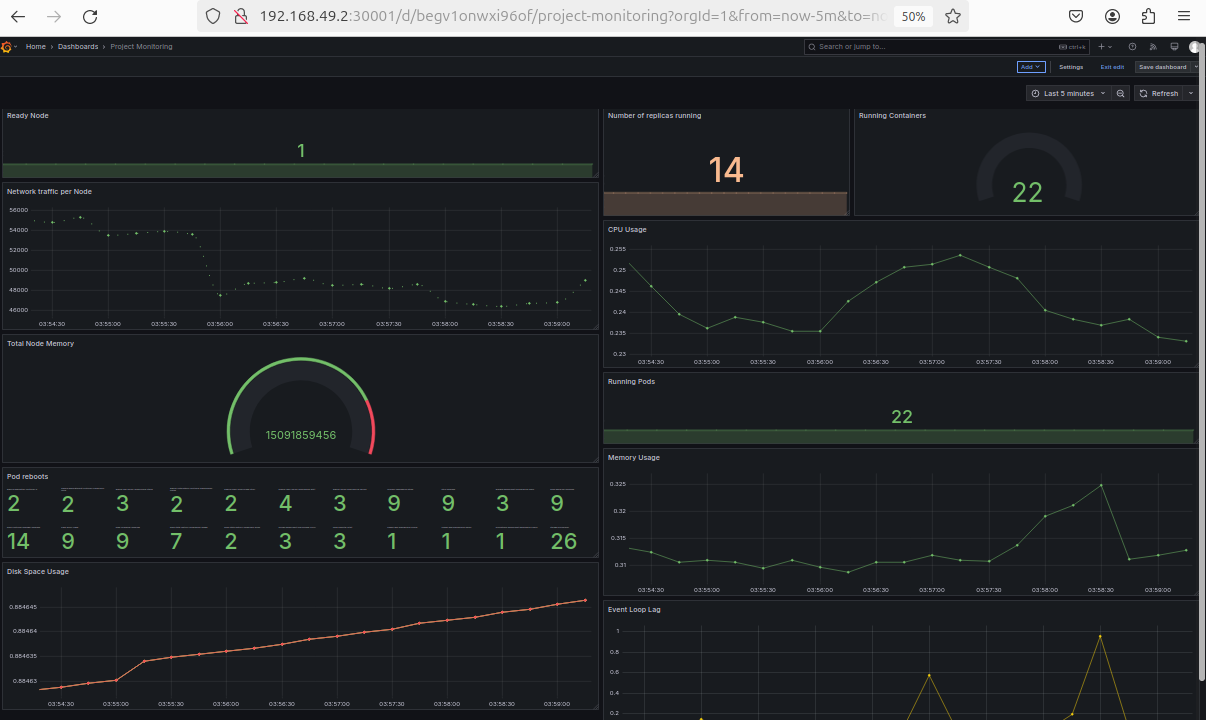
Step 7: Monitoring with Prometheus & Grafana
Implementing monitoring is crucial for gaining visibility into your application's performance and the health of your Kubernetes cluster. Prometheus will collect metrics, and Grafana will provide insightful visualizations through dashboards.
You can find comprehensive configuration files for Prometheus and Grafana in the monitoring/ folder of the example GitOps repository.
Exposing Application Metrics with ServiceMonitor
To enable Prometheus to scrape metrics from your Node.js application, you need to expose a /metrics endpoint and define a ServiceMonitor resource in Kubernetes:
apiVersion: monitoring.coreos.com/v1
kind: ServiceMonitor
metadata:
  name: nodejs-app-monitor
  namespace: monitoring # Ensure Prometheus is in the 'monitoring' namespace
  labels:
    release: prometheus # Label selector for Prometheus
spec:
  endpoints:
  - port: "3001" # The port your application exposes metrics on
    path: /metrics
    interval: 15s
  namespaceSelector:
    matchNames:
    - app-ns # Monitor services in your application namespace
  selector:
    matchLabels:
      app: nodejs-app # Select the service for your Node.js application
Apply this manifest to your Kubernetes cluster.
This connects Prometheus to your app's /metrics endpoint on port 3001
Prometheus Setup with RBAC & ConfigMap
Prometheus needs specific permissions to discover and scrape metrics. The configuration is typically defined in a ConfigMap. The example prometheus.yml in the GitOps repository demonstrates how to configure Prometheus to scrape metrics from Kubernetes pods based on labels:
Here's a snippet from the prometheus.yml ConfigMap:
apiVersion: v1
kind: ConfigMap
metadata:
  name: prometheus-config
  namespace: monitoring
data:
  prometheus.yml: |
    global:
      scrape_interval: 15s
    scrape_configs:
    - job_name: 'nodejs-app'
      kubernetes_sd_configs:
      - role: pod
        relabel_configs:
        - source_labels: [__meta_kubernetes_pod_label_app]
          action: keep
          regex: nodejs-app
You can extend this config to monitor:
- Kubernetes API servers
- Node Exporters
- kube-state-metrics
Prometheus is also granted access via ServiceAccount, ClusterRole, and ClusterRoleBinding defined in the same GitOps folder.
Deploying Grafana and Accessing Dashboards
Grafana provides a user-friendly interface for visualizing the metrics collected by Prometheus. Deploy Grafana to your Kubernetes cluster (refer to the example GitOps repository for the Deployment and Service manifests).
apiVersion: apps/v1
kind: Deployment
metadata:
  name: grafana-deployment
  namespace: monitoring
spec:
  replicas: 1
  selector:
    matchLabels:
      app: grafana
  template:
    metadata:
      labels:
        app: grafana
    spec:
      containers:
      - name: grafana
        image: grafana/grafana
        ports:
        - containerPort: 3000
You can access Grafana by port-forwarding the Grafana service:
kubectl port-forward svc/grafana-service -n monitoring 3000:3000Then, open your web browser and navigate to http://localhost:3000. The default login credentials are admin / admin. Change these immediately in a production environment.
Once logged in:
Add Prometheus as a Data Source:
Navigate to Configuration > Data sources.
Click Add data source and select Prometheus.
In the HTTP Settings section, enter the Prometheus service URL:http://prometheus-service.monitoring.svc:9090.
Click Save & test.-
Import Dashboards:
Navigate to Create > Import.
You can import pre-built dashboards from the Grafana community by entering their ID:- Node.js app metrics: Dashboard ID 1860
- Kubernetes cluster overview: Dashboard ID 315 or 6417
- Node Exporter full metrics: Dashboard ID 1860
Alternatively, you can create your own custom dashboards tailored to your specific monitoring needs.
Note: You can also deploy the entire Prometheus + Grafana stack using Helm for a quick, modular, and maintainable setup:
helm repo add prometheus-community https://prometheus-community.github.io/helm-charts
helm repo update
helm install monitoring prometheus-community/kube-prometheus-stack
This installs Prometheus, Grafana, Alertmanager, node-exporter, and more directly into your Kubernetes cluster.
📚 Glossary
- CI/CD: Practices to automate building, testing, and deploying software changes.
- DevSecOps: Integrating security practices into the DevOps lifecycle.
- GitOps: Using Git as the source of truth for infrastructure and deployments.
- Jenkins: Open-source server for managing CI/CD pipelines.
- Docker: Platform for building and running applications in containers.
- Trivy: Vulnerability scanner for containers and repositories.
- SonarQube: Tool for continuous code quality inspection.
- ArgoCD: GitOps tool for Kubernetes continuous delivery.
- Vault: Secret management system for storing sensitive information.
- Prometheus: Monitoring and alerting toolkit for time-series data.
- Grafana: Visualization platform for metrics and logs.
- kubectl: Command-line tool for managing Kubernetes clusters.
- Minikube: Tool for running a local Kubernetes cluster.
- Helm: Package manager for Kubernetes apps.
This tutorial walked you through building a secure, production-grade DevSecOps pipeline using Jenkins, ArgoCD, Trivy, SonarQube, and Vault, creating a foundation for rapid, reliable, and secure software delivery.
Remember, security is a continuous journey - keep refining your pipeline and adapting to evolving best practices.
I'm committed to continuous improvement. To that end, I plan to:
- Add GitHub Actions for CI (to showcase pipeline flexibility)
- Investigate canary/blue-green deployments (for enhanced release reliability)
Let's work together to make DevOps more secure and accessible. Contributions and discussions are welcome!
Reach out with questions or collaboration ideas - or just drop a ⭐️ if you find it useful!
GitHub Repositories:
🔗 [App code]: DevSecOps - pipeline
🔗 [GitOps config]: GitOps
Find me on LinkedIn: Rihab Haddad or email [[email protected]]