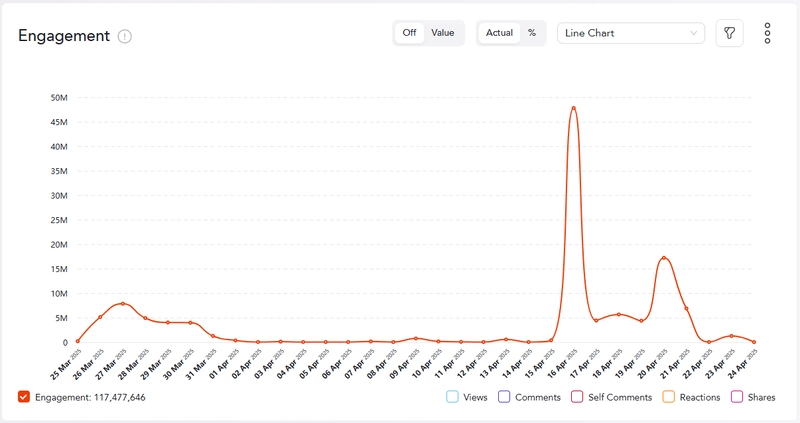
Users look at their performance monitoring dashboards and see this:
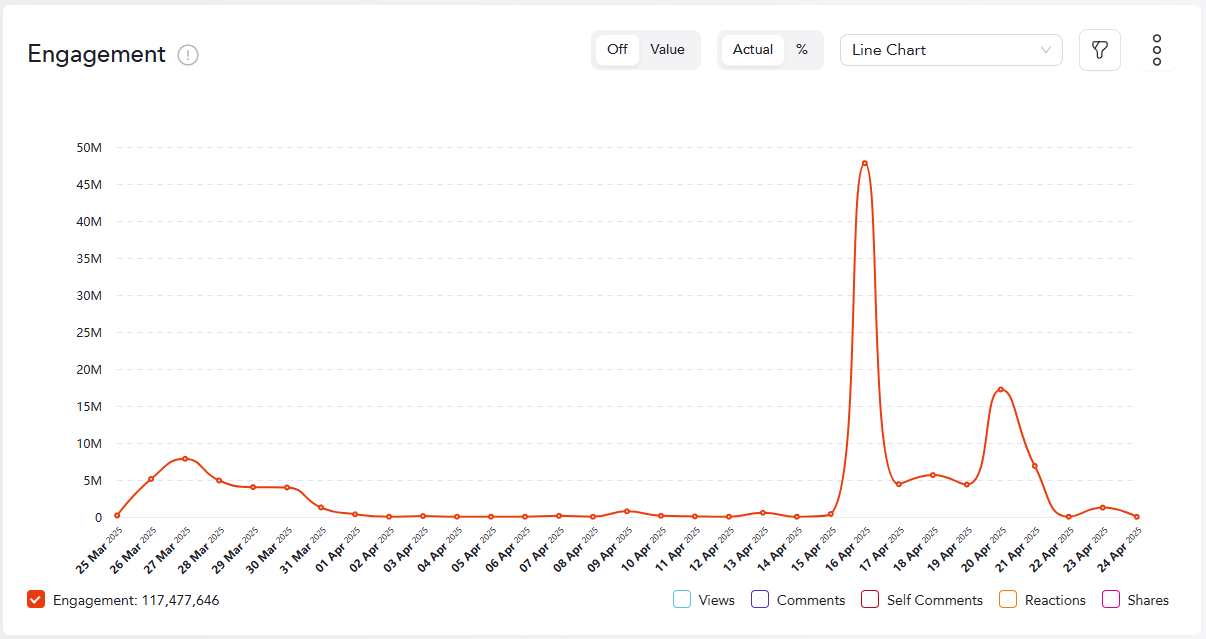
They can view the numbers and possibly inspect them to see the raw data of any point they choose, but it's really a lot of work. first off, it isn't clear where to look, and secondly, do they have to comb through every comments availiable in the raw data to manage to get some insight?
With AI, this should be changing, which is why we introduced a feature called spike detection and analysis
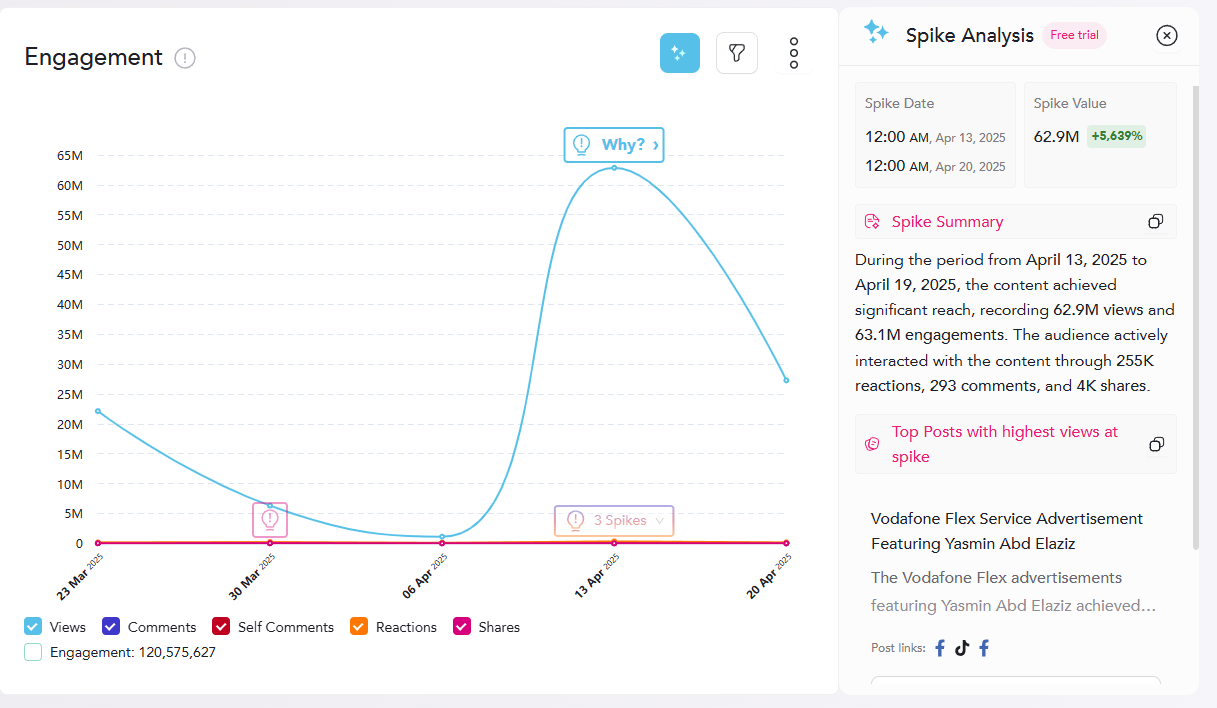
The point here is that we would pinpoint specific time intervals that we think had an interesting spike in some metric, and then we would be able to understand more about why it happened.
The issue was.. we had no idea how to detect those spikes, and who should do it?
AI team, full stack devs, data engineers?
And what would we even look at to determine if something is a spike or if it's interesting enough that we can get insights out of it.
This is where this demo comes in:
a live preview is available here
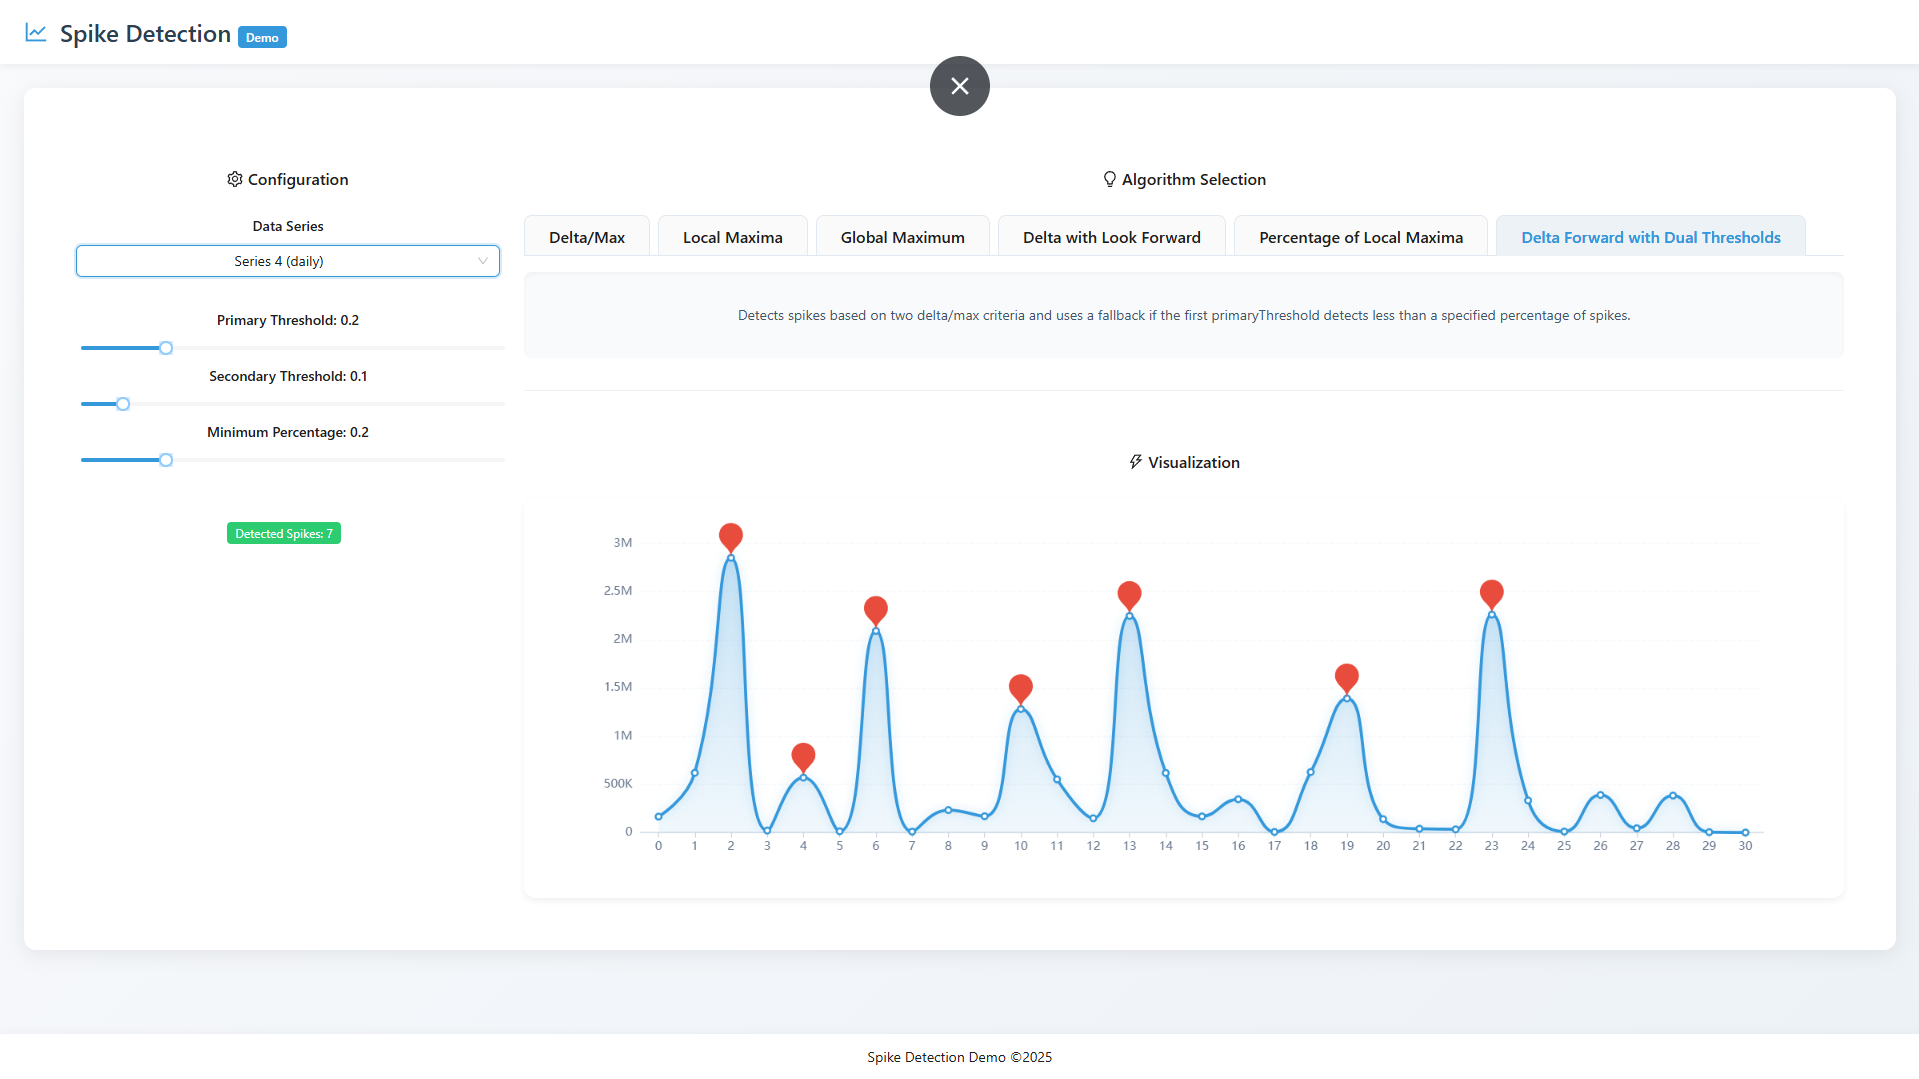
First off to answer the question of what do we deem as interesting, here are the decisions I came to,
- Our focus is visual, what the user sees as interesting is the same thing we should present an indication over for users to click.
- We should focus only on increases, since in the social media domain, sudden increases in engagement or most other metrics would mean that is less data to process and less insights to look into.
the methods
Let me explain a couple of terms i will later use
- chart height: chart height is the is the distance from the heights point that the user can see to the lowest.
- Maxima: maxima is another words for peaks, it means a point where both the points before and after it are lesser than it in magnitude
Those 2 concepts led me to the main 2 methods of spike detection
#1: Maxima
Global maximum, local maxima, and percentage of local maxima
#2: delta/max threshold
Picking spikes based on their delta to the previous point passes a certain threshold.
The methods are: delta/max, delta/max with look forward and delta forward with dual thresholds.
The demo provides all these methods with their variations and some hyperparameters you can tweak, and we used this demo to engage the stakeholders and decide which one to pick and with what parameter.
You can pick multiple series of real data or artificial function to see how each algorithm performs on different data.