
This article will be divided into the following 7 sections:
- Technology Selection
- Unified Standards
- Testing
- Deployment
- Monitoring
- Performance Optimization
- Refactoring
Some sections provide very detailed practical tutorials for hands-on practice.
Additionally, I've created a frontend engineering demo on GitHub. This demo includes JavaScript, CSS, and Git validation. The JavaScript and CSS validation require VSCode installation, and specific tutorials will be mentioned later in this article.
Technology Selection
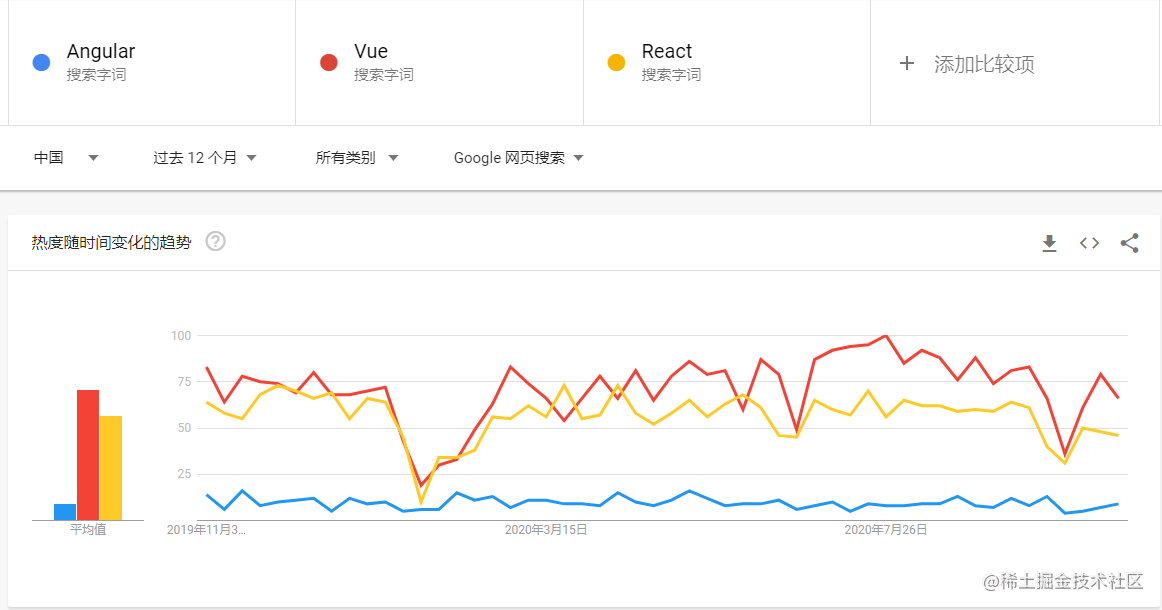
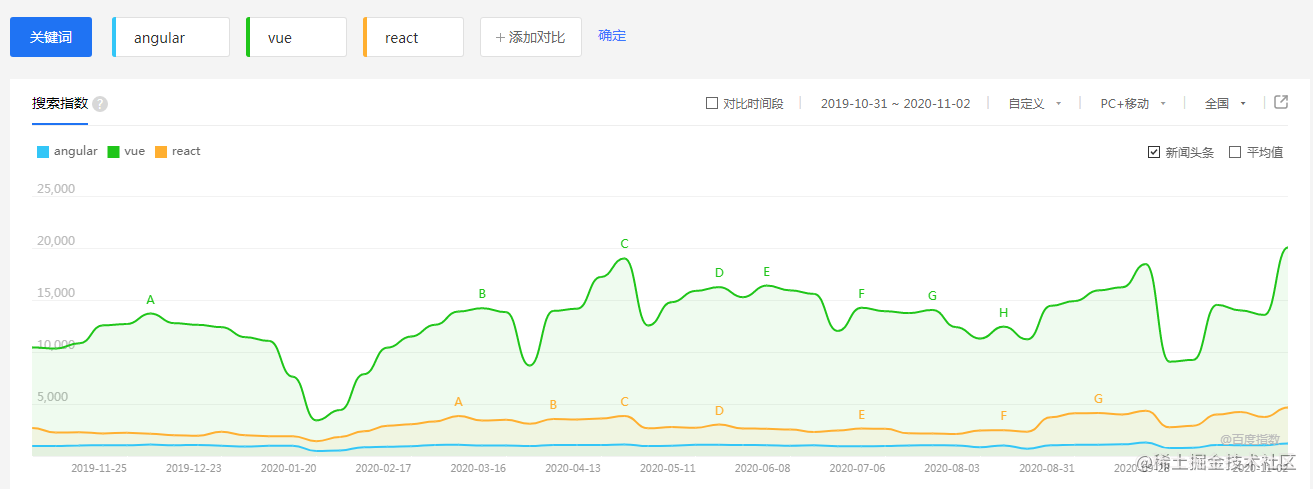
For frontend development, technology selection is quite simple. It's like a multiple-choice question - choose one of the three major frameworks. In my opinion, you can select based on the following two characteristics:
- Choose what you or your team is most familiar with, ensuring that someone can fix issues when facing tricky problems.
- Choose frameworks with high market share. In other words, choose what makes recruitment easier.
The second point is especially important for small companies. Small companies already have difficulty recruiting, and if you choose a framework with low market share (such as Angular), you'll barely see any resumes...
UI component libraries are even simpler - use the one with the most stars on GitHub. More stars means more users, and many issues have already been encountered and resolved by others, saving you trouble.
Unified Standards
Code Standards
Let's first look at the benefits of unified code standards:
- Standardized code promotes team collaboration
- Standardized code reduces maintenance costs
- Standardized code helps with code review
- Developing standardized code habits contributes to a programmer's growth
When team members strictly follow code standards, it ensures that everyone's code looks like it was written by the same person. Reading someone else's code becomes like reading your own. More importantly, we recognize the importance of standards and maintain standardized development habits.
How to Establish Code Standards
It's recommended to find a good code standard and customize it based on your team's needs.
Here are some JavaScript code standards with many stars:
- airbnb (101k stars, English version), airbnb-Chinese version
- standard (24.5k stars) Chinese version
- Baidu Frontend Coding Specification 3.9k
There are also many CSS code standards, such as:
How to Check Code Standards
You can use ESLint to check if your code complies with your team's standards. Let's see how to configure ESLint for code checking.
- Download dependencies
// eslint-config-airbnb-base uses airbnb code standards
npm i -D babel-eslint eslint eslint-config-airbnb-base eslint-plugin-import- Configure the
.eslintrcfile
{
    "parserOptions": {
        "ecmaVersion": 2019
    },
    "env": {
        "es6": true,
    },
    "parser": "babel-eslint",
    "extends": "airbnb-base",
}- Add this line to the
scriptsinpackage.json:"lint": "eslint --ext .js test/ src/". Then runnpm run lintto start validating code. Thetest/ src/in the code specifies which code directories to check, indicating that you want to check code in thetestandsrcdirectories.
However, checking code this way is too inefficient as you have to manually check each time. Plus, when errors are reported, you still need to manually modify the code.
To improve these drawbacks, we can use VSCode. With VSCode and appropriate configurations, you can automatically validate and format code every time you save, eliminating the need for manual work.
For CSS code standard checking, use the stylelint plugin.
Due to space limitations, for specific configuration instructions, please refer to my other article ESlint + stylelint + VSCode automated code formatting (2020).
Git Standards
Git standards include two aspects: branch management standards and git commit standards.
Branch Management Standards
Projects generally have a main branch (master) and other branches.
When a team member needs to develop a new feature or fix a bug, they create a new branch from the master branch. For example, if a project needs to change from client-side rendering to server-side rendering, create a new branch called ssr, and merge it back to the master branch after development.
For bug fixes, you can also create a new branch from the master branch, naming it after the bug number (though our small team finds this troublesome and doesn't do this unless there's a particularly major bug).
Git Commit Standards
():
 LINE>

 LINE>


    Enter fullscreen mode


    Exit fullscreen mode


This is roughly divided into three parts (separated by blank lines):
Title line: Required, describes the main type and content of modification
Main content: Describes why the modification was made, what kind of modification was made, and the development thought process
Footer notes: Can include comments, bug number links


  type: commit type

feat: New feature
fix: Bug fix
perf: Code changes to improve performance
refactor: Code refactoring (modifying code without affecting internal behavior or functionality)
docs: Documentation changes
style: Code format changes, not CSS changes (e.g., semicolon modifications)
test: Adding or modifying test cases
build: Changes affecting project builds or dependencies
revert: Reverting previous commits
ci: Changes to continuous integration related files
chore: Other changes (not in above types)
release: Release new version
workflow: Changes to workflow related files

scope: The scope affected by the commit, such as: route, component, utils, build...
subject: The summary of the commit
body: Specific content of the commit, can be multi-line.
footer: Some notes, usually BREAKING CHANGE or links to fixed bugs.
Examples


  fix (Bug Fix)
If the bug fix only affects the current file, you can omit the scope. If the impact is more extensive, add a scope description.For example, if this bug fix affects globally, you can add "global". If it affects a specific directory or functionality, you can add the path of that directory or the corresponding feature name.

// Example 1
fix(global): Fix checkbox unable to be checked
// Example 2 - the "common" in parentheses below is the name of common management
fix(common): Fix font size too small, change default font size to 14px for all pages under common management
// Example 3
fix: value.length -> values.length


    Enter fullscreen mode


    Exit fullscreen mode


  feat (Adding New Features or Pages)

feat: Add website homepage static page

This is an example assuming some description of a static page for inspection tasks.

Here are notes, which can include bug links or important information.


    Enter fullscreen mode


    Exit fullscreen mode


  chore (Other Changes)
Chore literally translates to daily matters or routine work, meaning modifications not in other commit types.

chore: Change "View Details" to "Details" in the table


    Enter fullscreen mode


    Exit fullscreen mode


Other types of commits are similar to the three examples above, so they won't be elaborated.


  Validating Git Commit Standards
To validate git commit standards, primarily use git's pre-commit hook function. Of course, you'll also need a helper tool to assist with validation.Download the helper tool

npm i -D husky


    Enter fullscreen mode


    Exit fullscreen mode


Add the following code to package.json

"husky": {
  "hooks": {
    "pre-commit": "npm run lint",
    "commit-msg": "node script/verify-commit.js",
    "pre-push": "npm test"
  }
}


    Enter fullscreen mode


    Exit fullscreen mode


Then create a folder named script in your project root directory, and create a file called verify-commit.js with the following code:

const msgPath = process.env.HUSKY_GIT_PARAMS
const msg = require('fs')
.readFileSync(msgPath, 'utf-8')
.trim()

const commitRE = /^(feat|fix|docs|style|refactor|perf|test|workflow|build|ci|chore|release|workflow)(\(.+\))?: .{1,50}/

if (!commitRE.test(msg)) {
    console.log()
    console.error(`
        Invalid commit message format.
        Please check the git commit submission specification: https://github.com/woai3c/Front-end-articles/blob/master/git%20commit%20style.md
    `)

    process.exit(1)
}


    Enter fullscreen mode


    Exit fullscreen mode


Now let's explain the meaning of each hook:

"pre-commit": "npm run lint" executes npm run lint before git commit to check code format.

"commit-msg": "node script/verify-commit.js" executes the verify-commit.js script during git commit to validate the commit message. It will report an error if it doesn't meet the format defined in the script.

"pre-push": "npm test" executes npm test before you run git push to push code to the remote repository. If the test fails, the push won't proceed.


  Project Standards
This mainly refers to how project files are organized and named.Let's use our Vue project as an example.

├─public
├─src
├─test


    Enter fullscreen mode


    Exit fullscreen mode


A project typically contains public (public resources not processed by webpack), src (source code), and test (test code) directories. The src directory can be further subdivided:

├─api (interfaces)
├─assets (static resources)
├─components (common components)
├─styles (common styles)
├─router (router)
├─store (vuex global data)
├─utils (utility functions)
└─views (pages)


    Enter fullscreen mode


    Exit fullscreen mode


If filenames are too long, use hyphens as separators.


  UI Standards
UI standards need to be communicated and agreed upon by frontend developers, UI designers, and product managers. Using a unified UI component library is recommended.Benefits of establishing UI standards:
Unify page UI standards, saving UI design time
Improve frontend development efficiency


  Testing
Testing is an essential part of frontend engineering. Its purpose is to find bugs, and the earlier bugs are found, the lower the cost required to fix them. More importantly, its role is more significant in the future rather than the present.Imagine that six months later, you need to add a new feature to your project. After adding it, you're not sure if it affects existing functionality and need to test. Since too much time has passed, you're no longer familiar with the project code. In this situation, if you haven't written tests, you'd have to manually test everything repeatedly. But if you've written tests, you just need to run the test code once, saving time and effort.Writing tests also allows you to modify code without psychological burden, without constantly worrying about whether changes will cause issues or bugs. With tests, these concerns are eliminated.The most commonly used testing in frontend is unit testing (I rarely use end-to-end testing and am not familiar with it), which I'll focus on explaining.


  Unit Testing
Unit testing involves testing a function, component, or class, targeting a relatively small granularity.How should it be written?
Write tests based on correctness, meaning correct inputs should yield normal results.
Write tests based on exceptions, meaning incorrect inputs should yield error results.


  Testing a Function
For example, an absolute value function abs(), inputs 1,2 should yield the same output as the input; inputs -1,-2 should yield results opposite to the input. If a non-numeric input like "abc" is provided, a type error should be thrown.


  Testing a Class
Assume there's a class like this:

class Math {
    abs() {

    }

    sqrt() {

    }

    pow() {

    }
    ...
}


    Enter fullscreen mode


    Exit fullscreen mode


Unit testing requires testing all methods of this class.


  Testing a Component
Component testing is more difficult because many components involve DOM operations.For example, an image upload component has a method to convert images to base64 code. How do you test this? Tests usually run in a Node environment, which doesn't have DOM objects.Let's first review the image upload process:
Click  to select and upload an image.
Trigger the change event of the input to get the file object.
Use FileReader to convert the image to base64 code.
This process is the same as the following code:

document.querySelector('input').onchange = function fileChangeHandler(e) {
    const file = e.target.files[0]
    const reader = new FileReader()
    reader.onload = (res) => {
        const fileResult = res.target.result
        console.log(fileResult) // Output base64 code
    }

    reader.readAsDataURL(file)
}


    Enter fullscreen mode


    Exit fullscreen mode


The code above is just a simulation. In real situations, it should be used like this:

document.querySelector('input').onchange = function fileChangeHandler(e) {
    const file = e.target.files[0]
    tobase64(file)
}

function tobase64(file) {
    return new Promise((resolve, reject) => {
        const reader = new FileReader()
        reader.onload = (res) => {
            const fileResult = res.target.result
            resolve(fileResult) // Output base64 code
        }

        reader.readAsDataURL(file)
    })
}


    Enter fullscreen mode


    Exit fullscreen mode


As you can see, the code above uses the window's event object event and FileReader. This means that as long as we can provide these two objects, we can run it in any environment. So we can add these two objects in the test environment:

// Rewrite File
window.File = function () {}

// Rewrite FileReader
window.FileReader = function () {
    this.readAsDataURL = function () {
        this.onload
            && this.onload({
                target: {
                    result: fileData,
                },
            })
    }
}


    Enter fullscreen mode


    Exit fullscreen mode


Then the test can be written like this:

// Prepare file content beforehand
const fileData = 'data:image/test'

// Provide a fake file object to the tobase64() function
function test() {
    const file = new File()
    const event = { target: { files: [file] } }
    file.type = 'image/png'
    file.name = 'test.png'
    file.size = 1024

    it('file content', (done) => {
        tobase64(file).then(base64 => {
            expect(base64).toEqual(fileData) // 'data:image/test'
            done()
        })
    })
}

// Execute the test
test()


    Enter fullscreen mode


    Exit fullscreen mode


With this hack, we've achieved testing for components involving DOM operations. My vue-upload-imgs library uses this approach for unit testing, feel free to check it out.


  TDD (Test-Driven Development)
TDD means writing test code in advance based on requirements, then implementing functionality according to the test code.The intention behind TDD is good, but if your requirements change frequently (you know what I mean), it's not a good idea. You might end up modifying test code every day while barely touching business code.
So until now, in over three years of my programming career, I haven't tried TDD development.Despite the challenging environment, TDD should be attempted when conditions allow. For example, when you're responsible for a project and not too busy, you can use this method to write test cases.


  Recommended Testing Framework
My commonly used testing framework is jest. Its advantage is that it has Chinese documentation, and the API is clear and easy to understand at a glance.


  Deployment
Before learning automated deployment, this is how I deployed projects:
Run tests with npm run test.
Build the project with npm run build.
Place the packaged files on a static server.
Doing this once or twice is fine, but if you do it every day, a lot of time is wasted on repetitive operations. So we need to learn automated deployment to completely free our hands.Automated deployment (also called Continuous Deployment, abbreviated as CD) generally has two trigger methods:
Polling.
Listening for webhook events.


  Polling
Polling means the build software automatically executes packaging and deployment operations at regular intervals.This approach isn't ideal, as it's very possible that I might change code right after the software finishes deploying. To see the effect of the new page, I'd have to wait until the next build starts.Another side effect is that if I don't change any code all day, the build software will still continuously execute packaging and deployment operations, wasting resources.Therefore, most build software now uses the approach of listening for webhook events for deployment.


  Listening for webhook Events
A webhook function is set up on your build software to monitor a certain event (usually monitoring the push event). When the event is triggered, it automatically executes predefined scripts.For example, Github Actions has this feature.For newcomers, it's impossible to learn automated deployment just from this section. Therefore, I've specially written an automated deployment tutorial that doesn't require you to learn automated deployment knowledge in advance. Just follow the guide to achieve frontend project automated deployment.Frontend Project Automated Deployment—Super Detailed Tutorial (Jenkins, Github Actions). The tutorial is provided, and if you find it useful after reading, don't forget to give it a like. Much appreciated.


  Monitoring
Monitoring includes performance monitoring and error monitoring. Its purpose is to provide early warnings and track and locate issues.


  Performance Monitoring
Performance monitoring generally uses window.performance for data collection.
The Performance interface can obtain performance-related information from the current page. It's part of the High Resolution Time API and also integrates the Performance Timeline API, Navigation Timing API, User Timing API, and Resource Timing API.
The timing property of this API includes the start and end times of each stage of page loading.To help everyone understand the meaning of each timing property, I found an introduction about timing written by a fellow netizen on Zhihu (whose name I've forgotten and couldn't find later, my apologies), which I'm reposting here.

timing: {
        // Timestamp when the previous page unload event ended in the same browser. If there's no previous page, this value will be the same as fetchStart.
    navigationStart: 1543806782096,

    // Timestamp when the unload event from the previous page was fired. If there's no previous page, this value will return 0.
    unloadEventStart: 1543806782523,

    // Corresponding to unloadEventStart, the timestamp when the unload event handling was completed. If there's no previous page, this value will return 0.
    unloadEventEnd: 1543806782523,

    // Timestamp when the first HTTP redirect began. If there are no redirects, or if one of the redirects is from a different origin, this value will return 0.
    redirectStart: 0,

    // Timestamp when the last HTTP redirect was completed (that is, when the last bit of the HTTP response was received). If there are no redirects, or if one of the redirects is from a different origin, this value will return 0.
    redirectEnd: 0,

    // Timestamp when the browser is ready to fetch the document using an HTTP request. This timestamp will be before checking any application caches.
    fetchStart: 1543806782096,

    // Timestamp when the DNS domain lookup started.
        // If a persistent connection is used, or this information is stored in cache or local resources, this value will be the same as fetchStart.
    domainLookupStart: 1543806782096,

    // Timestamp when the DNS domain lookup was completed.
    // If local cache is used (meaning no DNS lookup) or a persistent connection, it will be equal to the fetchStart value.
    domainLookupEnd: 1543806782096,

    // Timestamp when the HTTP (TCP) domain lookup ended.
        // If a persistent connection is used, or this information is stored in cache or local resources, this value will be the same as fetchStart.
    connectStart: 1543806782099,

    // HTTP (TCP) returns the timestamp when the connection between the browser and server was established.
        // If it's a persistent connection, the return value is the same as the fetchStart property. Connection establishment refers to the completion of all handshakes and authentication processes.
    connectEnd: 1543806782227,

    // HTTPS returns the timestamp when the browser started the handshake process for a secure connection with the server. If the current page doesn't require a secure connection, it returns 0.
    secureConnectionStart: 1543806782162,

    // Returns the timestamp when the browser sent the HTTP request to the server (or started reading from local cache).
    requestStart: 1543806782241,

    // Returns the timestamp when the browser received (or read from local cache) the first byte.
        // If the transport layer fails after starting the request and the connection is reopened, this property will be set to the time corresponding to the new request.
    responseStart: 1543806782516,

    // Returns the timestamp when the browser received (or read from local cache or local resources) the last byte
        // (or if the HTTP connection has already closed, returns the closing time).
    responseEnd: 1543806782537,

    // Timestamp when the current webpage DOM structure started parsing (i.e., when Document.readyState property changed to "loading" and the corresponding readystatechange event was triggered).
    domLoading: 1543806782573,

    // Timestamp when the current webpage DOM structure finished parsing and started loading embedded resources (i.e., when Document.readyState property changed to "interactive" and the corresponding readystatechange event was triggered).
    domInteractive: 1543806783203,

    // Timestamp when the parser sent the DOMContentLoaded event, meaning all scripts that need to be executed have been parsed.
    domContentLoadedEventStart: 1543806783203,

    // Timestamp when all scripts that need immediate execution have been executed (regardless of execution order).
    domContentLoadedEventEnd: 1543806783216,

    // Timestamp when the current document parsing is complete, i.e., when Document.readyState changes to 'complete' and the corresponding readystatechange is triggered.
    domComplete: 1543806783796,

    // Timestamp when the load event was sent. If this event hasn't been sent yet, its value will be 0.
    loadEventStart: 1543806783796,

    // Timestamp when the load event ended, i.e., when the loading event was completed. If this event hasn't been sent yet or hasn't been completed, its value will be 0.
    loadEventEnd: 1543806783802
}


    Enter fullscreen mode


    Exit fullscreen mode


From this data, we can derive several useful times:

// Redirect time
redirect: timing.redirectEnd - timing.redirectStart,
// DOM rendering time
dom: timing.domComplete - timing.domLoading,
// Page loading time
load: timing.loadEventEnd - timing.navigationStart,
// Page unload time
unload: timing.unloadEventEnd - timing.unloadEventStart,
// Request time
request: timing.responseEnd - timing.requestStart,
// Current time when getting performance information
time: new Date().getTime(),


    Enter fullscreen mode


    Exit fullscreen mode


Another important time is white screen time, which refers to the time from entering the URL to when the page begins to display content.Placing the following script before  allows you to get the white screen time.


    whiteScreen = new Date() - performance.timing.navigationStart


    Enter fullscreen mode


    Exit fullscreen mode


With these times, you can determine how well the page's first screen loads.Additionally, through the window.performance.getEntriesByType('resource') method, we can obtain the loading time of related resources (js, css, img...). It returns all resources currently loaded on the page.It generally includes the following types:
script
link
img
css
fetch
other
xmlhttprequest
We only need the following information:

// Resource name
name: item.name,
// Resource loading time
duration: item.duration.toFixed(2),
// Resource size
size: item.transferSize,
// Protocol used by the resource
protocol: item.nextHopProtocol,


    Enter fullscreen mode


    Exit fullscreen mode


Now, let's write a few lines of code to collect this data.

// Collect performance information
const getPerformance = () => {
    if (!window.performance) return
    const timing = window.performance.timing
    const performance = {
        // Redirect time
        redirect: timing.redirectEnd - timing.redirectStart,
        // White screen time
        whiteScreen: whiteScreen,
        // DOM rendering time
        dom: timing.domComplete - timing.domLoading,
        // Page loading time
        load: timing.loadEventEnd - timing.navigationStart,
        // Page unload time
        unload: timing.unloadEventEnd - timing.unloadEventStart,
        // Request time
        request: timing.responseEnd - timing.requestStart,
        // Current time when getting performance information
        time: new Date().getTime(),
    }

    return performance
}

// Get resource information
const getResources = () => {
    if (!window.performance) return
    const data = window.performance.getEntriesByType('resource')
    const resource = {
        xmlhttprequest: [],
        css: [],
        other: [],
        script: [],
        img: [],
        link: [],
        fetch: [],
        // Current time when getting resource information
        time: new Date().getTime(),
    }

    data.forEach(item => {
        const arry = resource[item.initiatorType]
        arry && arry.push({
            // Resource name
            name: item.name,
            // Resource loading time
            duration: item.duration.toFixed(2),
            // Resource size
            size: item.transferSize,
            // Protocol used by the resource
            protocol: item.nextHopProtocol,
        })
    })

    return resource
}


    Enter fullscreen mode


    Exit fullscreen mode


  Summary
By interpreting performance and resource information, we can determine that slow page loading has several reasons:
Too many resources
Slow network speed
Too many DOM elements
Apart from the user's slow network speed, which we can't control, the other two reasons can be resolved. Performance optimization will be discussed in the next section, "Performance Optimization."


  Error Monitoring
Currently, three types of errors can be captured:
Resource loading errors, captured through addEventListener('error', callback, true) during the capture phase.
JavaScript execution errors, captured through window.onerror.
Promise errors, captured through addEventListener('unhandledrejection', callback), though without line and column information, only manually thrown error information.
We can create an error array variable errors to add relevant error information when errors occur, and then report them collectively at a certain stage. Here's how to do it:

// Capture resource loading failure errors for js, css, img...
addEventListener('error', e => {
    const target = e.target
    if (target != window) {
        monitor.errors.push({
            type: target.localName,
            url: target.src || target.href,
            msg: (target.src || target.href) + ' is load error',
            // Time when the error occurred
            time: new Date().getTime(),
        })
    }
}, true)

// Monitor JavaScript errors
window.onerror = function(msg, url, row, col, error) {
    monitor.errors.push({
        type: 'javascript',
        row: row,
        col: col,
        msg: error && error.stack? error.stack : msg,
        url: url,
        // Time when the error occurred
        time: new Date().getTime(),
    })
}

// Monitor Promise errors - drawback is that line number data can't be obtained
addEventListener('unhandledrejection', e => {
    monitor.errors.push({
        type: 'promise',
        msg: (e.reason && e.reason.msg) || e.reason || '',
        // Time when the error occurred
        time: new Date().getTime(),
    })
})


    Enter fullscreen mode


    Exit fullscreen mode


  Summary
Through error collection, we can understand the types and quantities of errors occurring on the website, allowing for adjustments to reduce errors.
For complete code and a DEMO, please refer to the end of my other article Frontend Performance and Error Monitoring. You can copy the code (HTML file) and test it locally.


  Data Reporting


  Performance Data Reporting
Performance data can be reported after the page has loaded, to avoid impacting page performance.

window.onload = () => {
    // Get performance and resource information during browser idle time
    // https://developer.mozilla.org/zh-CN/docs/Web/API/Window/requestIdleCallback
    if (window.requestIdleCallback) {
        window.requestIdleCallback(() => {
            monitor.performance = getPerformance()
            monitor.resources = getResources()
        })
    } else {
        setTimeout(() => {
            monitor.performance = getPerformance()
            monitor.resources = getResources()
        }, 0)
    }
}


    Enter fullscreen mode


    Exit fullscreen mode


Of course, you can also set up a timer for cyclic reporting. However, it's best to compare and deduplicate data before each report to avoid repeatedly reporting the same data.


  Error Data Reporting
The code I provided in the DEMO collects all errors in an errors array and reports them collectively at a certain stage (delayed reporting).
Actually, you can also change it to report when an error occurs (immediate reporting). This avoids the problem of error data being lost if the user closes the webpage before the delayed reporting triggers after error collection.

// Monitor JavaScript errors
window.onerror = function(msg, url, row, col, error) {
    const data = {
        type: 'javascript',
        row: row,
        col: col,
        msg: error && error.stack? error.stack : msg,
        url: url,
        // Time when the error occurred
        time: new Date().getTime(),
    }

    // Immediate reporting
    axios.post({ url: 'xxx', data, })
}


    Enter fullscreen mode


    Exit fullscreen mode


  SPA
The window.performance API has a drawback - when switching routes in an SPA, the data in window.performance.timing doesn't update.
So we need to find another way to record the time from route switching to loading completion.
Taking Vue as an example, a feasible approach is to get the start time in the router's global guard beforeEach when switching routes, and get the component's rendering completion time in the component's mounted hook by executing the vm.$nextTick function.

router.beforeEach((to, from, next) => {
    store.commit('setPageLoadedStartTime', new Date())
})


    Enter fullscreen mode


    Exit fullscreen mode


mounted() {
    this.$nextTick(() => {
        this.$store.commit('setPageLoadedTime', new Date() - this.$store.state.pageLoadedStartTime)
    })
}


    Enter fullscreen mode


    Exit fullscreen mode


Besides performance and error monitoring, we can do even more.


  User Information Collection


  navigator
Using window.navigator, we can collect user device information, operating system, browser information, etc.


  UV (Unique Visitor)
This refers to natural persons who access and browse the webpage through the internet. A client computer accessing your website is considered one visitor. The same client is only counted once within 00:00-24:00. Multiple visits from the same visitor in one day only count as one UV.
When users visit the website, a random string + date can be generated and saved locally. When the webpage makes a request (if it exceeds 24 hours that day, it's regenerated), these parameters are passed to the backend, and the backend uses this information to generate UV statistical reports.


  PV (Page View)
This refers to page views or clicks. Each time a user visits each page on the website, 1 PV is recorded. Multiple visits to the same page by a user accumulate PV count, used to measure the number of pages visited by website users.


  Page Stay Time
Traditional Websites
When a user enters page A, the time they enter is sent along with the backend request. After 10 minutes, when the user enters page B, the backend can determine through the parameters that the user stayed on page A for 10 minutes.
SPA
We can use routers to get the user's stay time. Taking Vue as an example, we can get the time a user stays on a route component using the router.beforeEach and destroyed hook functions.


  Browsing Depth
By using the document.documentElement.scrollTop property along with screen height, we can determine whether a user has browsed through the website content completely.


  Page Referral Source
Through the document.referrer property, we can know which website the user came from.


  Summary
By analyzing user data, we can understand users' browsing habits, preferences, and more. It's quite scary to think about how little privacy remains.


  Frontend Monitoring Deployment Tutorial
All the above discusses monitoring principles, but implementation requires coding. To avoid trouble, we can use existing tools like Sentry for this task.Sentry is a performance and error monitoring tool written in Python. You can use Sentry's services (with limited free features) or deploy your own service. Let's see how to use Sentry's services for monitoring.


  Register an Account
Open https://sentry.io/signup/ to register.Select a project, I chose Vue.


  Install Sentry Dependencies
After selecting a project, specific Sentry installation instructions will be shown below.Following the prompts, execute this code in your Vue project npm install --save @sentry/browser @sentry/integrations @sentry/tracing to install Sentry's required dependencies.Then copy the code below to your main.js, placing it before new Vue().

import * as Sentry from "@sentry/browser";
import { Vue as VueIntegration } from "@sentry/integrations";
import { Integrations } from "@sentry/tracing";

Sentry.init({
  dsn: "xxxxx", // This is your dsn address, available after registration
  integrations: [
    new VueIntegration({
      Vue,
      tracing: true,
    }),
    new Integrations.BrowserTracing(),
  ],

  // We recommend adjusting this value in production, or using tracesSampler
  // for finer control
  tracesSampleRate: 1.0,
});


    Enter fullscreen mode


    Exit fullscreen mode


Then click skip this onboarding from the first step to enter the control panel.If you've forgotten your DSN, click on the left menu bar and select Settings -> Projects -> click on your project -> Client Keys(DSN).


  Create Your First Error
Execute a print statement in your Vue project: console.log(b).Now, if you open the Issues section on the Sentry homepage, you'll find an error message b is not defined:This error message includes detailed information about the error, as well as your IP, browser information, etc.Oddly, our browser console doesn't show any error output.This is because it's been blocked by Sentry, so we need to add an option logErrors: true.Then, viewing the page again, you'll find the console also has an error message:


  Upload Sourcemap
Generally, code after packaging is compressed. Without sourcemap, even with error messages, it's difficult to locate the corresponding source code.Let's see how to upload sourcemap.First, create an auth token.This generated token will be used later.Install sentry-cli and @sentry/webpack-plugin:

npm install sentry-cli-binary -g
npm install --save-dev @sentry/webpack-plugin


    Enter fullscreen mode


    Exit fullscreen mode


After installing these two plugins, create a .sentryclirc file in the project root directory (don't forget to add this file to .gitignore to avoid exposing the token), with the following content:

[auth]
token=xxx

[defaults]
url=https://sentry.io/
org=woai3c
project=woai3c


    Enter fullscreen mode


    Exit fullscreen mode


Replace xxx with the token you just generated.org is your organization name.project is your project name, which can be found following the instructions below.Create a vue.config.js file in your project and fill it with the following content:

const SentryWebpackPlugin = require('@sentry/webpack-plugin')

const config = {
    configureWebpack: {
        plugins: [
            new SentryWebpackPlugin({
                include: './dist', // Directory after packaging
                ignore: ['node_modules', 'vue.config.js', 'babel.config.js'],
            }),
        ],
    },
}

// Only upload sourcemap in production environment
module.exports = process.env.NODE_ENV == 'production'? config : {}


    Enter fullscreen mode


    Exit fullscreen mode


After filling this out, execute npm run build to see the upload results of the sourcemap.Let's compare the error messages before and after uploading sourcemap.Before uploading sourcemapAfter uploading sourcemapAs you can see, the error messages after uploading sourcemap are more accurate.


  Switch to Chinese Environment and Time Zone
Refresh after selection.


  Performance Monitoring
Open the performance option to see how each project runs. For detailed parameter explanations, please refer to the documentation Performance Monitoring.


  Performance Optimization
Performance optimization is mainly divided into two categories:
Load-time optimization
Runtime optimization
For example, compressing files and using CDN belong to load-time optimization; reducing DOM operations and using event delegation belong to runtime optimization.Before solving a problem, you must first identify it, or you won't know where to start. So before performing performance optimization, it's best to investigate your website's loading and runtime performance.


  Manual Checking


  Check Loading Performance
A website's loading performance mainly depends on white screen time and first screen time.
White screen time: The time from entering the URL to when the page begins to display content.
First screen time: The time from entering the URL to when the page is completely rendered.
Placing the following script before  allows you to get the white screen time.


    new Date() - performance.timing.navigationStart


    Enter fullscreen mode


    Exit fullscreen mode


In the window.onload event, executing new Date() - performance.timing.navigationStart will give you the first screen time.


  Check Runtime Performance
With Chrome's developer tools, we can check the website's runtime performance.Open the website, press F12 to select performance, click the gray dot in the upper left corner, and it turns red to indicate recording has started. At this point, you can simulate users using the website, and when you're done, click stop. Then you'll see the website's performance report during runtime. If there are red blocks, it means frames are being dropped; if it's green, it means the FPS is good.Additionally, under the performance tab, pressing ESC will pop up a small box. Click the three dots on the left side of the small box and check rendering.Of these two options, the first highlights repaint areas, and the other displays frame rendering information. Check these two options, and then browse the webpage to see your webpage rendering changes in real-time.


  Using Tools for Checking


  Monitoring Tools
You can deploy a frontend monitoring system to monitor website performance. Sentry, mentioned in the previous section, belongs to this category.


  Chrome Tool Lighthouse
If you have installed Chrome 52+ version, press F12 to open the developer tools.
It not only scores your website's performance but also scores SEO.Use Lighthouse to Audit Web Applications


  How to Perform Performance Optimization
There are countless articles and books about performance optimization online, but many optimization rules are outdated. So I wrote a performance optimization article 24 Frontend Performance Optimization Tips (2020), analyzing and summarizing 24 performance optimization suggestions. Highly recommended.


  Refactoring
In the book Refactoring (2nd Edition), refactoring is defined as:
Refactoring is the process of changing a software system in such a way that it does not alter the external behavior of the code yet improves its internal structure. Refactoring is a disciplined technique for restructuring an existing body of code, altering its internal structure without changing its external behavior. Its essence is improving the design of code after it has been written.
Refactoring and performance optimization have similarities and differences.The similarity is that they both modify code without changing program functionality; the difference is that refactoring aims to make code more readable and understandable, while performance optimization aims to make programs run faster.Refactoring can be done while writing code or after the program is complete, setting aside time specifically for refactoring. Neither approach is necessarily better; it depends on individual circumstances.If you specifically allocate time for refactoring, it's recommended to test immediately after refactoring a piece of code. This helps avoid modifying too much code and not being able to locate errors when they occur.


  Principles of Refactoring

Don't repeat yourself (DRY). Don't write the same code more than twice; refactor in such situations.
If a piece of code is difficult to understand, consider refactoring.
If you understand the code but it's too cumbersome or not good enough, you can refactor it.
Functions that are too long need refactoring.
A function should correspond to one functionality. If a function has multiple functionalities, it should be refactored.


  Refactoring Techniques
In Refactoring (2nd Edition), more than a hundred refactoring techniques are introduced. But I think two are particularly common:
Extract repetitive code, encapsulate into functions
Split functions that are too long or have too many functionalities


  Extract Repetitive Code, Encapsulate into Functions
Suppose there's a data query interface /getUserData?age=17&city=beijing. Now you need to convert user data: { age: 17, city: 'beijing' } into URL parameter form:

let result = ''
const keys = Object.keys(data)  // { age: 17, city: 'beijing' }
keys.forEach(key => {
    result += '&' + key + '=' + data[key]
})

result.substr(1) // age=17&city=beijing


    Enter fullscreen mode


    Exit fullscreen mode


If only one interface needs conversion, not encapsulating it into a function is fine. But if multiple interfaces have this requirement, then you should encapsulate it into a function:

function JSON2Params(data) {
    let result = ''
    const keys = Object.keys(data)
    keys.forEach(key => {
        result += '&' + key + '=' + data[key]
    })

    return result.substr(1)
}


    Enter fullscreen mode


    Exit fullscreen mode


  Split Functions That Are Too Long or Have Too Many Functionalities
Suppose there's a registration function, represented in pseudocode:

function register(data) {
    // 1. Validate user data
    /**
     * Validate account
     * Validate password
     * Validate SMS verification code
     * Validate ID card
     * Validate email
     */

    // 2. If the user uploaded an avatar, convert it to base64 code for saving
    /**
     * Create a FileReader object
     * Convert the image to base64 code
     */

    // 3. Call the registration interface
    // ...
}


    Enter fullscreen mode


    Exit fullscreen mode


This function contains three functionalities: validation, conversion, and registration. The validation and conversion functionalities can be extracted and encapsulated into separate functions:

function register(data) {
    // 1. Validate user data
    // verify()

    // 2. If the user uploaded an avatar, convert it to base64 code for saving
    // tobase64()

    // 3. Call the registration interface
    // ...
}


    Enter fullscreen mode


    Exit fullscreen mode


If you're interested in refactoring, I strongly recommend reading Refactoring (2nd Edition).References:
Refactoring (2nd Edition)


  Summary
I wrote this article mainly to summarize my more than one year of work experience, as I've been primarily researching frontend engineering and how to improve team development efficiency. I hope this article can help beginners with no experience in frontend engineering enter the field through this article.If this article has been helpful to you, please give it a like. Much appreciated.