Ever found yourself staring at a Socket.io connection issue at 2 AM, wondering where your life went wrong? Been there, done that! 😩
Socket.io might be the superhero of real-time web apps, but its debugging experience can feel like trying to find a needle in a haystack... while blindfolded... in the dark!
But what if I told you there's a better way? Let's dive into how Apidog is changing the game for Socket.io debugging!
The Socket.io Debugging Nightmare
We've all been there:
// Desperately adding console logs everywhere
io.on('connection', (socket) => {
console.log('CONNECTED:', socket.id);
socket.on('message', (data) => {
console.log('MESSAGE RECEIVED:', data);
// Is this even working? Who knows! 🤷♂️
});
});The classic approach involves:
- Console.log hell 📝
- Separate windows for client and server logs
- Mental gymnastics trying to piece together what's happening
- Endless refreshing hoping something changes
It's enough to make you question your career choices!
Enter Apidog: The Socket.io Debugger
Apidog's Socket.io debugging tool is like having X-ray vision into your real-time connections. Here's why it's a total game-changer:
1. Visual Connection Management
No more guessing if your connection is working! Apidog shows you:
- Real-time connection status with visual indicators
- Complete handshake process with every parameter exposed
- Transport negotiation details (WebSocket or polling)
- Authentication flow visualization
2. Interactive Event Testing
Testing events is ridiculously simple:
- Enter your event name
- Craft your payload (with syntax highlighting!)
- Hit send and watch the magic happen
// No more code like this just to test an event
function testChatMessage() {
  socket.emit('chat message', {
    user: 'TestUser',
    message: 'Is this thing on?'
  }, (response) => {
    console.log('Got response:', response);
  });
}
3. Timeline That Makes Sense
The unified timeline view is chef's kiss 👨🍳:
- Chronological event sequence with perfect clarity
- Color-coded events (incoming vs outgoing)
- Expandable payloads with proper formatting
- Timestamp precision to debug race conditions
Real-World Socket.io Debugging with Apidog
Let's see how Apidog transforms debugging in practice:
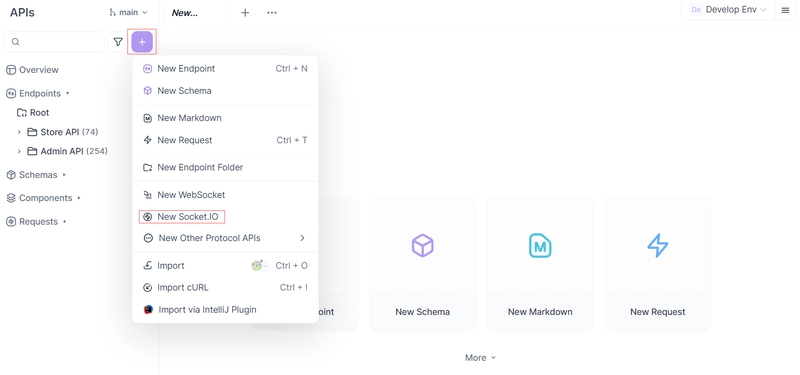
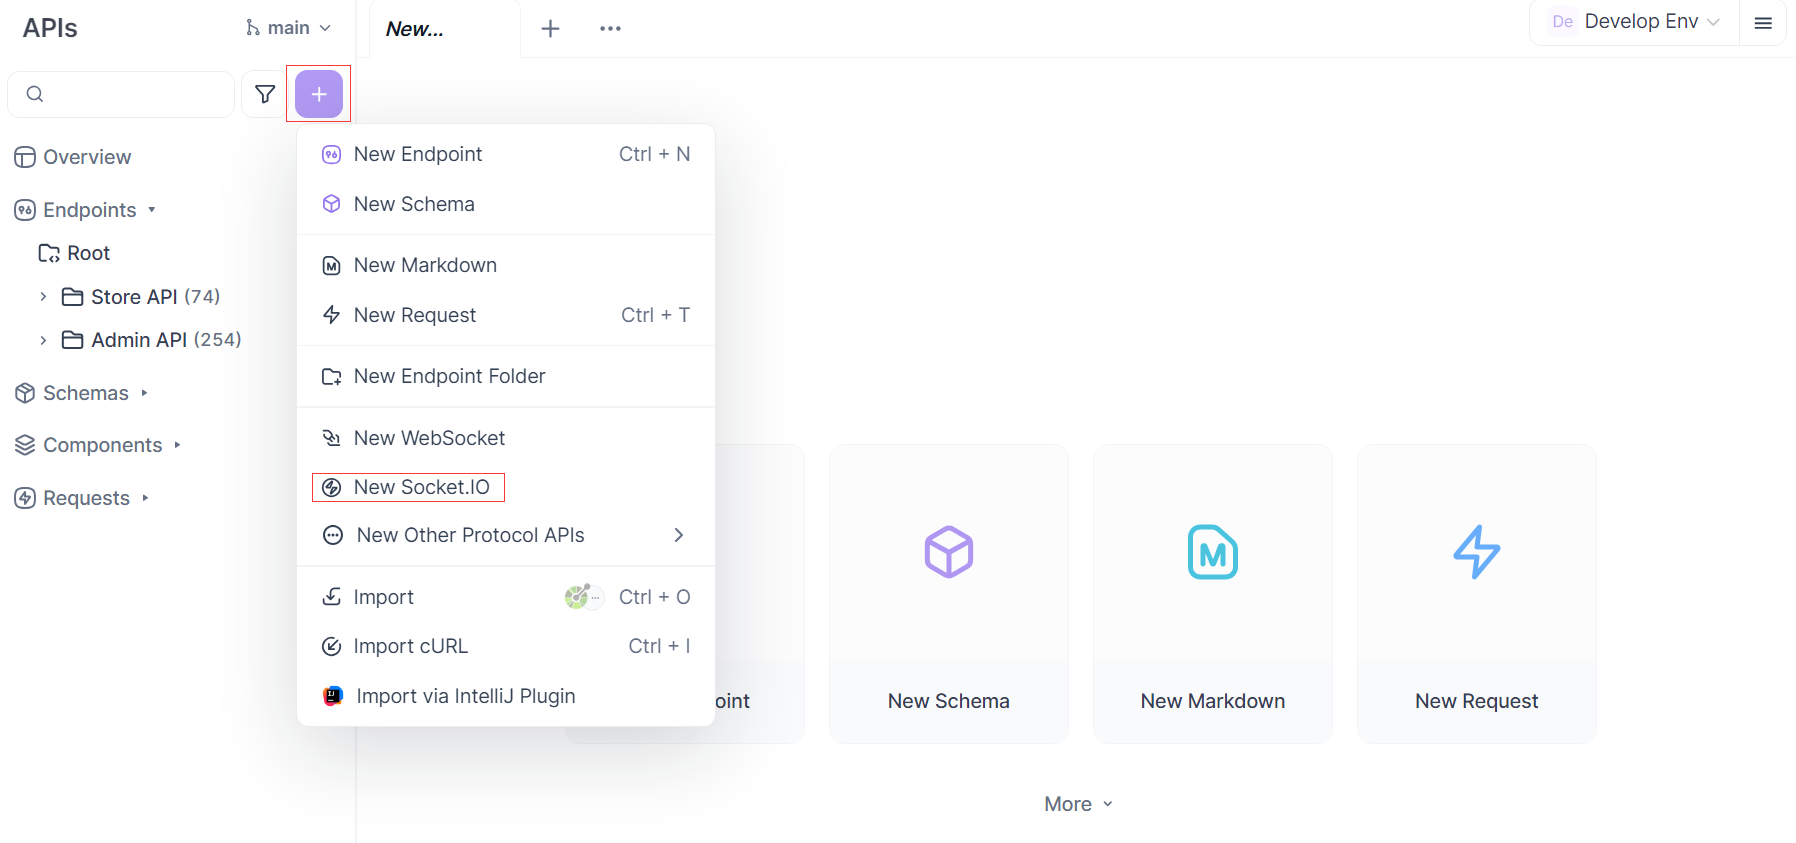
Step 1: Create Your Socket.io Endpoint
- Launch Apidog and click the
+button - Select "New Socket.IO" endpoint
- Enter your server URL (e.g.,
ws://localhost:3000) - Add any auth tokens or cookies needed
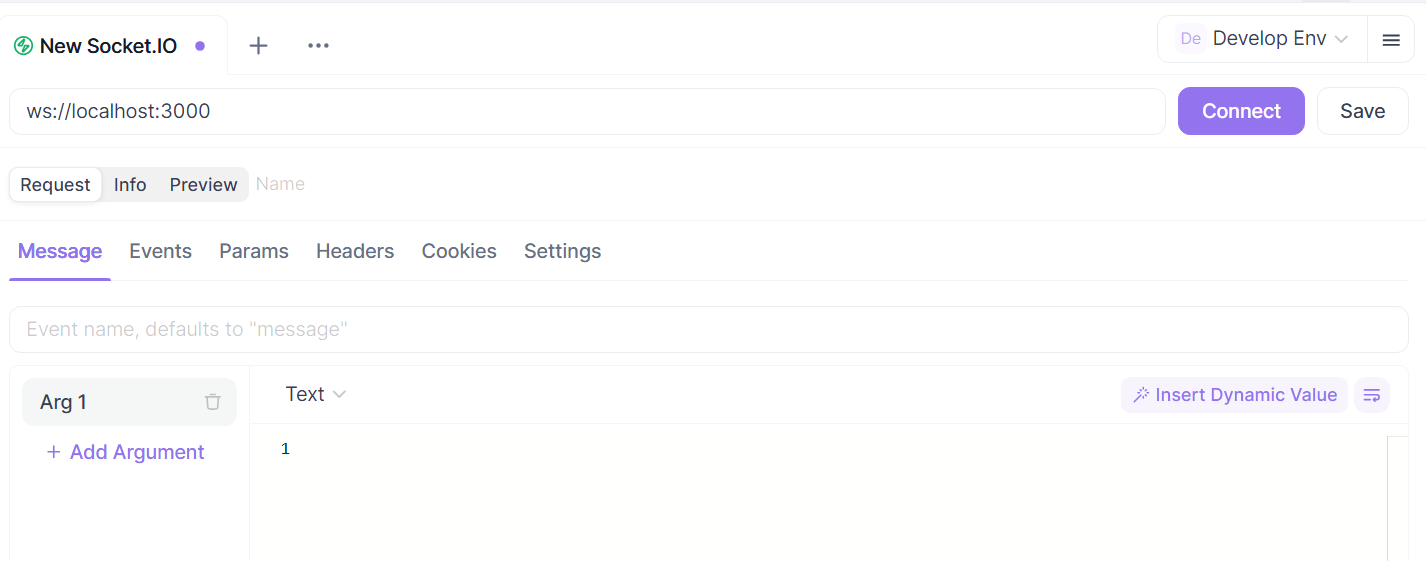
Step 2: Connect and Observe
- Hit "Connect" and watch the handshake unfold
- See exactly which transport is being used
- Identify any connection issues immediately
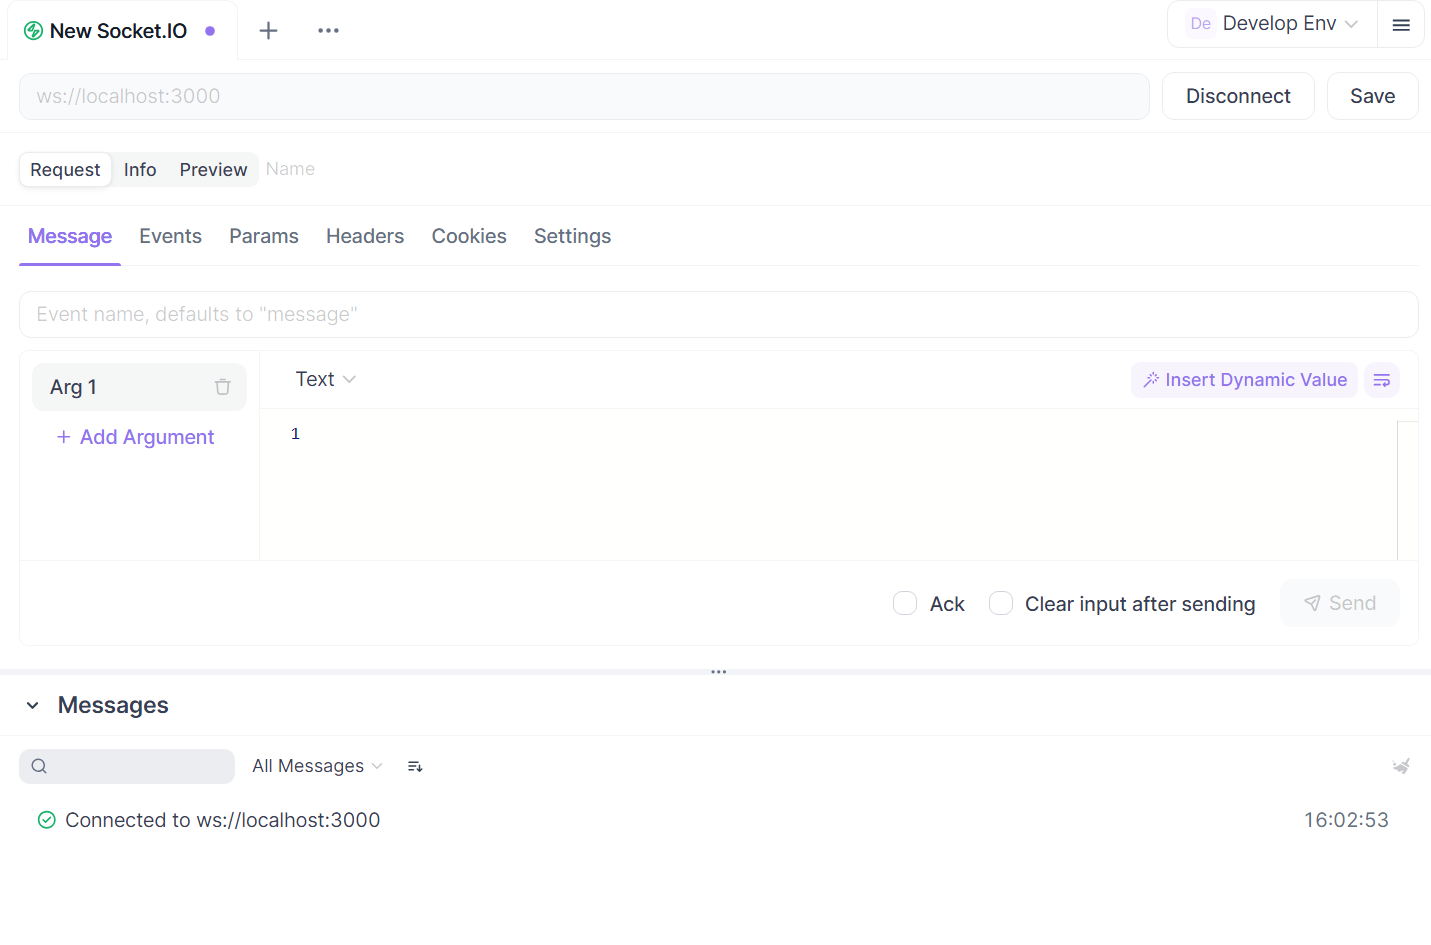
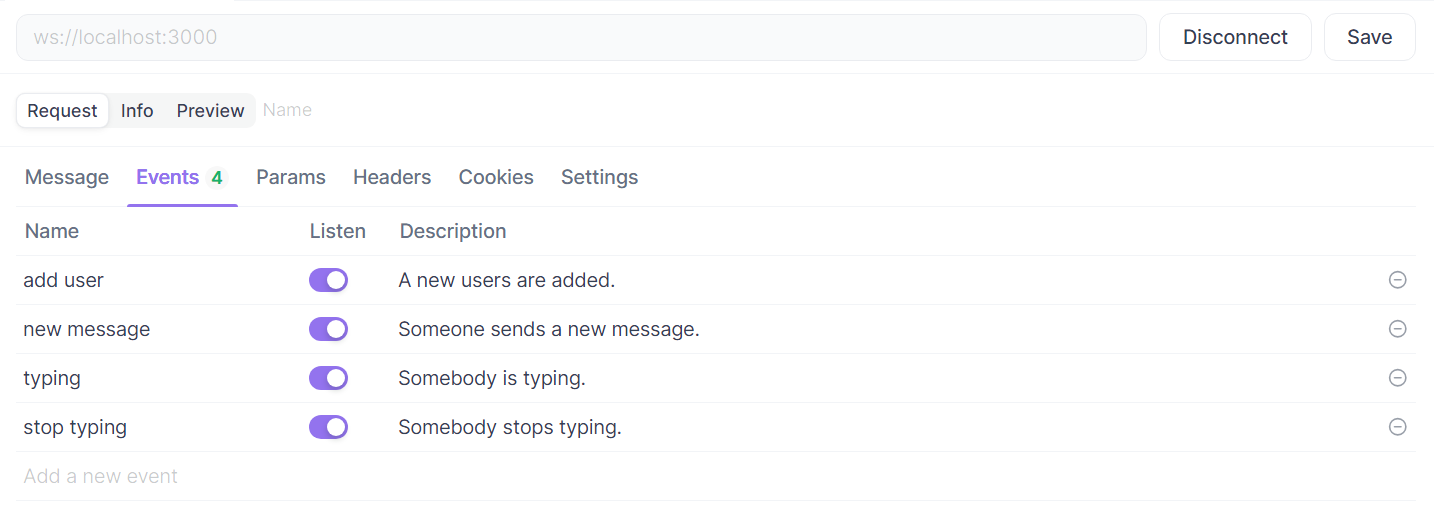
Step 3: Listen to Events
- Go to the "Events" tab
- Add events you want to monitor (e.g., "chat message", "user joined")
- Watch as events appear in real-time with full payload details
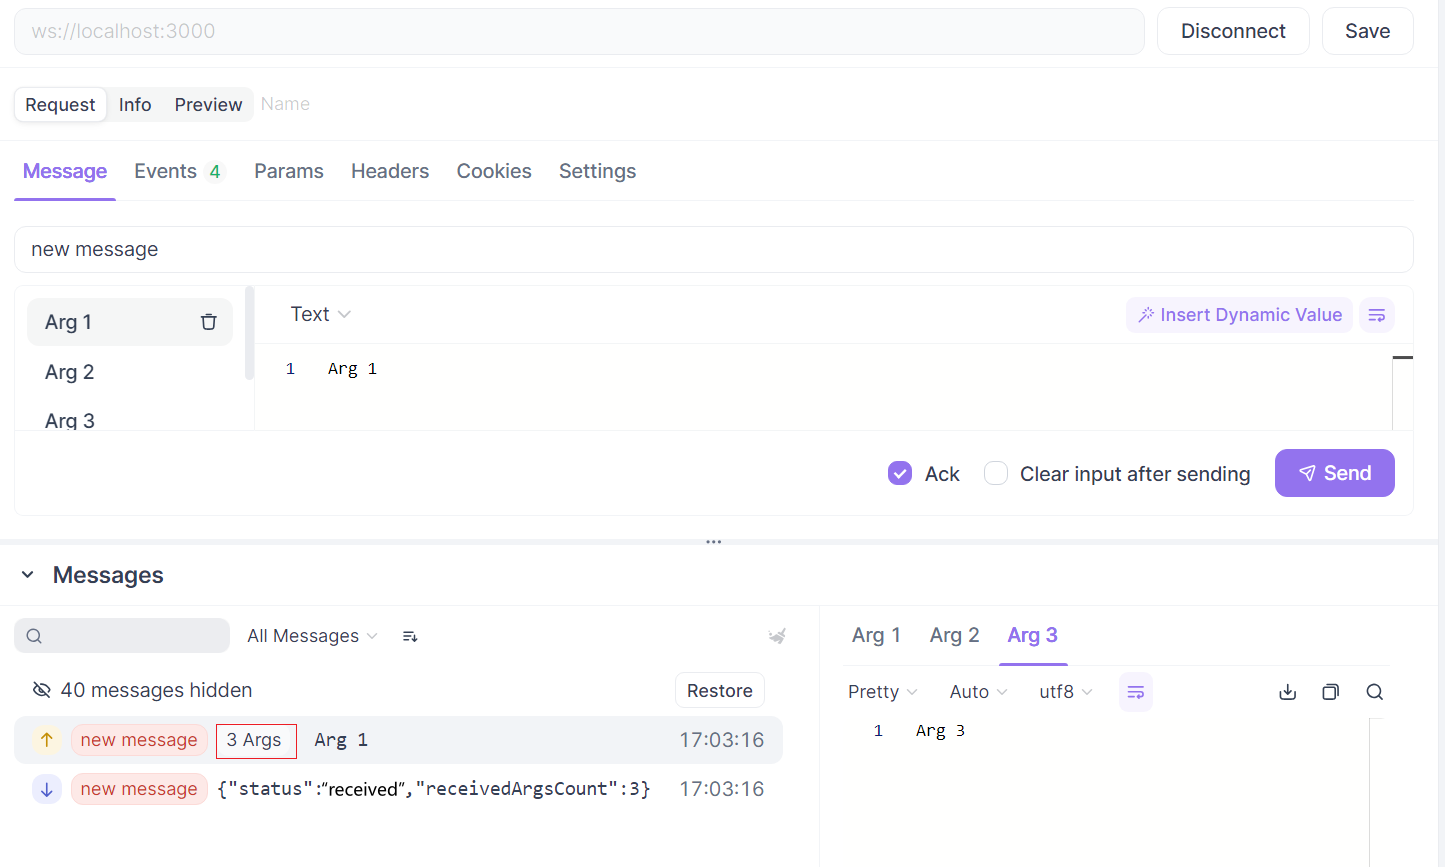
Step 4: Send Test Events
- Enter your event name
- Craft your JSON payload
- Enable "Ack" if you expect a response
- Send and instantly see the results
Why Developers Are Switching to Apidog
The benefits are massive:
- Save hours of debugging time (what used to take days now takes minutes)
- No code changes needed for testing different scenarios
- Share configurations with your team for consistent testing
- Document Socket.io endpoints alongside your REST APIs
As one developer put it: "I used to dread Socket.io debugging days. With Apidog, I actually look forward to them!"
Conclusion: Your Socket.io Debugging Superpower
Socket.io has revolutionized real-time web apps, but its debugging shouldn't feel like solving a Rubik's cube underwater. Apidog gives you the visibility, control, and simplicity that makes Socket.io debugging actually enjoyable (yes, I said enjoyable!).
Whether you're building the next big chat app, a collaborative editor, or a live dashboard, Apidog's Socket.io debugging tool will be your new best friend.
P.S. Ready to transform your Socket.io debugging experience? Download Apidog today and kiss those debugging nightmares goodbye!