As of 2025, companies are integrating large language models (LLMs) into their applications, ranging from customer service to software development. As we rely more on these models, we must ensure they perform reliably, transparently, and ethically. It requires ongoing supervision of their behavior in real-world situations. This is where LLM observability, the practice of monitoring, understanding, and optimizing LLMs, comes in.
This article explores the best open-source LLM observability tools available in 2025. Further, we will discuss their features and use cases, and help you choose the right one for your needs.
What is LLM Observability?
LLM observability refers to the comprehensive practice of monitoring, analyzing, and understanding the behavior of LLMs within applications. Observability focuses on how LLMs process prompts, generate responses, and perform under varying conditions in production.
LLMs are non-deterministic models that produce varied outputs for similar inputs, and their behavior can be sensitive to subtle changes. Due to this probabilistic and "black box" nature of LLMs, their responses are unpredictable and must be strictly monitored to ensure consistent and reliable results.
Effective LLM observability depends on connected components that help us understand how the system works. These work together by combining insights from tracing, evaluation, prompts, and experimentation to fix issues, improve performance, and ensure the outputs are ethical:
- Tracing
- Evaluation
- Prompts
- Experimentation
Tracing
Tracing involves tracking the end-to-end journey of a user request as it flows through the various components of an LLM application. This includes user input, prompt generation, calls to the LLM, interactions with vector databases or external tools (in RAG or agentic systems), and the generation of final responses.
Each distinct operation in this journey is often represented as a "span." A span is a measurable unit of work within the trace, capturing a single action, such as sending a prompt to the LLM or executing a database query in a RAG system. It includes details such as start time, duration, and metadata, including input tokens, model parameters, or error codes, providing a granular view of the operation’s performance and context.
For example, in a chatbot, one span might represent the LLM generating a response, while another captures the retrieval of context from a vector database. Tracing helps in debugging complex LLM chains or agentic workflows. It identifies latency bottlenecks and assists in understanding the sequence of events that lead to a particular output or error.
Evaluation
Evaluation is the process of assessing the quality and performance of the LLM's outputs against defined criteria. Metrics used for evaluation can include accuracy, relevance, coherence, factuality (absence of hallucinations), safety (toxicity and bias), adherence to format, and task completion.
Assessing LLM responses is challenging as the outputs are non-deterministic, and their quality cannot be easily quantified. However, [metrics like BLEU or ROUGE], using another LLM as a judge, along with human feedback, help us determine the quality of the output and the overall state of the LLM. Full guide on LLM evaluation here.
Prompts
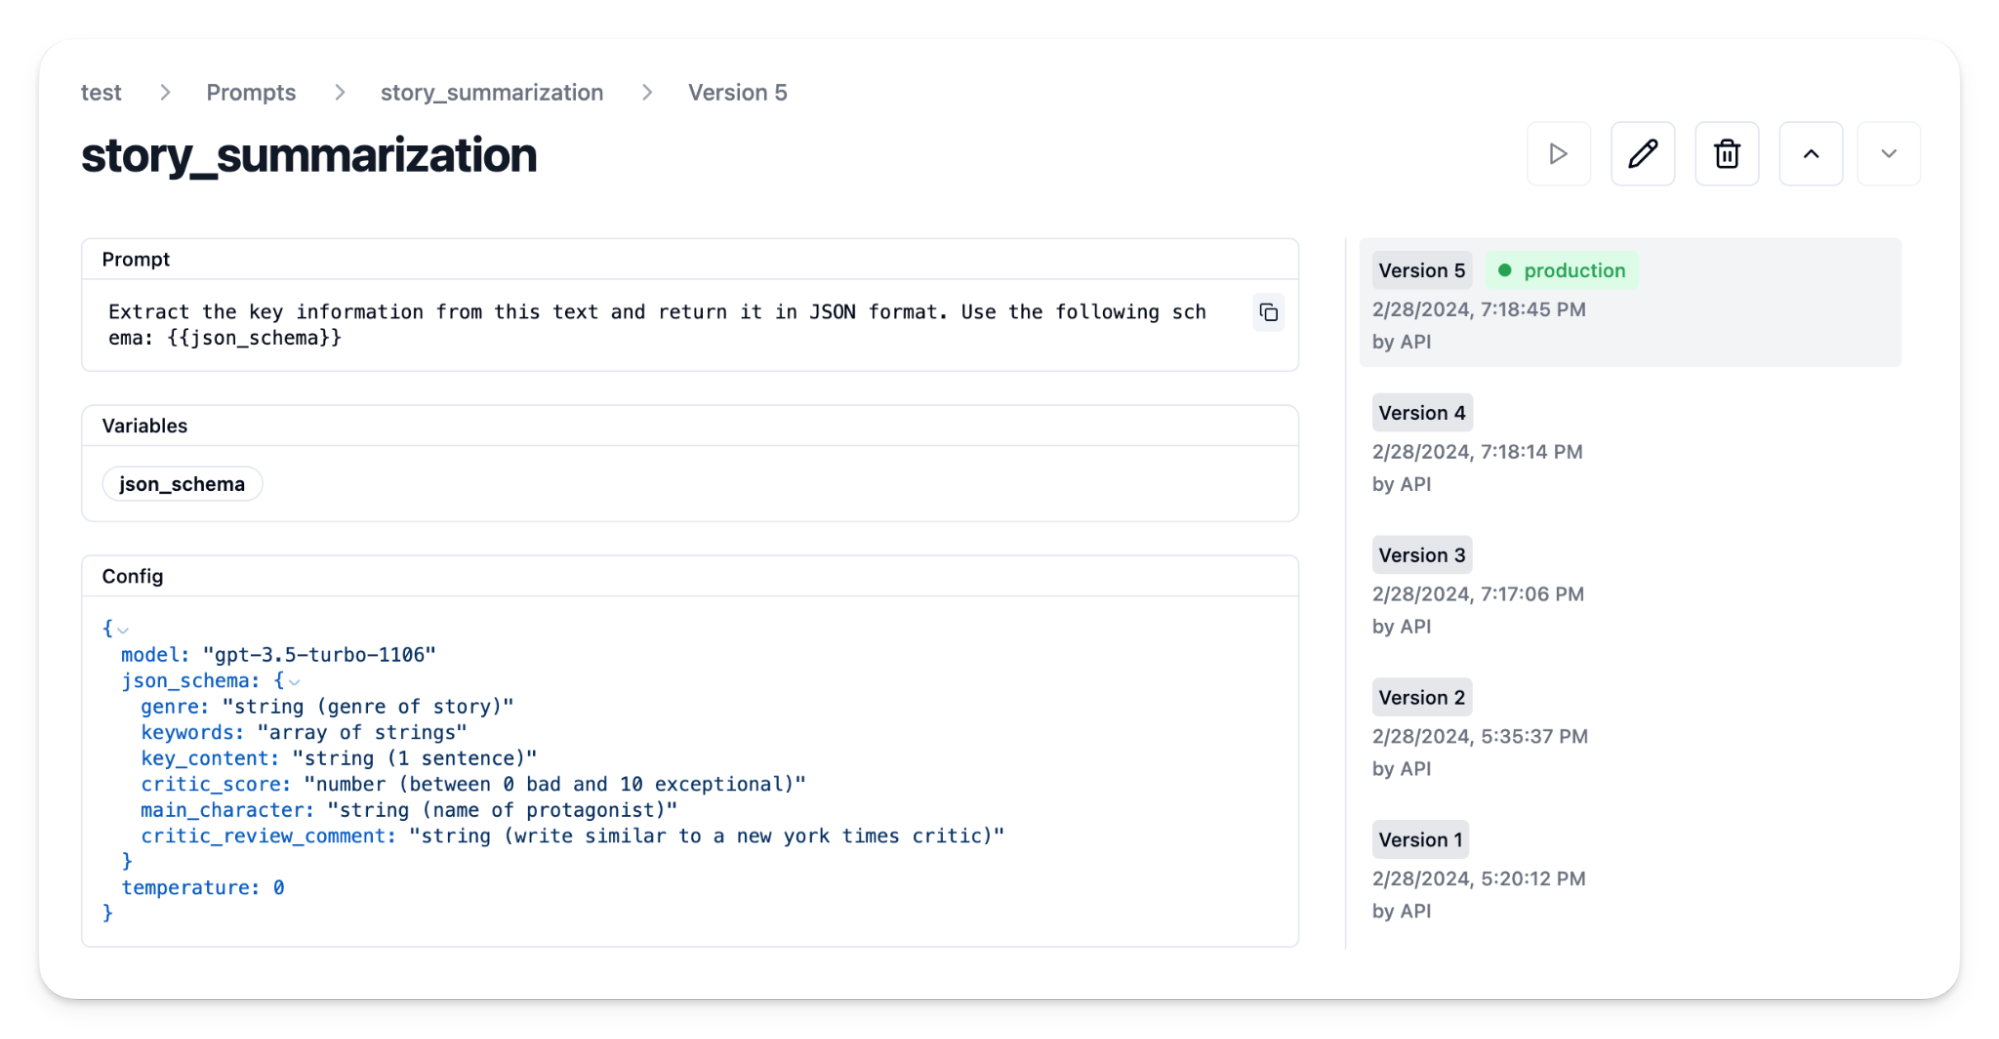
Prompts allow users to communicate their thoughts and goals to the language model. The structure and design of these prompts significantly impact the behavior of large language models, and they must be managed and analyzed separately.
Prompt observability includes prompt engineering (crafting effective prompts), versioning prompts, A/B testing different prompt templates, and analyzing how prompt variations affect output quality, latency, and cost. Tools often include "prompt playgrounds" for interactive experimentation with prompts.
Experimentation
Experimentation refers to the systematic testing of different models, prompts, RAG strategies, fine-tuning approaches, or other system parameters. Observability data, particularly traces and evaluation results, are crucial for comparing these experiments, understanding trade-offs, and guiding iterative improvements to the LLM application.
Challenges in LLM Observability
Observing and monitoring large language models presents unique challenges distinct from those of traditional software systems. These challenges are due to the LLMs' probabilistic nature, their complex architectures, and the dynamic environments in which they operate. Addressing these challenges can help us in developing effective observability strategies.
- Complexity of LLMs' Outputs: Due to their black-box nature, LLMs produce outputs that are difficult to predict and interpret. Since they are non-deterministic, the same input can produce different responses on different occasions. Traditional observability tools, which depend on deterministic outputs, may struggle to understand the variability of LLM responses and complicate establishing consistent monitoring baselines.
- Demand Real-time Analysis: Many LLM applications, such as conversational agents, require instant feedback on their performance to maintain a good user experience. Obtaining real-time analysis of LLM performance, such as latency or error rates, is challenging, particularly in high-traffic environments where rapid processing and response times are critical.
- Privacy concerns: When dealing with sensitive user data, such as personal conversations or proprietary information. Ensuring privacy and regulatory compliance, such as GDPR, is important but difficult, as observability practices must balance detailed monitoring with data protection to avoid breaches or misuse.
- Scalability with big data: LLMs generate and process enormous datasets in live environments, including prompts, responses, and metadata. Managing these large volumes of data while maintaining speed and reliability is a great challenge, particularly as usage scales up in production settings.
- Bias and fairness: Detecting and correcting biases in LLM outputs is a crucial ethical requirement. Identifying biases, such as skewed responses based on gender or culture, requires advanced evaluation techniques that can be complex to implement and resource-intensive. However, these techniques are necessary for ensuring trustworthy and fair LLMs.
Criteria for Selecting Observability Tools
Choosing the right observability tool is crucial to ensure the performance and safety of LLM-powered applications. LLMs have unique requirements, such as real-time monitoring of dynamic outputs and detecting subtle issues like hallucinations or biases.
The following criteria will help you select an open-source tool that meets your LLM needs:
- Specific use case: Identifying what aspects of the LLM application you need to monitor. Are you focusing on tracking costs and latency, debugging complex agentic workflows through tracing, evaluating the quality and relevance of responses at scale, and monitoring for safety issues? Or are you concentrating on understanding prompt effectiveness and detecting shifts in user interaction patterns over time? Your priorities will help narrow down tools with the most relevant core capabilities.
- Integration capabilities: Ensure the tool integrates seamlessly with your current tech stack. This includes LLM providers (such as OpenAI and Anthropic), orchestration frameworks (like LangChain and LlamaIndex), vector databases, and cloud services. Compatibility reduces setup time and promotes efficient workflows. A well-integrated tool reduces setup friction and accelerates adoption.
- ** Scalability:** The tool must be capable of handling the volume and velocity of data your LLM applications generate as they grow.
- Ease of use: A user-friendly interface minimizes onboarding time, ensuring your team can quickly utilize the tool’s potential. Look for intuitive dashboards, clear documentation, and a straightforward setup process.
- Community and support: An active and supportive community is invaluable for open-source tools. It signifies ongoing development, offers resources for troubleshooting, and serves as a source of shared knowledge and contributions.
Evaluating tools using these criteria helps you choose an open-source solution that fits the unique challenges of LLMs and integrates smoothly into your workflow.
Top Open-Source LLM Observability Tools
As organizations adopt language models in production applications, they also need robust tools to monitor and evaluate their behavior. Open-source solutions provide developers with flexible and transparent ways to monitor, debug, and optimize LLM applications.
Here are the top open-source LLM observability tools, highlighting their key features and use cases to assist your selection for LLM needs.
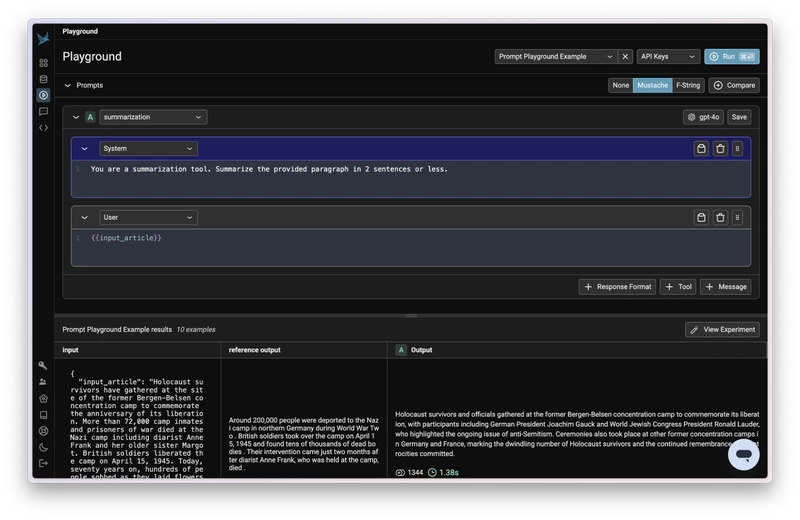
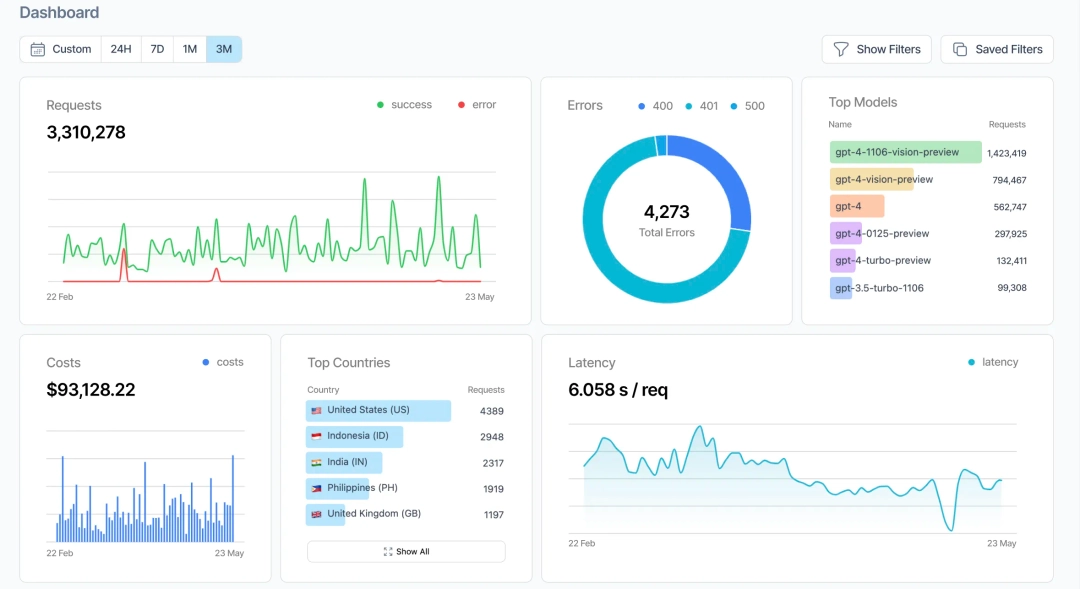
1. Arize Phoenix
Phoenix is backed by Arize AI, the leading and best-funded open-source LLM observability platform. Unlike many alternatives, Phoenix is designed from the ground up for open source developers working with complex LLM pipelines like agents and RAG. It is designed to experiment with, evaluate, and troubleshoot LLM applications. It provides a user interface for visualizing LLM traces and runs during development and experimentation.
The main standout features of Phoenix are its Prompt Playground and LLM evaluations. It's also built for simple self-hosting, specifically, it’s one of the only open-source platforms that doesn’t require a separate database to be configured during setup. With no external dependencies like Redis or ClickHouse, Phoenix offers the simplest path to full-stack LLM observability. Already adopted by top AI engineering teams across startups and enterprises, Phoenix brings clarity and control to complex LLM workflows. Finally, it provides its own OpenTelemetry-compatible instrumentation layer, OpenInference, also maintained by the Arize team.
Key Features of Arize Phoenix:
- Automatic tracing visualization for all major frameworks
- Comprehensive LLM evaluation workflows and pre-tested templates
- Experimentation capabilities for comparing runs
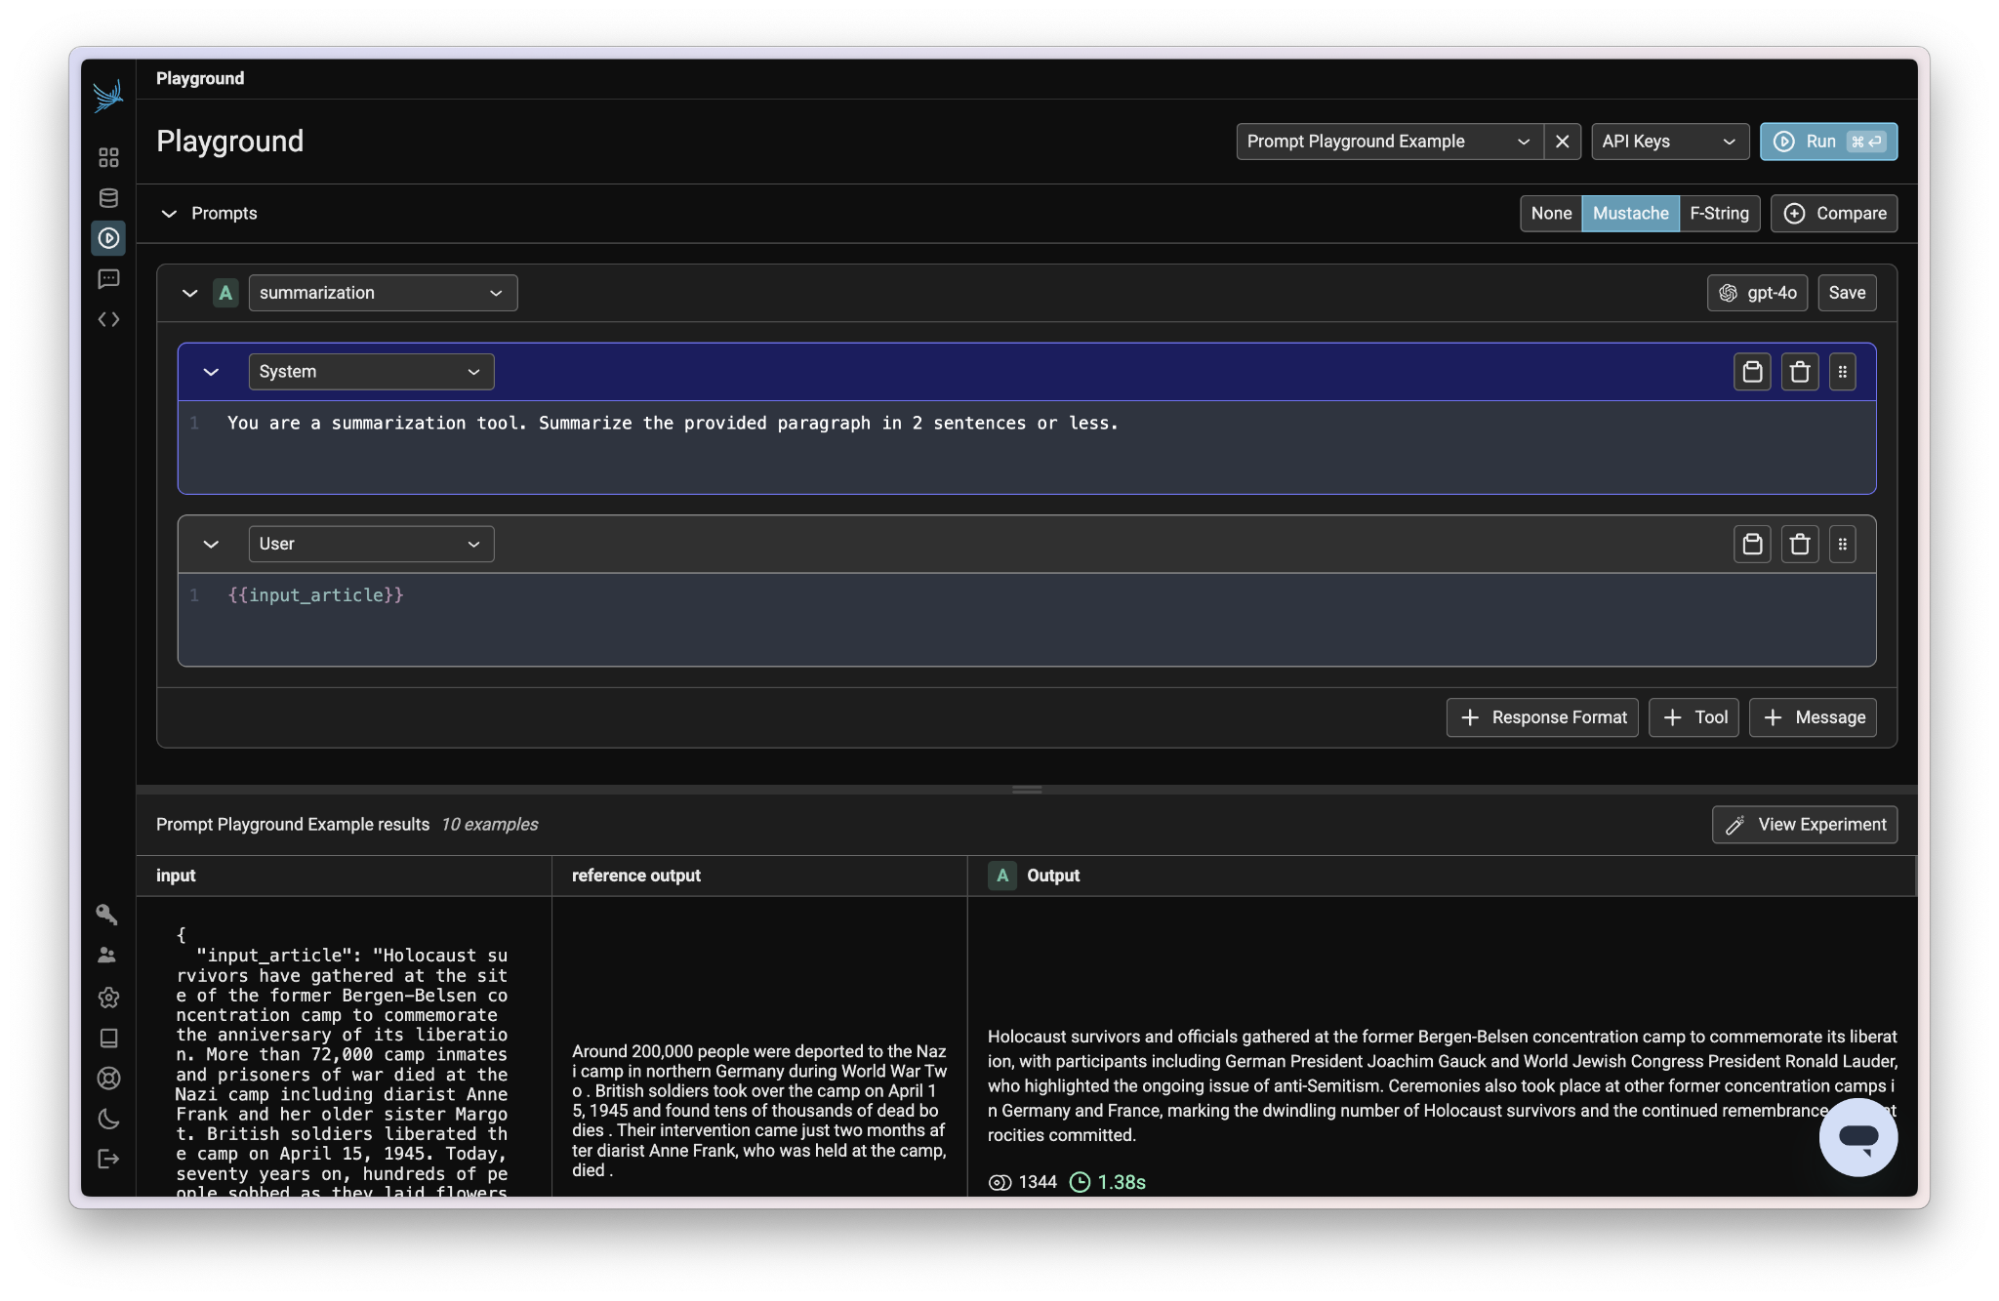
- Fully featured Prompt Playground and Prompt management system
- Easy self-hosting setup
Arize Phoenix Use Cases
Phoenix suits teams that need to experiment during the development phase and evaluate application performance, especially for Agents.
It helps troubleshoot issues by visualizing traces, managing and optimizing prompts, and comparing the impact of different models or prompt versions through evaluations.
It also helps identify the root causes of unexpected user inputs or problematic LLM responses by analyzing text, image, and audio data.
Arize Phoenix Integrations
Phoenix natively integrates with frameworks such as LlamaIndex, LangChain, Haystack, DSPy, smolagents, and LLM providers like OpenAI, Bedrock, MistralAI, VertexAI, and LiteLLM. It also integrates with platforms like LangFlow, LiteLLM Proxy, and BeeAI.
2. Langfuse
Langfuse is another open-source platform for debugging, analyzing, and iterating on language model applications. It offers tracing, evaluation, and prompt management. While Langfuse offers many capabilities, some (like the Prompt Playground and automated evaluation) are only available in the paid tier for self-hosted users.
Self-hosting requires configuring multiple external services, such as managing external dependencies like ClickHouse, Redis, and S3 storage, which can increase operational overhead. Instrumentation generally relies on integrating outside libraries, though it supports OpenTelemetry standards.
Key Features:
- Detailed tracing for LLM calls and chains.
- Support for automated and manual evaluations.
- Comprehensive prompt management and versioning.
- Cost and latency monitoring.
- Integration for collecting user feedback.
Use Cases
Langfuse's collaborative platform assists in debugging, analyzing, and iterating on LLM applications throughout the development lifecycle. It can also be used to monitor performance, traces, and metrics and evaluate application quality through a combination of automated and human-driven methods.
Langfuse's API-first design enables it to power bespoke LLMOps workflows. It's also designed for deployment in high-security environments. It supports tracing applications built with various frameworks or custom code.
Integrations
Langfuse provides SDKs for Python and JS/TS. It offers integrations for OpenAI SDK, Langchain, LlamaIndex, Haystack, LiteLLM, Flowise, Dify, OpenWebUI, Promptfoo, LobeChat, Vapi, Inferable, Gradio, Goose, smolagents, and CrewAI. It supports OpenTelemetry. It integrates with local models via Ollama and features an API for custom integrations.
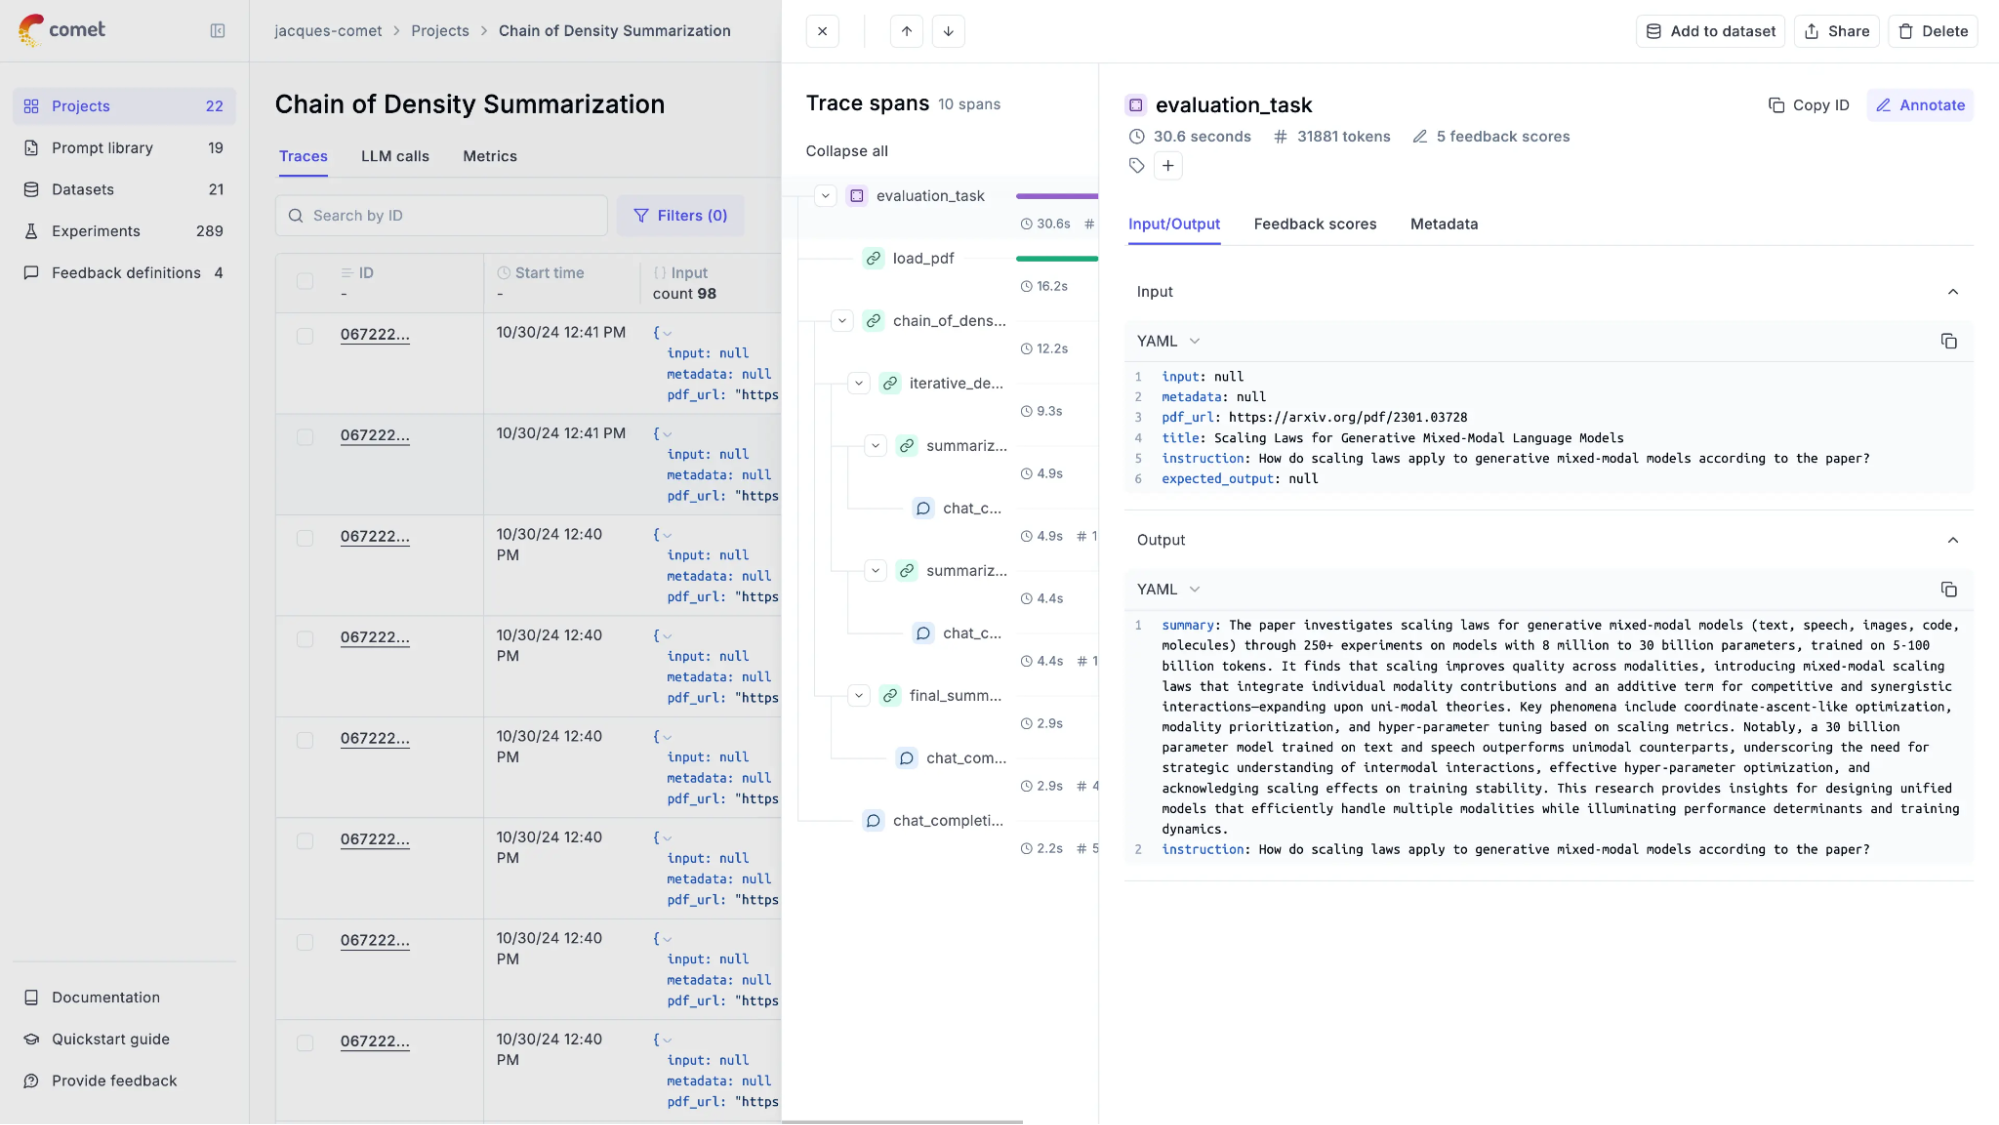
3. Opik
Opik is an open-source project by Comet focused on evaluating, testing, and monitoring LLM applications, including RAG systems and agentic workflows. It supports developers throughout the entire LLM application development lifecycle.
Opik can be run locally. You can self-host using a local installer or choose a Kubernetes deployment option designed for production environments. As a newer tool, Opik is still building out its community and ecosystem.
Key Features:
- End-to-end tracing tailored for LLM applications.
- Automated and manual evaluation support.
- Pre-configured LLM-as-a-Judge metrics.
- Production monitoring dashboards.
- Experiment tracking for comparative analysis.
Use Cases
Opik can be used to debug and optimize LLM applications, RAG systems, and agents. It supports evaluating application performance using a range of metrics and LLM judges, and integrates testing into CI/CD pipelines.
Additionally, it monitors production applications for issues and performance drifts and generates datasets from production data for further development iterations. Opik helps understand cause-and-effect relationships within complex large language models.
Integrations
Opik offers a Python SDK with the @track decorator and a TypeScript SDK. It integrates with OpenTelemetry, LlamaIndex, and Pytest and benefits from integration with the broader Comet ML platform.
4. Helicone
Helicone describes itself as an open-source LLM observability platform for developers and an all-in-one platform for monitoring, debugging, and improving production-ready LLM applications. It functions as a lightweight gateway or proxy, offering a clean interface to gain visibility into LLM API calls, making for easy integration. Helicone is best suited for API-level visibility rather than full-stack observability, which may limit insight in more complex agentic applications.
Key Features:
- Request and response logging for LLM interactions.
- Latency and cost tracking.
- Token usage monitoring.
- Prompt experimentation interface.
- Built-in caching layer and rate limiting.
Use Cases
Helicone is suited for tracking costs, latency, quality, and errors for LLM in production. It assists in troubleshooting agent interactions and identifying the root causes of errors. Teams can experiment with and manage prompts, use gateway features like caching, rate limiting, and security enhancements, and analyze user behavior and cost distribution.
Integrations
Helicone offers SDKs and integrations for various platforms, such as JavaScript/TypeScript, Python, LangChain, and LiteLLM. It supports multiple LLM providers, such as OpenAI, Azure OpenAI, and Anthropic, and integrates with evaluation platforms and fine-tuning partners like OpenPipe and Autonomi.
5. Traceloop
Traceloop is also an open-source project that provides end-to-end tracing for LLM applications. It uses OpenTelemetry standards to offer visibility into the request flow through code, especially in agent-based and multi-step workflows. Traceloop focuses exclusively on tracing and requires an existing OpenTelemetry setup to unlock its full potential.
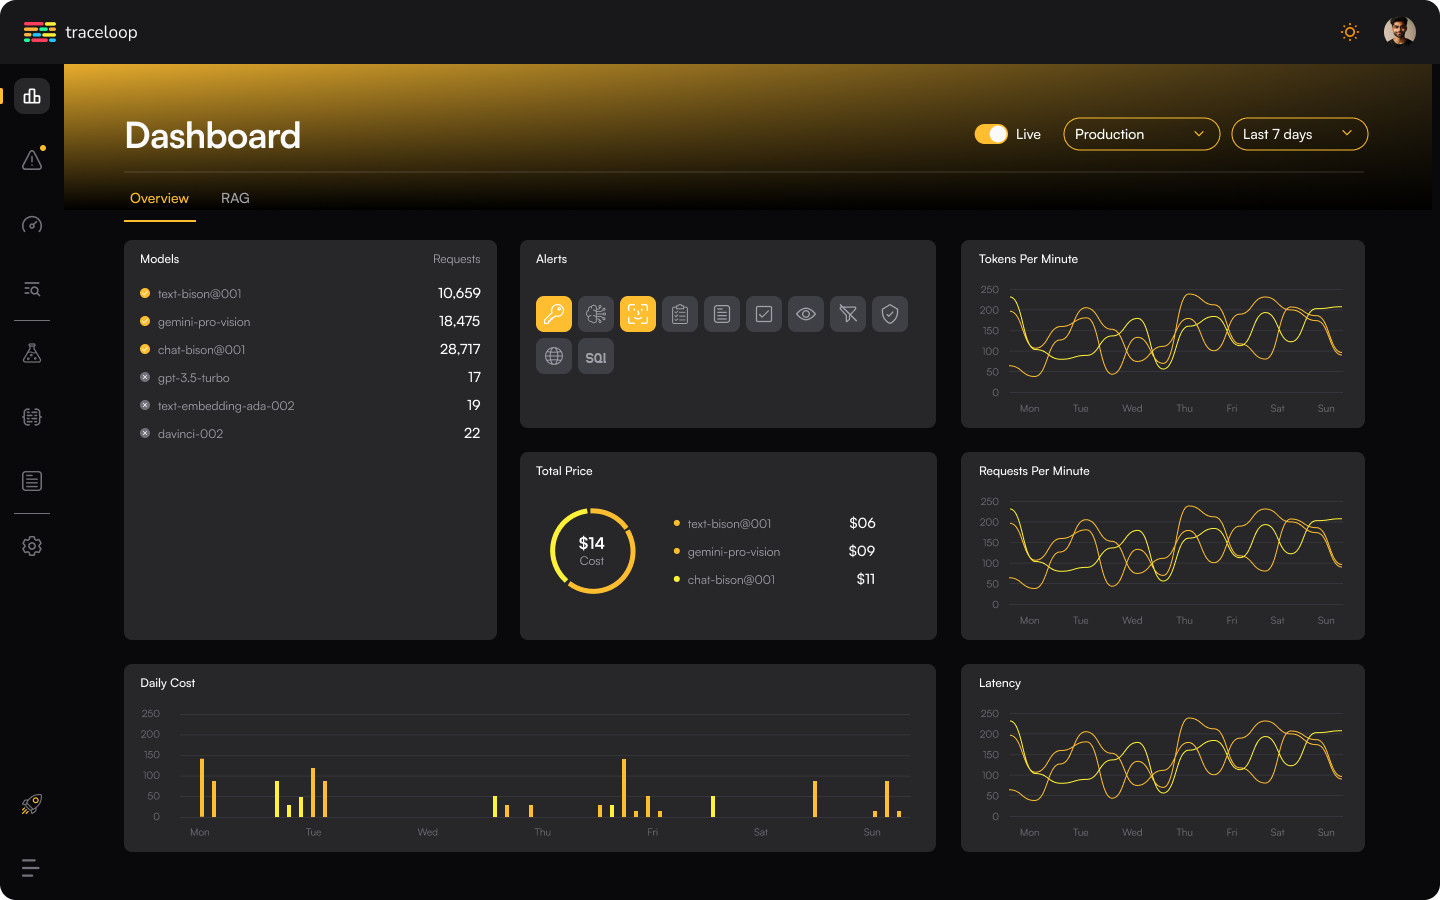
Key Features:
- Automated tracing for LLM frameworks and providers.
- OpenTelemetry compatibility for seamless integration.
- Visualization of LLM call sequences and dependencies.
- Logging of inputs and outputs within traces.
Use Cases
Traceloop is ideal for teams that want to add detailed LLM observability to applications already instrumented with OpenTelemetry or planning to adopt OTel. It monitors performance metrics, costs (via token counts), and the behavior of interactions with LLMs, vector databases, and frameworks. A primary use case is integrating LLM observability data seamlessly into existing APM and observability tools.
Integrations
Traceloop easily integrates with LLM providers, Vector DBs, and LLM Frameworks such as LangChain, LlamaIndex, Haystack, LiteLLM, and CrewAI. Its core strength is compatibility with numerous observability backends via the OpenTelemetry protocol (OTLP).
OpenLIT
OpenLIT is an OpenTelemetry-native observability tool built for AI Engineering and LLM applications. It focuses on easy, vendor-neutral instrumentation for LLMs, vector databases, and other AI stack components. OpenLIT is ideal for teams already heavily invested in OpenTelemetry and GPU monitoring but offers fewer features for LLM prompt evaluation and experimentation.
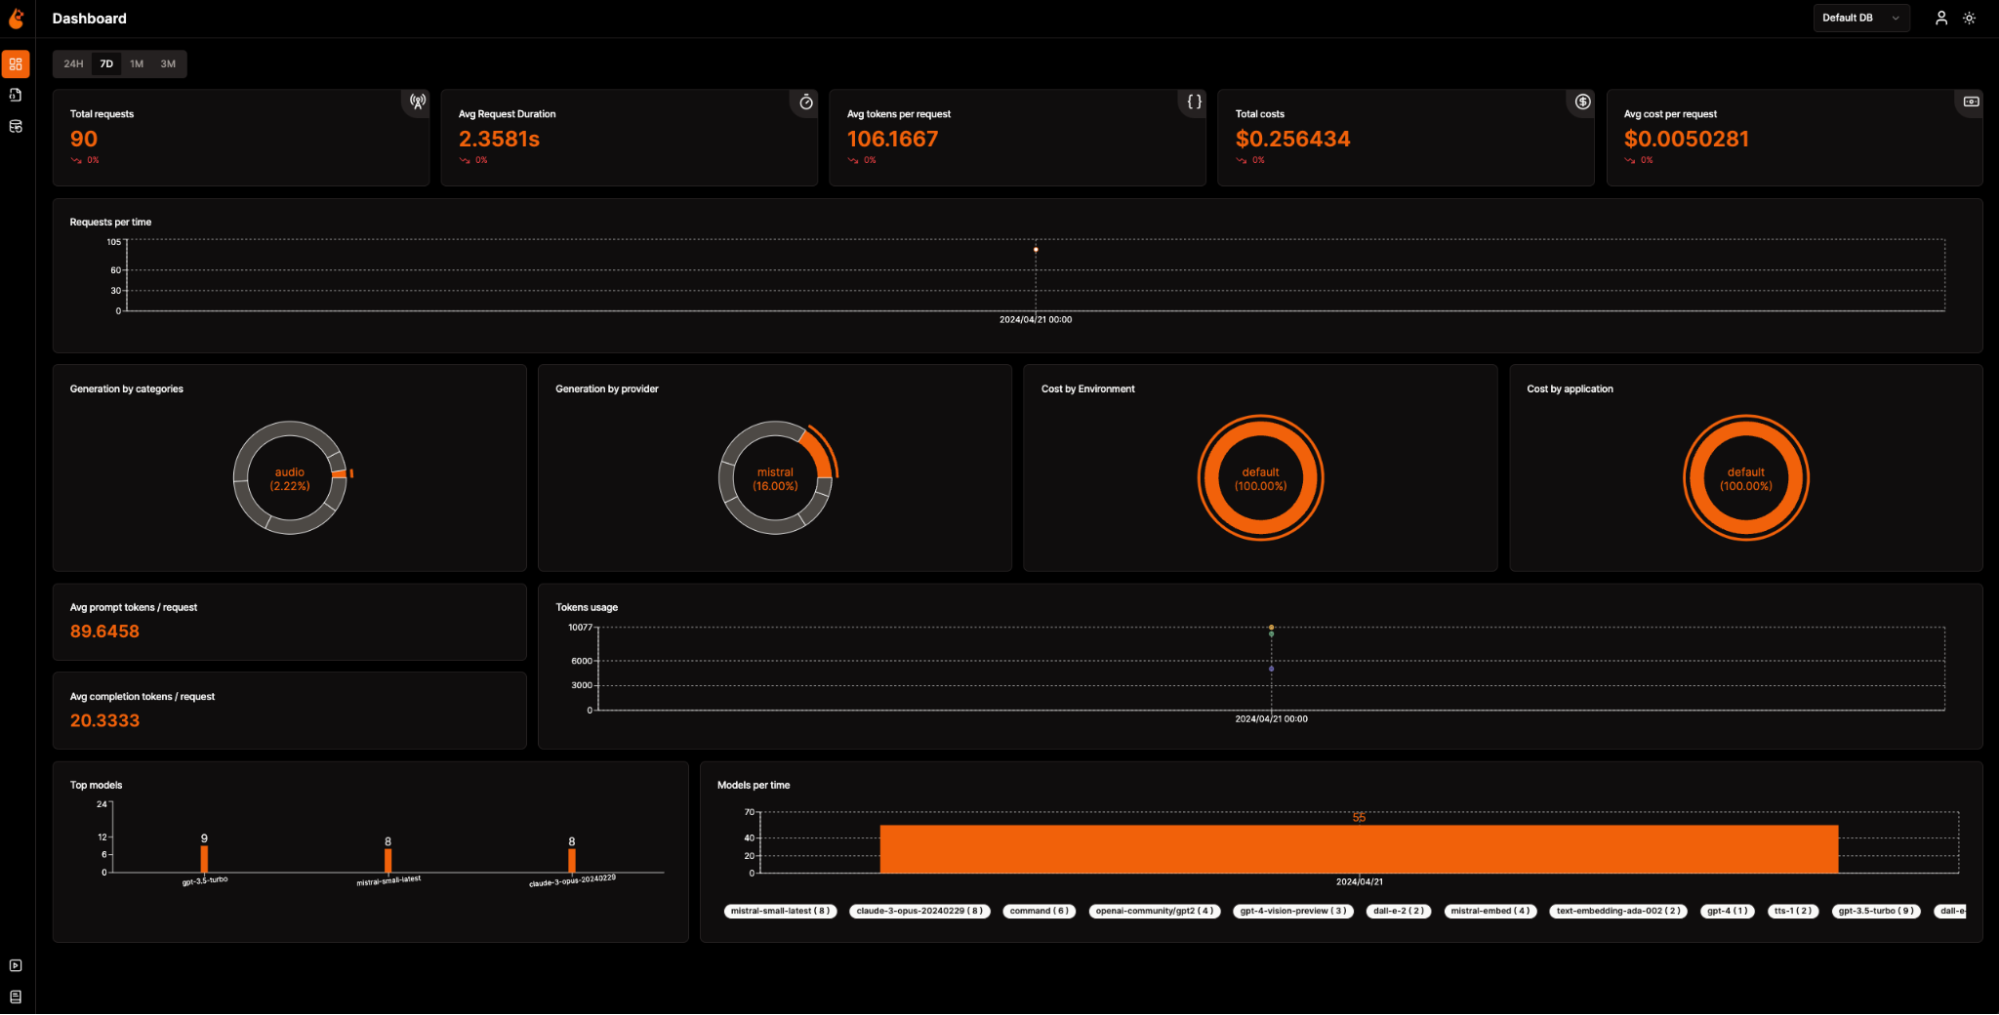
Key Features:
- Tracing and metrics collection out-of-the-box.
- Automated cost tracking for LLM usage.
- Support for integrating guardrails.
- GPU monitoring capabilities.
Use Cases
A primary use case for OpenLIT is integrating LLM and GPU observability into existing OpenTelemetry-based monitoring infrastructures such as Grafana, Jaeger, Prometheus, or commercial backends. Its GPU monitoring capabilities help teams run models locally, fine-tune them, and manage GPU resources effectively.
Integrations
OpenLIT provides SDKs primarily in Python and integrates with LLM providers, vector databases like Chroma, agent frameworks, and GPUs. Its core integration method involves sending standard OTLP data to any compatible backend, including the OpenTelemetry Collector, Grafana Cloud, New Relic, and Datadog.
Conclusion
LLMs continue to drive innovation across industries, while observability remains crucial for reliable and ethical performance. The open-source tools discussed here, such as Arize Phoenix, provide tailored solutions to the unique challenges of LLMs, including tracing complex workflows and evaluating outputs.
Developers can use these tools to fix critical issues like biases, performance problems, hallucinations and privacy concerns, helping build trust in their LLM applications.