1. Introduction to Network Monitoring Approaches
Network monitoring is a set of management actions to watch/continuously overview and optionally save the network traffic for further investigation. This action aims to detect and reduce network problems, improve performance, and in some cases, increase overall productivity. It is a main part of the daily IT/SOC operations and differs from Network Security Monitoring (NSM) in its purpose.
Network Monitoring
Network monitoring is highly focused on IT assets like uptime (availability), device health and connection quality (performance), and network traffic balance and management (configuration). Monitoring and visualising the network traffic, troubleshooting, and root cause analysis are also part of the Network Monitoring process*.* This model is helpful for network administrators and usually doesn't cover identifying non-asset in-depth vulnerabilities and significant security concerns like internal threats and zero-day vulnerabilities. Usually, Network Monitoring is not within the SOC scope. It is linked to the enterprise IT/Network management team.
Network Security Monitoring
Network Security Monitoring is focused on network anomalies like rogue hosts, encrypted traffic, suspicious service and port usage, and malicious/suspicious traffic patterns in an intrusion/anomaly detection and response approach. Monitoring and visualising the network traffic and investigating suspicious events is a core part of Network Security Monitoring. This model is helpful for security analysts/incident responders, security engineers and threat hunters and covers identifying threats, vulnerabilities and security issues with a set of rules, signatures and patterns. Network Security Monitoring is part of the SOC, and the actions are separated between tier 1-2-3 analyst levels.
What is ZEEK?
Zeek (formerly Bro) is an open-source and commercial passive Network Monitoring tool (traffic analysis framework) developed by Lawrence Berkeley Labs. Today, Zeek is supported by several developers, and Corelight provides an Enterprise-ready fork of Zeek. Therefore this tool is called both open source and commercial. The differences between the open-source version and the commercial version are detailed here.
Zeek differs from known monitoring and IDS/IPS tools by providing a wide range of detailed logs ready to investigate both for forensics and data analysis actions. Currently,** **Zeek provides 50+ logs in 7 categories.
Zeek vs Snort
While both are called IDS/NIDS, it is good to know the cons and pros of each tool and use them in a specific manner. While there are some overlapping functionalities, they have different purposes for usage.
| Tool | Zeek | Snort |
|---|---|---|
| Capabilities | NSM and IDS framework. It is heavily focused on network analysis. It is more focused on specific threats to trigger alerts. The detection mechanism is focused on events. | An IDS/IPS system. It is heavily focused on signatures to detect vulnerabilities. The detection mechanism is focused on signature patterns and packets. |
| Cons | Hard to use. The analysis is done out of Zeek, manually or by automation. Hard to detect complex threats. |
|
| Pros | It provides in-depth traffic visibility. Useful for threat hunting. Ability to detect complex threats. It has a scripting language and supports event correlation. Easy to read logs. |
Easy to write rules. Cisco supported rules. Community support. |
| Common Use Case | Network monitoring. In-depth traffic investigation. Intrusion detecting in chained events. |
Intrusion detection and prevention. Stop known attacks/threats. |
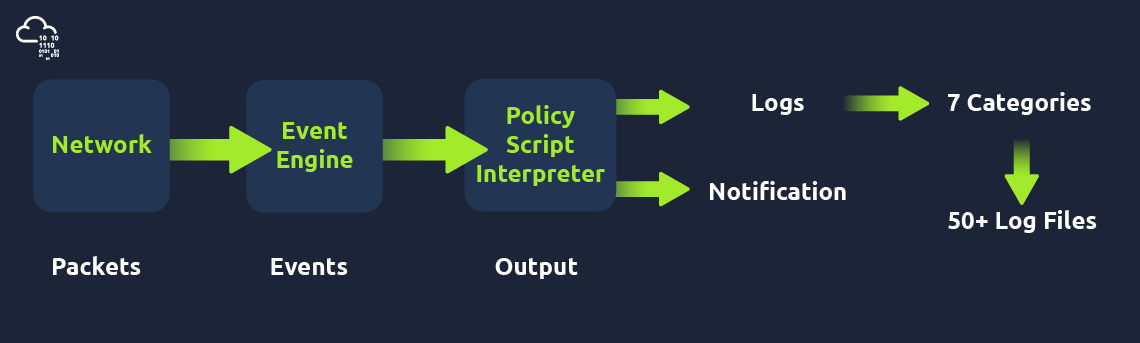
Zeek Architecture
Zeek has two primary layers; "Event Engine" and "Policy Script Interpreter". The Event Engine layer is where the packets are processed; it is called the event core and is responsible for describing the event without focusing on event details. It is where the packages are divided into parts such as source and destination addresses, protocol identification, session analysis and file extraction. The Policy Script Interpreter layer is where the semantic analysis is conducted. It is responsible for describing the event correlations by using Zeek scripts.
Zeek Frameworks
Zeek has several frameworks to provide extended functionality in the scripting layer. These frameworks enhance Zeek's flexibility and compatibility with other network components. Each framework focuses on the specific use case and easily runs with Zeek installation. For instance, we will be using the "Logging Framework" for all cases. Having ide on each framework's functionality can help users quickly identify an event of interest.
Available Frameworks
| Category | Frameworks |
|---|---|
| Logging | Notice, Input, Configuration, Intelligence |
| Cluster | Broker Communication, Supervisor, GeoLocation, File Analysis |
| Signature | Summary, NetControl, Packet Analysis, TLS Decryption |
You can read more on frameworks here.
Zeek Outputs
As mentioned before, Zeek provides 50+ log files under seven different categories, which are helpful in various areas such as traffic monitoring, intrusion detection, threat hunting and web analytics. This section is not intended to discuss the logs in-depth. The logs are covered in TASK 3.
Once you run Zeek, it will automatically start investigating the traffic or the given pcap file and generate logs automatically. Once you process a pcap with Zeek, it will create the logs in the working directory.** **If you run the Zeek as a service, your logs will be located in the default log path. The default log path is: /opt/zeek/logs/
Working with Zeek
There are two operation options for Zeek. The first one is running it as a service, and the second option is running the Zeek against a pcap. Before starting working with Zeek, let's check the version of the Zeek instance with the following command: zeek -v
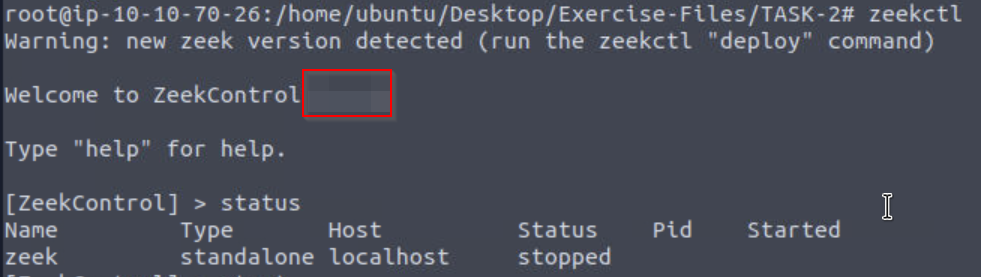
Now we are sure that we have Zeek installed. Let's start the Zeek as a service! To do this, we need to use the "ZeekControl" module, as shown below. The "ZeekControl" module requires superuser permissions to use.** **You can elevate the session privileges and switch to the superuser account to examine the generated log files with the following command: sudo su
Here we can manage the Zeek service and view the status of the service. Primary management of the Zeek service is done with three commands; "status", "start", and "stop".
root@ubuntu$ zeekctl
Welcome to ZeekControl 2.X.0
[ZeekControl] > status
Name         Type       Host          Status    Pid    Started
zeek         standalone localhost     stopped
[ZeekControl] > start
starting zeek ...
[ZeekControl] > status
Name         Type       Host          Status    Pid    Started
zeek         standalone localhost     running   2541   13 Mar 18:25:08
[ZeekControl] > stop
stopping zeek ...
[ZeekControl] > status
Name         Type       Host          Status    Pid    Started
zeek         standalone localhost     stopped
You can also use the "ZeekControl" mode with the following commands as well;
zeekctl statuszeekctl startzeekctl stop
The only way to listen to the live network traffic is using Zeek as a service. Apart from using the Zeek as a network monitoring tool, we can also use it as a packet investigator.** **To do so, we need to process the pcap files with Zeek, as shown below. Once you process a pcap file, Zeek automatically creates log files according to the traffic.
In pcap processing mode, logs are saved in the working directory. You can view the generated logs using the ls -l command.
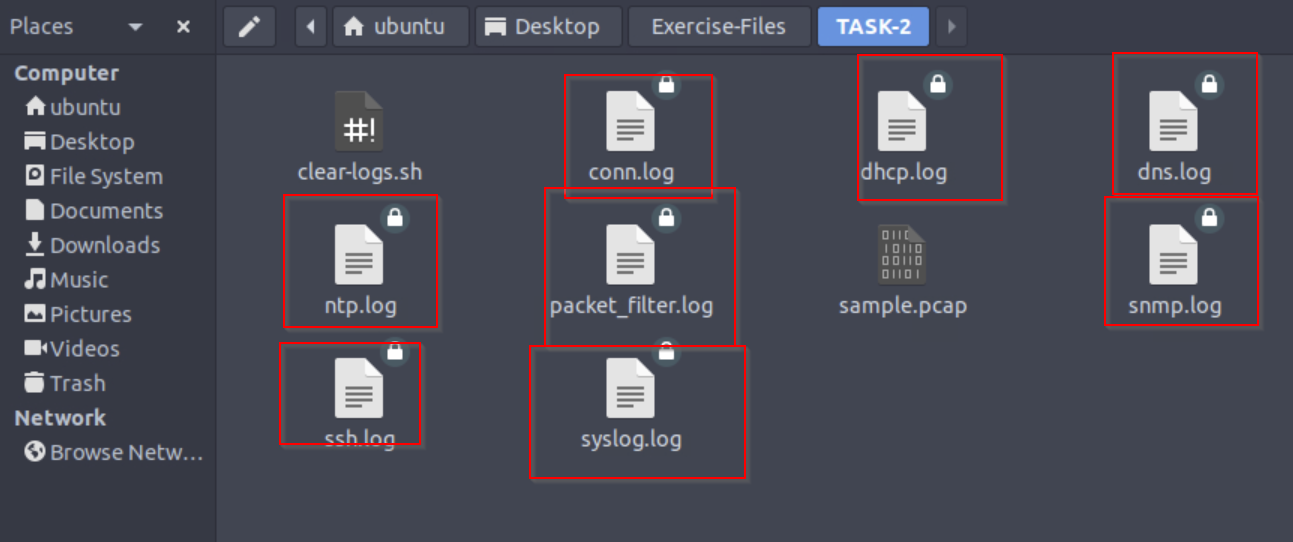
root@ubuntu$ zeek -C -r sample.pcap

root@ubuntu$ ls -l
-rw-r--r-- 1 ubuntu ubuntu  11366 Mar 13 20:45 conn.log
-rw-r--r-- 1 ubuntu ubuntu    763 Mar 13 20:45 dhcp.log
-rw-r--r-- 1 ubuntu ubuntu   2918 Mar 13 20:45 dns.log
-rw-r--r-- 1 ubuntu ubuntu    254 Mar 13 20:45 packet_filter.log
Zeek Command Line Parameters
Below are the main Zeek command line parameters and their descriptions:
| Parameter | Description |
|---|---|
-r |
Reading option, read/process a pcap file. |
-C |
Ignoring checksum errors. |
-v |
Version information. |
zeekctl |
ZeekControl module. |
Flag 1
What is the installed Zeek instance version number?
Run zeek -v

Flag 2
What is the version of the ZeekControl module?
Run zeekctl
Flag 3
Investigate the "sample.pcap" file. What is the number of generated alert files?
Run zeek -C -r sample.pcap

We can then navigate to the task folder to see how many log files has been generated, in my case we got 8.
2. Zeek Logs
Zeek generates log files according to the traffic data. You will have logs for every connection in the wire, including the application level protocols and fields. Zeek is capable of identifying 50+ logs and categorising them into seven categories. Zeek logs are well structured and tab-separated ASCII files, so reading and processing them is easy but requires effort. You should be familiar with networking and protocols to correlate the logs in an investigation, know where to focus, and find a specific piece of evidence.
Each log output consists of multiple fields, and each field holds a different part of the traffic data. Correlation is done through a unique value called "UID". The "UID" represents the unique identifier assigned to each session.
Zeek logs in a nutshell;
| Category | Description | Log Files |
|---|---|---|
| Network | Network protocol logs. |
conn.log, dce_rpc.log, dhcp.log, dnp3.log, dns.log, ftp.log, http.log, irc.log, kerberos.log, modbus.log, modbus_register_change.log, mysql.log, ntlm.log, ntp.log, radius.log, rdp.log, rfb.log, sip.log, smb_cmd.log, smb_files.log, smb_mapping.log, smtp.log, snmp.log, socks.log, ssh.log, ssl.log, syslog.log, tunnel.log
|
| Files | File analysis result logs. |
files.log, ocsp.log, pe.log, x509.log
|
| NetControl | Network control and flow logs. |
netcontrol.log, netcontrol_drop.log, netcontrol_shunt.log, netcontrol_catch_release.log, openflow.log
|
| Detection | Detection and possible indicator logs. |
intel.log, notice.log, notice_alarm.log, signatures.log, traceroute.log
|
| Network Observations | Network flow logs. |
known_certs.log, known_hosts.log, known_modbus.log, known_services.log, software.log
|
| Miscellaneous | Additional logs covering external alerts, inputs, and failures. |
barnyard2.log, dpd.log, unified2.log, unknown_protocols.log, weird.log, weird_stats.log
|
| Zeek Diagnostic | Zeek diagnostic logs covering system messages, actions, and some statistics. |
broker.log, capture_loss.log, cluster.log, config.log, loaded_scripts.log, packet_filter.log, print.log, prof.log, reporter.log, stats.log, stderr.log, stdout.log
|
Please refer to Zeek's official documentation and Corelight log cheat sheet for more information. Although there are multiple log files, some log files are updated daily, and some are updated in each session. Some of the most commonly used logs are explained in the given table.
| Update Frequency | Log Name | Description |
|---|---|---|
| Daily | known_hosts.log |
List of hosts that completed TCP handshakes. |
| Daily | known_services.log |
List of services used by hosts. |
| Daily | known_certs.log |
List of SSL certificates. |
| Daily | software.log |
List of software used on the network. |
| Per Session | notice.log |
Anomalies detected by Zeek. |
| Per Session | intel.log |
Traffic contains malicious patterns/indicators. |
| Per Session | signatures.log |
List of triggered signatures. |
This is too much protocol and log information! Yes, it is true; a difficulty of working with Zeek is having the required network knowledge and investigation mindset. Don't worry; you can have both of these and even more knowledge by working through TryHackMe paths. Just keep the streak!
Brief log usage primer table;
| Overall Info | Protocol-Based | Detection | Observation |
|---|---|---|---|
conn.log |
http.log |
notice.log |
known_host.log |
files.log |
dns.log |
signatures.log |
known_services.log |
intel.log |
ftp.log |
pe.log |
software.log |
loaded_scripts.log |
ssh.log |
traceroute.log |
weird.log |
You can categorise the logs before starting an investigation. Thus, finding the evidence/anomaly you are looking for will be easier. The given table is a brief example of using multiple log files. You can create your working model or customise the given one. Make sure you read each log description and understand the purpose to know what to expect from the corresponding log file. Note that these are not the only ones to focus on. Investigated logs are highly associated with the investigation case type and hypothesis, so do not just rely only on the logs given in the example table!
The table shows us how to use multiple logs to identify anomalies and run an investigation by correlating across the available logs.
- **Overall Info: **The aim is to review the overall connections, shared files, loaded scripts and indicators at once. This is the first step of the investigation.
- **Protocol Based: **Once you review the overall traffic and find suspicious indicators or want to conduct a more in-depth investigation, you focus on a specific protocol.
- **Detection: **Use the prebuild or custom scripts and signature outcomes to support your findings by having additional indicators or linked actions.
- **Observation: **The summary of the hosts, services, software, and unexpected activity statistics will help you discover possible missing points and conclude the investigation.
Remember, we mention the pros and cons of the Zeek logs at the beginning of this task. Now let's demonstrate the log viewing and identify the differences between them.
Recall 1: Zeek logs are well structured and tab-separated ASCII files, so reading and processing them is easy but requires effort.
Recall 2: Investigating the generated logs will require command-line tools (cat, cut, grep sort, and uniq) and additional tools (zeek-cut).
Opening a Zeek log with a text editor and built-in commands;
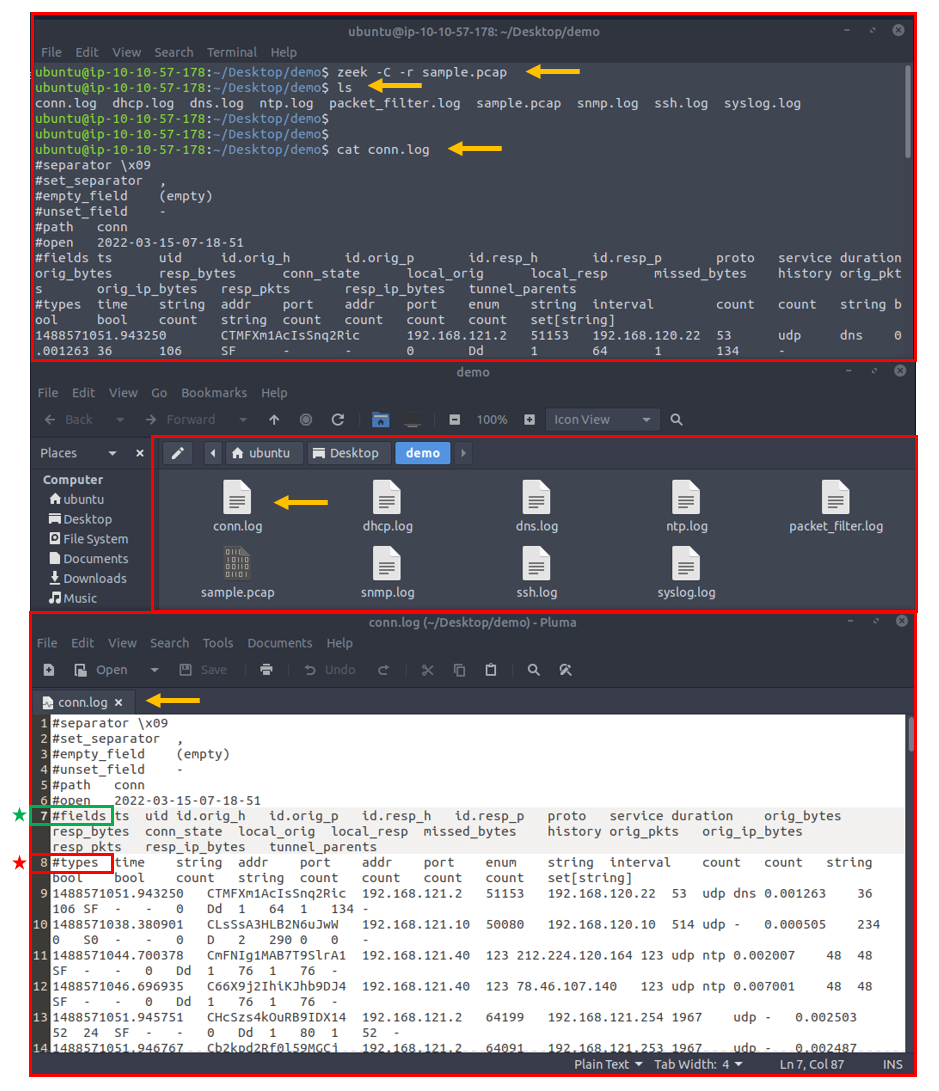
The above image shows that reading the logs with tools is not enough to spot an anomaly quickly. Logs provide a vast amount of data to investigate and correlate. You will need to have technical knowledge and event correlation ability to carry out an investigation. It is possible to use external visualisation and correlation tools such as ELK and Splunk. We will focus on using and processing the logs with a hands-on approach in this room.
In addition to Linux command-line tools, one auxiliary program called zeek-cut** **reduces the effort of extracting specific columns from log files. Each log file provides "field names" in the beginning. This information will help you while using zeek-cut. Make sure that you use the "fields" and not the "types".
| Tool/Auxilary Name | Purpose |
|---|---|
| Zeek-cut | Cut specific columns from zeek logs. |
Let's see the "zeek-cut" in action. Let's extract the uid, protocol, source and destination hosts, and source and destination ports from the conn.log. We will first read the logs with the cat command and then extract the event of interest fields with zeek-cut auxiliary to compare the difference.
root@ubuntu$ cat conn.log
...
#fields ts  uid id.orig_h   id.orig_p   id.resp_h   id.resp_p   proto   service duration    orig_bytes  resp_bytes  conn_state  local_orig  local_resp  missed_bytes    history orig_pkts   orig_ip_bytes   resp_pkts   resp_ip_bytes   tunnel_parents
#types  time    string  addr    port    addr    port    enum    string  interval    count   count   string  bool    bool    count   string  count   count   count   count   set[string]
1488571051.943250   CTMFXm1AcIsSnq2Ric  192.168.121.2   51153   192.168.120.22  53  udp dns 0.001263    36  106 SF  -   -0  Dd  1   64  1   134 -
1488571038.380901   CLsSsA3HLB2N6uJwW   192.168.121.10  50080   192.168.120.10  514 udp -   0.000505    234 0   S0  -   -0  D   2   290 0   0   -

root@ubuntu$ cat conn.log | zeek-cut uid proto id.orig_h id.orig_p id.resp_h id.resp_p
CTMFXm1AcIsSnq2Ric  udp 192.168.121.2   51153   192.168.120.22  53
CLsSsA3HLB2N6uJwW   udp 192.168.121.10  50080   192.168.120.10  514
As shown in the above output, the "zeek-cut" auxiliary provides massive help to extract specific fields with minimal effort. Now take time to read log formats, practice the log reading/extracting operations and answer the questions.
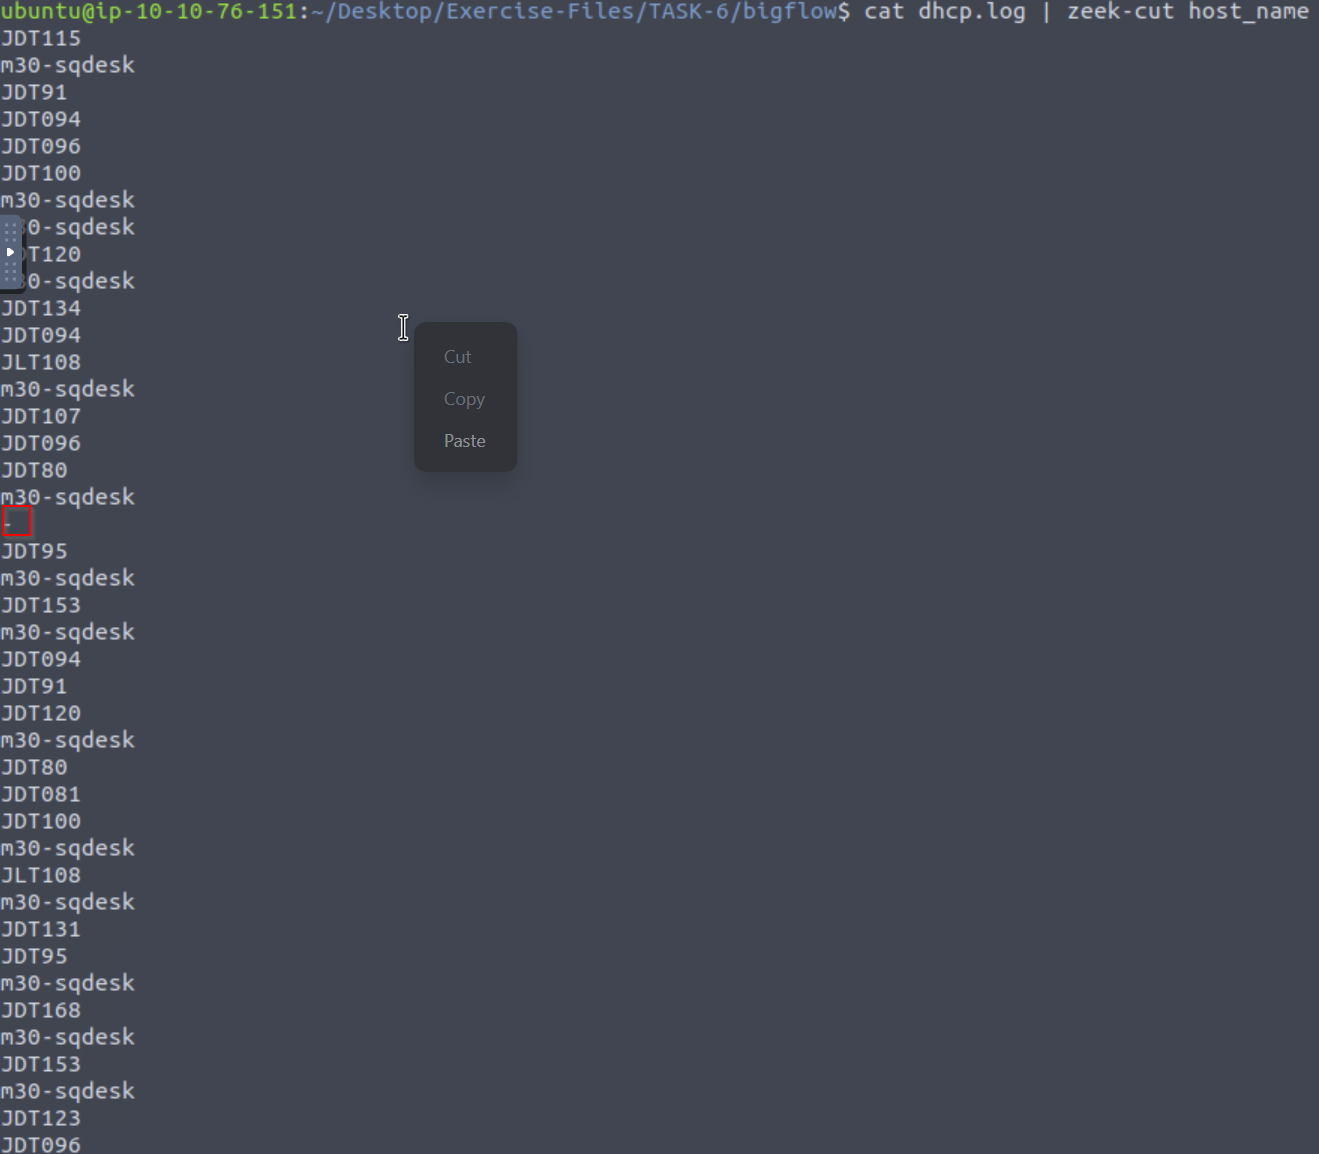
Flag 1
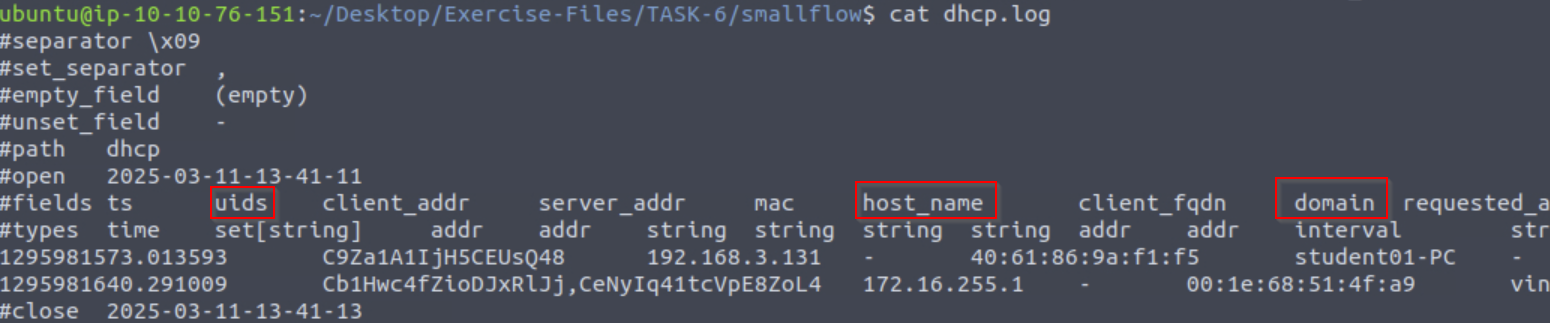
Investigate the sample.pcap file. Investigate the dhcp.log file. What is the available hostname?
We run a Zeek scan against sample.pcap using zeek -C -r sample.pcap and read dhcp.log by running cat dhcp.log.
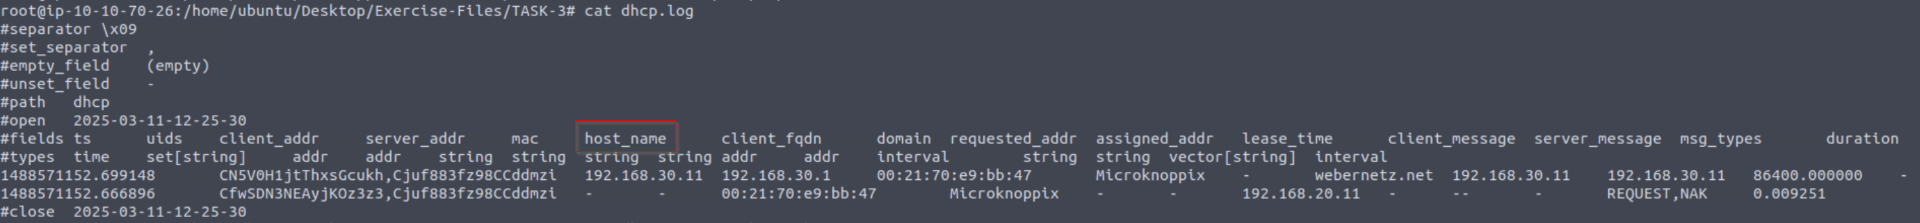
As we can see, the parameter hostname is represented as host_name.
With this in mind, we use zeek-cut by executing cat dhcp.log | zeek-cut host_name to retrieve our flag.

Flag 2
Investigate the dns.log file. What is the number of unique DNS queries?
As we run cat dns.log, we see that the parameter query stores all DNS requested in each request.
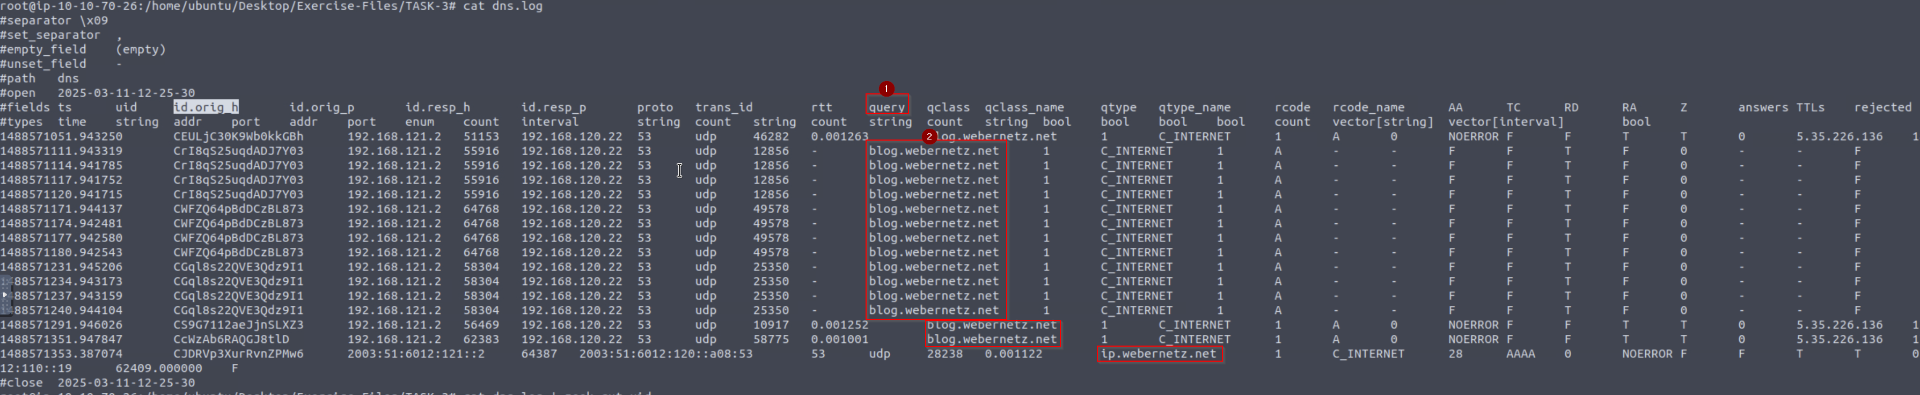
With this in mind, we can execute cat dns.log | zeek-cut query | sort | uniq | wc -l
-
zeek-cut queryto get all query parameters -
| sort | uniqto get only unique output -
wc -lto count all lines of output
And we get the flag as follows.

Flag 3
Investigate the conn.log file. What is the longest connection duration?
As we run cat conn.log, we see the parameter duration.
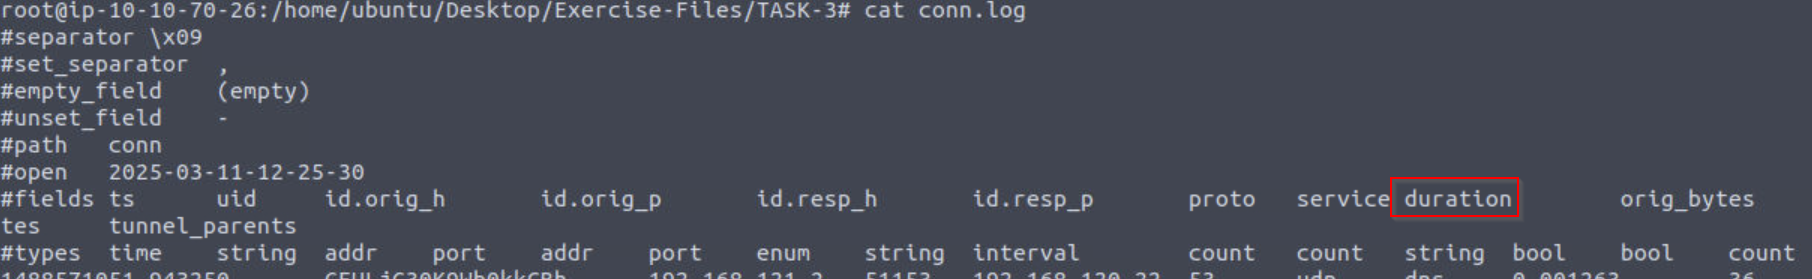
To verify that duration parameter outputs what we are looking for, we run cat conn.log | zeek-cut duration and sure enough it outputs exactly what we want, the connection duration.
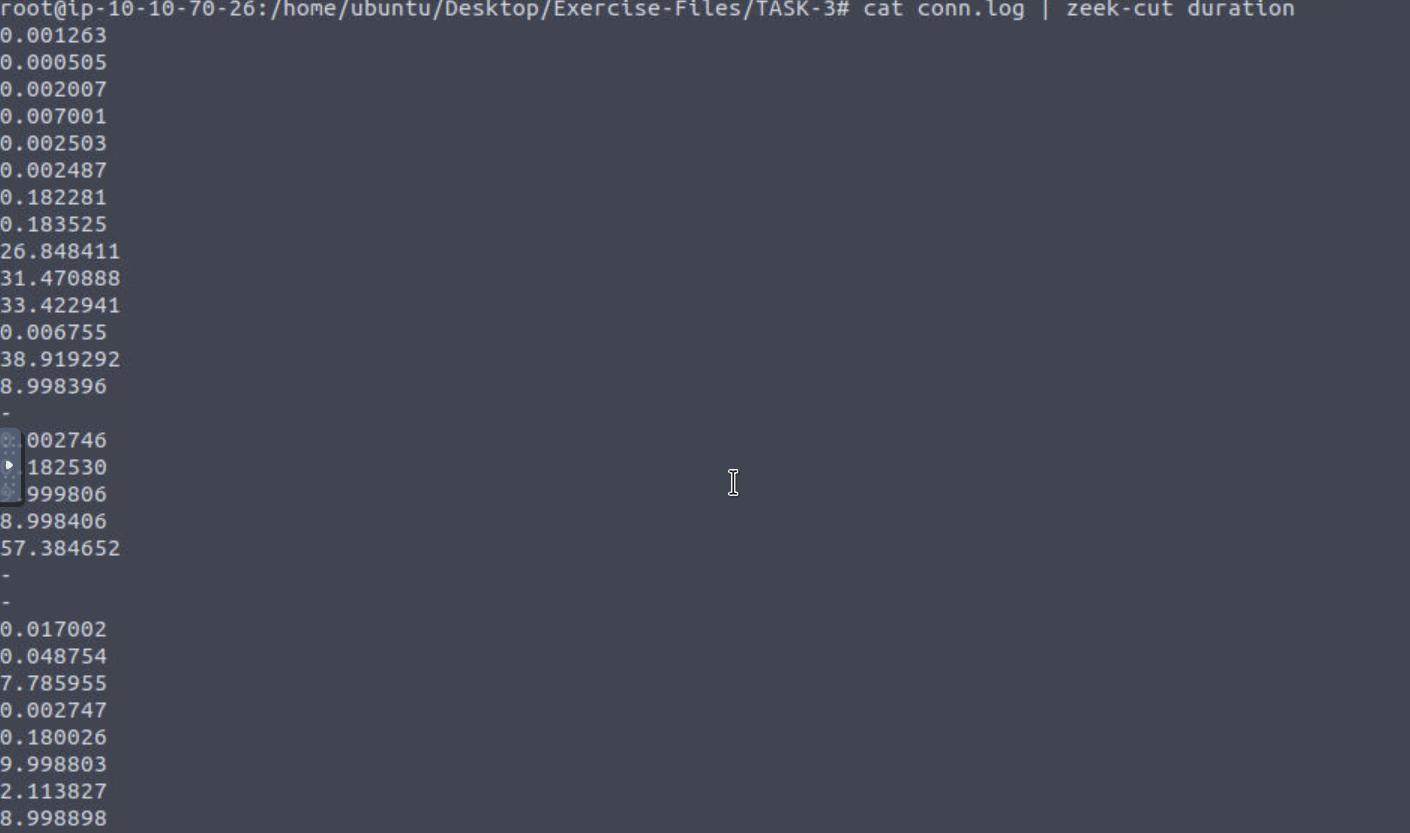
We can run cat conn.log | zeek-cut duration | sort -n | tail -1
-
sort -nsorts output numerically -
tail -1gets the last output

3. CLI Kung-Fu Recall: Processing Zeek Logs
Graphical User Interfaces (GUI) are handy and good for accomplishing tasks and processing information quickly. There are multiple advantages of GUIs, especially when processing the information visually. However, when processing massive amounts of data, GUIs are not stable and as effective as the CLI (Command Line Interface) tools.
The critical point is: What if there is no "function/button/feature" for what you want to find/view/extract?
Having the power to manipulate the data at the command line is a crucial skill for analysts. Not only in this room but each time you deal with packets, you will need to use command-line tools, Berkeley Packet Filters (BPF) and regular expressions to find/view/extract the data you are looking for. This task provides quick cheat-sheet like information to help you write CLI queries for your event of interest.
Command Categories and Usage
Basics
| Command | Purpose |
|---|---|
history |
View the command history. |
!10 |
Execute the 10th command in history. |
!! |
Execute the previous command. |
Read File
| Command | Purpose |
|---|---|
cat sample.txt |
Read the sample.txt file. |
head sample.txt |
Read the first 10 lines of the file. |
tail sample.txt |
Read the last 10 lines of the file. |
Find & Filter
| Command | Purpose |
|---|---|
| `cat test.txt \ | cut -f 1` |
| `cat test.txt \ | cut -c1` |
| `cat test.txt \ | grep 'keywords'` |
| `cat test.txt \ | sort` |
| `cat test.txt \ | sort -n` |
| `cat test.txt \ | uniq` |
| `cat test.txt \ | wc -l` |
| `cat test.txt \ | nl` |
Advanced
| Command | Purpose |
|---|---|
| `cat test.txt \ | sed -n '11p'` |
| `cat test.txt \ | sed -n '10,15p'` |
| `cat test.txt \ | awk 'NR < 11 {print $0}'` |
| `cat test.txt \ | awk 'NR == 11 {print $0}'` |
Special
| Command | Purpose |
|---|---|
| `cat signatures.log \ | zeek-cut uid src_addr dst_addr` |
Common Use Cases
| Use Case | Description |
|---|---|
| `sort \ | uniq` |
| `sort \ | uniq -c` |
sort -nr |
Sort values numerically and recursively. |
rev |
Reverse string characters. |
cut -f 1 |
Cut field 1. |
cut -d '.' -f 1-2 |
Split the string on every dot and keep the first two fields. |
grep -v 'test' |
Display lines that don't match "test". |
grep -v -e 'test1' -e 'test2' |
Display lines that don't match "test1" or "test2". |
file |
View file information. |
| `grep -rin Testvalue1 \ | column -t \ |
This Markdown table makes it easier to read and use. Let me know if you need any refinements! 🚀
4. Zeek Signatures
Zeek supports signatures to have rules and event correlations to find noteworthy activities on the network. Zeek signatures use low-level pattern matching and cover conditions similar to Snort rules. Unlike Snort rules, Zeek rules are not the primary event detection point. Zeek has a scripting language and can chain multiple events to find an event of interest. We focus on the signatures in this task, and then we will focus on Zeek scripting in the following tasks.
Zeek signatures are composed of three logical paths; signature id, conditions and action. The signature breakdown is shown in the table below;
| Signature id | Unique signature name. |
|---|---|
| Conditions |
Header: Filtering the packet headers for specific source and destination addresses, protocol and port numbers. Content: Filtering the packet payload for specific value/pattern. |
| Action |
Default action: Create the "signatures.log" file in case of a signature match. Additional action: Trigger a Zeek script. |
Now let's dig more into the Zeek signatures. The below table provides the most common conditions and filters for the Zeek signatures.
| Condition Field | Available Filters |
|---|---|
| Header | src-ip: Source IP. dst-ip: Destination IP. src-port: Source port. dst-port: Destination port. ip-proto: Target protocol. Supported protocols; TCP, UDP, ICMP, ICMP6, IP, IP6 |
| Content |
payload: Packet payload. http-request: Decoded HTTP requests. http-request-header: Client-side HTTP headers. http-request-body: Client-side HTTP request bodys. http-reply-header: Server-side HTTP headers. http-reply-body: Server-side HTTP request bodys. ftp: Command line input of FTP sessions. |
| Context | same-ip: Filtering the source and destination addresses for duplication. |
| Action | **event: **Signature match message. |
| Comparison Operators | ==, !=, <, <=, >, >= |
| NOTE! | Filters accept string, numeric and regex values. |
Run Zeek with signature file
{% raw %}ubuntu@ubuntu$ zeek -C -r sample.pcap -s sample.sig
Example | Cleartext Submission of Password
Let's create a simple signature to detect HTTP cleartext passwords.
Sample Signature
signature http-password {
     ip-proto == tcp
     dst-port == 80
     payload /.*password.*/
     event "Cleartext Password Found!"
}

# signature: Signature name.
# ip-proto: Filtering TCP connection.
# dst-port: Filtering destination port 80.
# payload: Filtering the "password" phrase.
# event: Signature match message.
Remember, Zeek signatures support regex. Regex ".*" matches any character zero or more times. The rule will match when a "password" phrase is detected in the packet payload. Once the match occurs, Zeek will generate an alert and create additional log files (signatures.log and notice.log).
Signature Usage and Log Analysis
ubuntu@ubuntu$ zeek -C -r http.pcap -s http-password.sig
ubuntu@ubuntu$ ls
clear-logs.sh  conn.log  files.log  http-password.sig  http.log  http.pcap  notice.log  packet_filter.log  signatures.log

ubuntu@ubuntu$ cat notice.log  | zeek-cut id.orig_h id.resp_h msg
10.10.57.178    44.228.249.3    10.10.57.178: Cleartext Password Found!
10.10.57.178    44.228.249.3    10.10.57.178: Cleartext Password Found!

ubuntu@ubuntu$ cat signatures.log | zeek-cut src_addr dest_addr sig_id event_msg
10.10.57.178        http-password   10.10.57.178: Cleartext Password Found!
10.10.57.178        http-password   10.10.57.178: Cleartext Password Found!
As shown in the above terminal output, the signatures.log and notice.log provide basic details and the signature message. Both of the logs also have the application banner field. So it is possible to know where the signature match occurs. Let's look at the application banner!
Log Analysis
ubuntu@ubuntu$ cat signatures.log | zeek-cut sub_msg
POST /userinfo.php HTTP/1.1\x0d\x0aHost: testphp.vulnweb.com\x0d\x0aUser-Agent: Mozilla/5.0 (X11; Ubuntu; Linux x86_64; rv:98.0) Gecko/20100101 Firefox/...

ubuntu@ubuntu$ cat notice.log  | zeek-cut sub
POST /userinfo.php HTTP/1.1\x0d\x0aHost: testphp.vulnweb.com\x0d\x0aUser-Agent: Mozilla/5.0 (X11; Ubuntu; Linux x86_64; rv:98.0) Gecko/20100101 Firefox/...
We will demonstrate only one log file output to avoid duplication after this point. You can practice discovering the event of interest by analysing notice.log and signatures.log.
Let's create another rule to filter FTP traffic. This time, we will use the FTP content filter to investigate command-line inputs of the FTP traffic. The aim is to detect FTP "admin" login attempts. This basic signature will help us identify the admin login attempts and have an idea of possible admin account abuse or compromise events.
Sample Signature
signature ftp-admin {
     ip-proto == tcp
     ftp /.*USER.*dmin.*/
     event "FTP Admin Login Attempt!"
}
Let's run the Zeek with the signature and investigate the signatures.log and notice.log.
ubuntu@ubuntu$ zeek -C -r ftp.pcap -s ftp-admin.sig
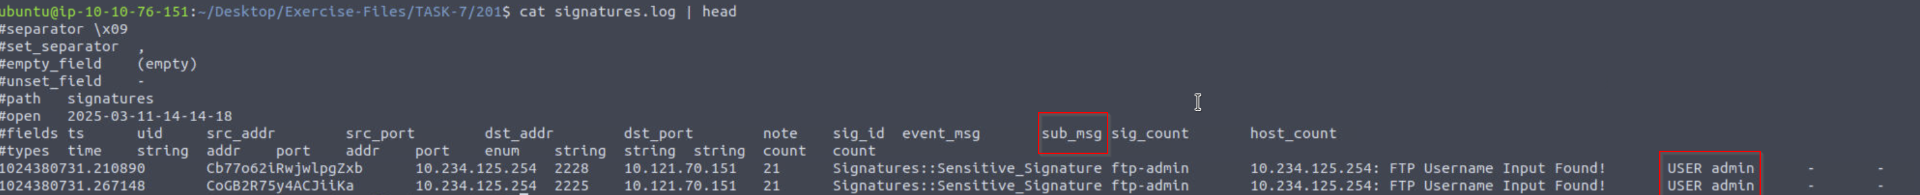
ubuntu@ubuntu$ cat signatures.log | zeek-cut src_addr dst_addr event_msg sub_msg | sort -r| uniq
10.234.125.254 10.121.70.151 10.234.125.254: FTP Admin Login Attempt! USER administrator
10.234.125.254 10.121.70.151 10.234.125.254: FTP Admin Login Attempt! USER adminOur rule shows us that there are multiple logging attempts with account names containing the "admin" phrase. The output gives us great information to notice if there is a brute-force attempt for an admin account.
This signature can be considered a case signature. While it is accurate and works fine, we need global signatures to detect the "known threats/anomalies". We will need those case-based signatures for significant and sophistical anomalies like zero-days and insider attacks in the real-life environment. Having individual rules for each case will create dozens of logs and alerts and cause missing the real anomaly. The critical point is logging logically, not logging everything.
We can improve our signature by not limiting the focus only to an admin account. In that case, we need to know how the FTP protocol works and the default response codes. If you don't know these details, please refer to RFC documentation.
Let's optimise our rule and make it detect all possible FTP brute-force attempts.
This signature will create logs for each event containing "FTP 530 response", which allows us to track the login failure events regardless of username.
signature ftp-brute {
     ip-proto == tcp
     payload /.*530.*Login.*incorrect.*/
     event "FTP Brute-force Attempt"
}
Zeek signature files can consist of multiple signatures. Therefore we can have one file for each protocol/situation/threat type. Let's demonstrate this feature in our global rule.
signature ftp-username {
    ip-proto == tcp
    ftp /.*USER.*/
    event "FTP Username Input Found!"
}

signature ftp-brute {
    ip-proto == tcp
     payload /.*530.*Login.*incorrect.*/
    event "FTP Brute-force Attempt!"
}
Let's merge both of the signatures in a single file. We will have two different signatures, and they will generate alerts according to match status. The result will show us how we benefit from this action. Again, we will need the "CLI Kung-Fu" skills to extract the event of interest.
This rule should show us two types of alerts and help us to correlate the events by having "FTP Username Input" and "FTP Brute-force Attempt" event messages. Let's investigate the logs. We're grepping the logs in range 1001-1004 to demonstrate that the first rule matches two different accounts (admin and administrator).
ubuntu@ubuntu$ zeek -C -r ftp.pcap -s ftp-admin.sig
ubuntu@ubuntu$ cat notice.log | zeek-cut uid id.orig_h id.resp_h msg sub | sort -r| nl | uniq | sed -n '1001,1004p'
  1001  CeMYiaHA6AkfhSnd    10.234.125.254  10.121.70.151   10.234.125.254: FTP Username Input Found!   USER admin
  1002  CeMYiaHA6AkfhSnd    10.234.125.254  10.121.70.151   10.121.70.151: FTP Brute-force Attempt! 530 Login incorrect.
  1003  CeDTDZ2erDNF5w7dyf  10.234.125.254  10.121.70.151   10.234.125.254: FTP Username Input Found!   USER administrator
  1004  CeDTDZ2erDNF5w7dyf  10.234.125.254  10.121.70.151   10.121.70.151: FTP Brute-force Attempt! 530 Login incorrect.
Snort Rules in Zeek?
While Zeek was known as Bro, it supported Snort rules with a script called snort2bro, which converted Snort rules to Bro signatures. However, after the rebranding, workflows between the two platforms have changed. The official Zeek document mentions that the script is no longer supported and is not a part of the Zeek distribution.
Flag 1
Investigate the http.pcap file. Create the HTTP signature shown in the task and investigate the pcap. What is the source IP of the first event?
Use the signature created in the task by replacing the content of the http-password.sig with this.
signature http-password {
     ip-proto == tcp
     dst-port == 80
     payload /.*password.*/
     event "Cleartext Password Found!"
}
Then we run Zeek against the pcap file using this signature by executing zeek -C -r http.pcap -s http-password.sig.
We then just run cat notice.log | zeek-cut uid id.orig_h
-
uidto view the list of output -
id.orig_hto view the source IPs
We can retrieve the flag just like that.

Flag 2
Run cat notice.log | zeek-cut uid id.orig_p.
-
uidto identify the list of output -
id.orig_pto view the source ports
What is the source port of the second event?

Flag 3
Investigate the conn.log.
What is the total number of the sent and received packets from source port 38706?
Run cat conn.log | zeek-cut uid id.orig_p orig_pkts resp_pkts | grep 38706.
-
uidto identify the list of output -
id.orig_pto view the source ports -
orig_pktsto view sent packets count -
resp_pktsto view received packets count -
grep 38706to get the line that matches 38706 as port number

Flag 4
Create the global rule shown in the task and investigate the ftp.pcap file.
Investigate the notice.log. What is the number of unique events?
Replace signatures in ftp-bruteforce.sig with the global rule in the task.
signature ftp-username {
    ip-proto == tcp
    ftp /.*USER.*/
    event "FTP Username Input Found!"
}

signature ftp-brute {
    ip-proto == tcp
     payload /.*530.*Login.*incorrect.*/
    event "FTP Brute-force Attempt!"
}
We just run cat notice.log | zeek-cut uid | sort | uniq | wc -l.
-
uidto identify the list of output -
sort | uniqto list unique packets only -
wc -lto count number of output lines

Flag 5
What is the number of ftp-brute signature matches?
We run cat notice.log | zeek-cut uid msg | grep Attempt | wc -l
-
uidto identify the list of output -
msgto output the message associated with the output -
grep Attemptas recognised thatAttemptis part of the output message for a FTP bruteforce as seen below (withoutwc -l)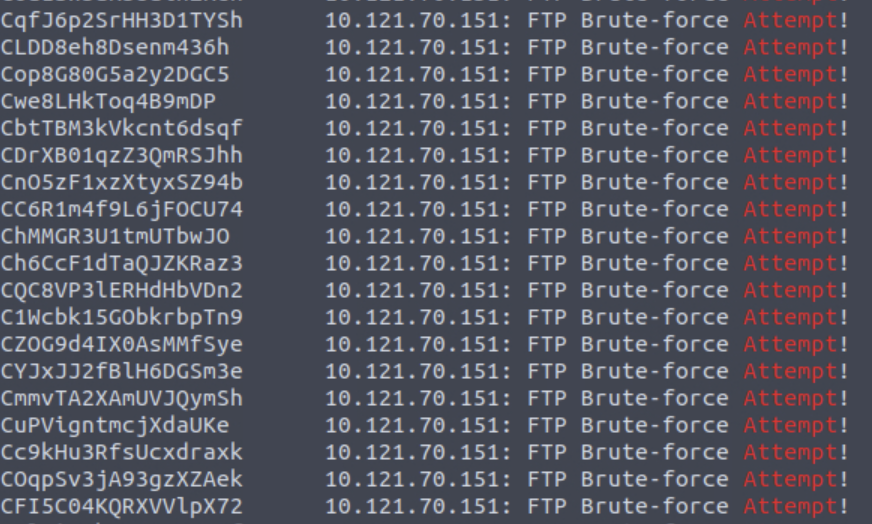
-
wc -lto count the lines of output

5. Zeek Scripts: Fundamentals
Zeek Scripts
Zeek has its own event-driven scripting language, which is as powerful as high-level languages and allows us to investigate and correlate the detected events. Since it is as capable as high-level programming languages, you will need to spend time on Zeek scripting language in order to become proficient. In this room, we will cover the basics of Zeek scripting to help you understand, modify and create basic scripts. Note that scripts can be used to apply a policy and in this case, they are called policy scripts.
| Zeek has base scripts installed by default, and these are not intended to be modified. | These scripts are located in "/opt/zeek/share/zeek/base". |
|---|---|
| User-generated or modified scripts should be located in a specific path. | These scripts are located in "/opt/zeek/share/zeek/site". |
| Policy scripts are located in a specific path. | These scripts are located in "/opt/zeek/share/zeek/policy". |
| Like Snort, to automatically load/use a script in live sniffing mode, you must identify the script in the Zeek configuration file. You can also use a script for a single run, just like the signatures. | The configuration file is located in "/opt/zeek/share/zeek/site/local.zeek". |
- Zeek scripts use the ".zeek" extension.
- Do not modify anything under the "zeek/base" directory. User-generated and modified scripts should be in the "zeek/site" directory.
- You can call scripts in live monitoring mode by loading them with the command
load @/script/pathorload @script-namein local.zeek file. - Zeek is event-oriented, not packet-oriented! We need to use/write scripts to handle the event of interest.
Running Zeek with signature
ubuntu@ubuntu$ zeek -C -r sample.pcap -s sample.sig
GUI vs Scripts
Have you ever thought about automating tasks in Wireshark, tshark or tcpdump? Zeek provides that chance to us with its scripting power. Let's say we need to extract all available DHCP hostnames from a pcap file. In that case, we have several options like using tcpdump, Wireshark, tshark or Zeek.
Let's see Wireshark on the stage first. You can have the same information with Wireshark. However, while this information can be extracted using Wireshark is not easy to transfer the data to another tool for processing. Tcpdump and tshark are command-line tools, and it is easy to extract and transfer the data to another tool for processing and correlating.
extracting hostnames with tcpdump and tshark
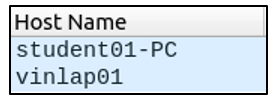
ubuntu@ubuntu$ sudo tcpdump -ntr smallFlows.pcap port 67 or port 68 -e -vv | grep 'Hostname Option' | awk -F: '{print $2}' | sort -nr | uniq | nl
     1   "vinlap01"
     2   "student01-PC"
ubuntu@ubuntu$ tshark -V -r smallFlows.pcap -Y "udp.port==67 or udp.port==68" -T fields -e dhcp.option.hostname | nl | awk NF
     1  student01-PC
     2  vinlap01
Now let's see Zeek scripts in action. First, let's look at the components of the Zeek script. Here the first, second and fourth lines are the predefined syntaxes of the scripting language. The only part we created is the third line which tells Zeek to extract DHCP hostnames. Now compare this automation ease with the rest of the methods. Obviously, this four-line script is easier to create and use. While tcpdump and tshark can provide similar results, transferring uncontrolled data through multiple pipelines is not much preferred.
event dhcp_message (c: connection, is_orig: bool, msg: DHCP::Msg, options: DHCP::Options)
{
print options$host_name;
}
Now let's use the Zeek script and see the output.
ubuntu@ubuntu$ zeek -C -r smallFlows.pcap dhcp-hostname.zeek
student01-PC
vinlap01
The provided outputs show that our script works fine and can extract the requested information. This should show why Zeek is helpful in data extraction and correlation. Note that Zeek scripting is a programming language itself, and we are not covering the fundamentals of Zeek scripting. In this room, we will cover the logic of Zeek scripting and how to use Zeek scripts. You can learn and practice the Zeek scripting language by using Zeek's official training platform for free.
There are multiple options to trigger conditions in Zeek. Zeek can use "Built-In Function" (Bif) and protocols to extract information from traffic data. You can find supported protocols and Bif either by looking in your setup or visiting the Zeek repo.
| Customized script locations |
|---|
| /opt/zeek/share/zeek/base/bif /opt/zeek/share/zeek/base/bif/plugins /opt/zeek/share/zeek/base/protocols |
Flag 1
Investigate the smallFlows.pcap file. Investigate the dhcp.log file. What is the domain value of the "vinlap01" host?
We first run Zeek against smallFlows.pcap by executing zeek -C -r smallFlows.pcap.
As run read dhcp.log, we can identify the parameters that we want to filter to get our output.
Run cat dhcp.log | zeek-cut uids host_name domain | grep vinlap01 to get the flag.

Flag 2
Investigate the bigFlows.pcap file. Investigate the dhcp.log file. What is the number of identified unique hostnames?
We first run Zeek against bigFlows.pcap by executing zeek -C -r bigFlows.pcap.
We then run cat dhcp.log | zeek-cut host_name | sort | uniq to get a list of unique hostnames.
We see a -, indicating an invalid unique hostname.
We then add wc -l at the back of the previous command and subtract the output by 1 to get the flag.

Flag 3
Investigate the dhcp.log file. What is the identified domain value?
We just run cat dhcp.log | zeek-cut domain | sort | uniq to get the flag.

6. Zeek Scripts: Scripts and Signatures
Scripts 101 | Write Basic Scripts
Scripts contain operators, types, attributes, declarations and statements, and directives. Let's look at a simple example event called "zeek_init" and "zeek_done". These events work once the Zeek process starts and stops. Note that these events don't have parameters, and some events will require parameters.
Sample script
event zeek_init()
    {
     print ("Started Zeek!");
    }
event zeek_done()
    {
    print ("Stopped Zeek!");
    }

# zeek_init: Do actions once Zeek starts its process.
# zeek_done: Do activities once Zeek finishes its process.
# print: Prompt a message on the terminal.
Run Zeek with the script
ubuntu@ubuntu$ zeek -C -r sample.pcap 101.zeek
Started Zeek!
Stopped Zeek!
The above output shows how the script works and provides messages on the terminal. Zeek will create logs in the working directory separately from the scripts tasks.
Let's print the packet data to the terminal and see the raw data. In this script, we are requesting details of a connection and extracting them without any filtering or sorting of the data. To accomplish this, we are using the "new_connection" event. This event is automatically generated for each new connection. This script provides bulk information on the terminal. We need to get familiar with Zeek's data structure to reduce the amount of information and focus on the event of interest. To do so, we need to investigate the bulk data.
event new_connection(c: connection)
{
    print c;
}
Run Zeek with the script
ubuntu@ubuntu$ zeek -C -r sample.pcap 102.zeek
[id=[orig_h=192.168.121.40, orig_p=123/udp, resp_h=212.227.54.68, resp_p=123/udp], orig=[size=48, state=1, num_pkts=0, num_bytes_ip=0, flow_label=0, l2_addr=00:16:47:df:e7:c1], resp=[size=0, state=0, num_pkts=0, num_bytes_ip=0, flow_label=0, l2_addr=00:00:0c:9f:f0:79], start_time=1488571365.706238, duration=0 secs, service={}, history=D, uid=CajwDY2vSUtLkztAc, tunnel=, vlan=121, inner_vlan=, dpd=, dpd_state=, removal_hooks=, conn=, extract_orig=F, extract_resp=F, thresholds=, dce_rpc=, dce_rpc_state=, dce_rpc_backing=, dhcp=, dnp3=, dns=, dns_state=, ftp=, ftp_data_reuse=F, ssl=, http=, http_state=, irc=, krb=, modbus=, mysql=, ntlm=, ntp=, radius=, rdp=, rfb=, sip=, sip_state=, snmp=, smb_state=, smtp=, smtp_state=, socks=, ssh=, syslog=]
The above terminal provides bulk data for each connection. This style is not the best usage, and in real life, we will need to filter the information for specific purposes. If you look closely at the output, you can see an ID and field value for each part.
To filter the event of interest, we will use the primary tag (in this case, it is c --comes from "c: connection"--), id value (id=), and field name. You should notice that the fields are the same as the fields in the log files.
event new_connection(c: connection)
{
    print ("###########################################################");
    print ("");
    print ("New Connection Found!");
    print ("");
    print fmt ("Source Host: %s # %s --->", c$id$orig_h, c$id$orig_p);
    print fmt ("Destination Host: resp: %s # %s <---", c$id$resp_h, c$id$resp_p);
    print ("");
}

# %s: Identifies string output for the source.
# c$id: Source reference field for the identifier.
Now you have a general idea of running a script and following the provided output on the console. Let's look closer to another script that extracts specific information from packets. The script above creates logs and prompts each source and destination address for each connection.
Let's see this script in action.
ubuntu@ubuntu$ zeek -C -r sample.pcap 103.zeek
###########################################################
New Connection Found! Source Host: 192.168.121.2 # 58304/udp --->
Destination Host: resp: 192.168.120.22 # 53/udp <---
###########################################################
The above output shows that we successfully extract specific information from the events. Remember that this script extracts the event of interest (in this example, a new connection), and we still have logs in the working directory. We can always modify and optimise the scripts at any time.
Scripts 201 | Use Scripts and Signatures Together
Up to here, we covered the basics of Zeek scripts. Now it is time to use scripts collaboratively with other scripts and signatures to get one step closer to event correlation. Zeek scripts can refer to signatures and other Zeek scripts as well. This flexibility provides a massive advantage in event correlation.
Let's demonstrate this concept with an example. We will create a script that detects if our previously created "ftp-admin" rule has a hit.
event signature_match (state: signature_state, msg: string, data: string)
{
if (state$sig_id == "ftp-admin")
    {
    print ("Signature hit! --> #FTP-Admin ");
    }
}
This basic script quickly checks if there is a signature hit and provides terminal output to notify us. We are using the "signature_match" event to accomplish this. You can read more about events here. Note that we are looking only for "ftp-admin" signature hits. The signature is shown below.
signature ftp-admin {
    ip-proto == tcp
    ftp /.*USER.*admin.*/
    event "FTP Username Input Found!"
}
Let's see this script in action.
ubuntu@ubuntu$ zeek -C -r ftp.pcap -s ftp-admin.sig 201.zeek
Signature hit! --> #FTP-Admin Signature hit! --> #FTP-Admin
Signature hit! --> #FTP-Admin Signature hit! --> #FTP-Admin
The above output shows that we successfully combined the signature and script. Zeek processed the signature and logs then the script controlled the outputs and provided a terminal output for each rule hit.
Scripts 202 | Load Local Scripts
Load all local scripts
We mentioned that Zeek has base scripts located in "/opt/zeek/share/zeek/base". You can load all local scripts identified in your "local.zeek" file. Note that base scripts cover multiple framework functionalities. You can load all base scripts by easily running the local command.
Load local scripts
ubuntu@ubuntu$ zeek -C -r ftp.pcap local
ubuntu@ubuntu$ ls
101.zeek  103.zeek          clear-logs.sh  ftp.pcap            packet_filter.log  stats.log
102.zeek  capture_loss.log  conn.log       loaded_scripts.log  sample.pcap        weird.log
The above output demonstrates how to run all base scripts using the "local" command. Look at the above terminal output; Zeek provided additional log files this time. Loaded scripts generated loaded_scripts.log, capture_loss.log, notice.log, stats.log files. Note that, in our instance, 465 scripts loaded and used by using the "local" command. However, Zeek doesn't provide log files for the scripts doesn't have hits or results.
Load Specific Scripts
Another way to load scripts is by identifying the script path. In that case, you have the opportunity of loading a specific script or framework. Let's go back to FTP brute-forcing case. We created a script that detects multiple admin login failures in previous steps. Zeek has an FTP brute-force detection script as well. Now let's use the default script and identify the differences.
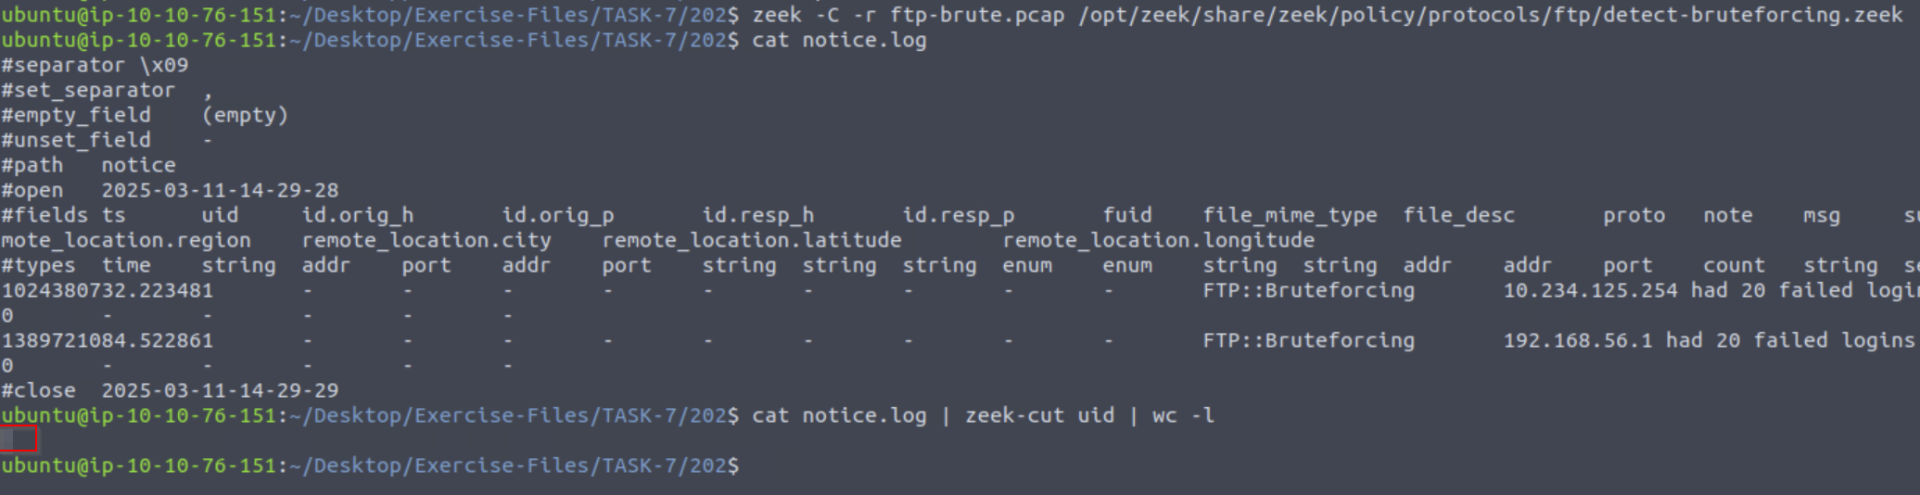
ubuntu@ubuntu$ zeek -C -r ftp.pcap /opt/zeek/share/zeek/policy/protocols/ftp/detect-bruteforcing.zeek

ubuntu@ubuntu$ cat notice.log | zeek-cut ts note msg
1024380732.223481   FTP::Bruteforcing   10.234.125.254 had 20 failed logins on 1 FTP server in 0m1s
The above output shows how to load a specific script. This script provides much more information than the one we created. It provides one single line output and a connection summary for the suspicious incident. You can find and read more on the prebuilt scripts and frameworks by visiting Zeek's online book here.
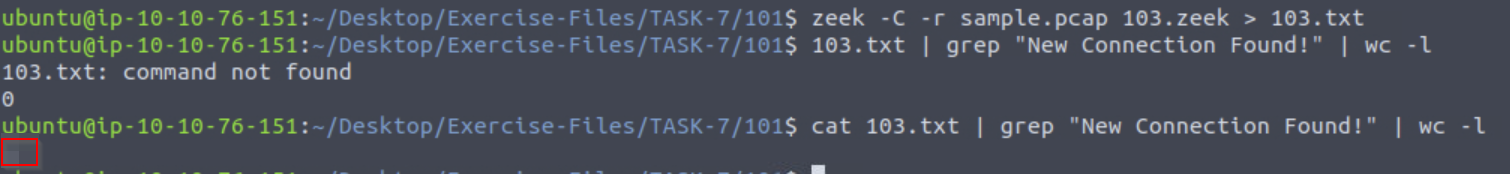
Flag 1
Go to folder TASK-7/101.
Investigate the sample.pcap file with 103.zeek script. Investigate the terminal output. What is the number of the detected new connections?
We first run Zeek on the .pcap file using command zeek -C -r sample.pcap 103.zeek > 103.txt. > 103.txt is added to add all the output into thf ile 103.txt for better reference later.
We the run cat 103.txt | grep "New Connection Found!" | wc -l to count the number of times the string New Conenction Found! is in the file, printing the number of detected new connections.
Flag 2
Go to folder TASK-7/201.
Investigate the ftp.pcap file with ftp-admin.sig signature and 201.zeek script. Investigate the signatures.log file. What is the number of signature hits?
We first run zeek -C -r ftp.pcap -s ftp-admin.sig 201.zeek to apply both the siganature and script.
We then run cat signatures.log | grep "FTP Username Input Found!" | wc -l to count the number of times FTP Username Input Found! is logged.

Flag 3
Investigate the signatures.log file. What is the total number of "administrator" username detections?
By running cat signatures.log | head, we got to know that USER admin is part of the sub_msg parameter.
With this in mind, we execute cat signatures.log | zeek-cut sub_msg | grep administrator | wc -l to get the number of times sub_msg as administrator were logged. And the flag is retrieved.

Flag 4
Investigate the ftp.pcap file with all local scripts, and investigate the loaded_scripts.log file. What is the total number of loaded scripts?
We first run zeek -C -r ftp.pcap local to load all the local scripts onto our .pcap file.
Then we run cat loaded_scripts.log | grep .zeek | sort | uniq | wc -l to count the number of scripts stated in the file. And the flag is retrieved.

Flag 5
Go to folder TASK-7/202.
Investigate the ftp-brute.pcap file with "/opt/zeek/share/zeek/policy/protocols/ftp/detect-bruteforcing.zeek" script. Investigate the notice.log file. What is the total number of brute-force detections?
We first run Zeek using the specified script zeek -C -r ftp-brute.pcap /opt/zeek/share/zeek/policy/protocols/ftp/detect-bruteforcing.zeek.
We then execute cat notice.log | zeek-cut uid | wc -l to get the total number of entries in notice.log and the flag is retrieved.
7. Zeek Scripts: Frameworks
Scripts 203 | Load Frameworks
Zeek has 15+ frameworks that help analysts to discover the different events of interest. In this task, we will cover the common frameworks and functions. You can find and read more on the prebuilt scripts and frameworks by visiting Zeek's online book here.
File Framework | Hashes
Not all framework functionalities are intended to be used in CLI mode. The majority of them are used in scripting. You can easily see the usage of frameworks in scripts by calling a specific framework as load @ $PATH/base/frameworks/framework-name. Now, let's use a prebuilt function of the file framework and have MD5, SHA1 and SHA256 hashes of the detected files. We will call the "File Analysis" framework's "hash-all-files" script to accomplish this. Before loading the scripts, let's look at how it works.
View file framework
ubuntu@ubuntu$ cat hash-demo.zeek
# Enable MD5, SHA1 and SHA256 hashing for all files.
@load /opt/zeek/share/zeek/policy/frameworks/files/hash-all-files.zeek
The above output shows how frameworks are loaded. In earlier tasks, we mentioned that Zeek highly relies on scripts, and the frameworks depend on scripts. Let's have a closer look at the file hash framework and see the script behind it.
View file framework
ubuntu@ubuntu$ cat /opt/zeek/share/zeek/policy/frameworks/files/hash-all-files.zeek
# Enable MD5, SHA1 and SHA256 hashing for all files.

@load base/files/hash
event file_new(f: fa_file)
    {
    Files::add_analyzer(f, Files::ANALYZER_MD5);
    Files::add_analyzer(f, Files::ANALYZER_SHA1);
    Files::add_analyzer(f, Files::ANALYZER_SHA256);
    }
Now let's execute the script and investigate the log file.
Grab file hashes
ubuntu@ubuntu$ zeek -C -r case1.pcap hash-demo.zeek
ubuntu@ubuntu$ zeek -C -r case1.pcap /opt/zeek/share/zeek/policy/frameworks/files/hash-all-files.zeek

ubuntu@ubuntu$ cat files.log | zeek-cut md5 sha1 sha256
cd5a4d3fdd5bffc16bf959ef75cf37bc    33bf88d5b82df3723d5863c7d23445e345828904    6137f8db2192e638e13610f75e73b9247c05f4706f0afd1fdb132d86de6b4012
b5243ec1df7d1d5304189e7db2744128    a66bd2557016377dfb95a87c21180e52b23d2e4e    f808229aa516ba134889f81cd699b8d246d46d796b55e13bee87435889a054fb
cc28e40b46237ab6d5282199ef78c464    0d5c820002cf93384016bd4a2628dcc5101211f4    749e161661290e8a2d190b1a66469744127bc25bf46e5d0c6f2e835f4b92db18
Look at the above terminal outputs. Both of the scripts provided the same result. Here the preference is up to the user. Both of the usage formats are true. Prebuilt frameworks are commonly used in scriptings with the "@load" method. Specific scripts are used as practical scripts for particular use cases.
File Framework | Extract Files
The file framework can extract the files transferred. Let's see this feature in action!
Extract file
ubuntu@ubuntu$ zeek -C -r case1.pcap /opt/zeek/share/zeek/policy/frameworks/files/extract-all-files.zeek
ubuntu@ubuntu$ ls
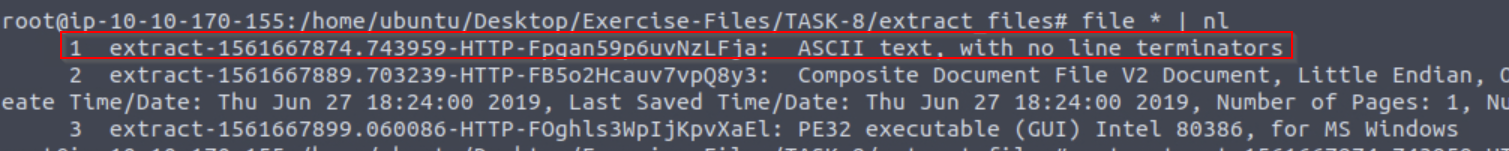
101.zeek 102.zeek 103.zeek case1.pcap clear-logs.sh conn.log dhcp.log dns.log extract_files files.log ftp.pcap http.log packet_filter.log pe.logWe successfully extracted files from the pcap. A new folder called "extract_files" is automatically created, and all detected files are located in it. First, we will list the contents of the folder, and then we will use the file command to determine the file type of the extracted files.
Investigate files
ubuntu@ubuntu$ ls extract_files | nl
     1  extract-1561667874.743959-HTTP-Fpgan59p6uvNzLFja
     2  extract-1561667889.703239-HTTP-FB5o2Hcauv7vpQ8y3
     3  extract-1561667899.060086-HTTP-FOghls3WpIjKpvXaEl

ubuntu@ubuntu$ cd extract_files

ubuntu@ubuntu$ file *| nl
     1  extract-1561667874.743959-HTTP-Fpgan59p6uvNzLFja:  ASCII text, with no line terminators
     2  extract-1561667889.703239-HTTP-FB5o2Hcauv7vpQ8y3:  Composite Document File V2 Document, Little Endian, Os: Windows, Version 6.3, Code page: 1252, Template: Normal.dotm, Last Saved By: Administrator, Revision Number: 2, Name of Creating Application: Microsoft Office Word, Create Time/Date: Thu Jun 27 18:24:00 2019, Last Saved Time/Date: Thu Jun 27 18:24:00 2019, Number of Pages: 1, Number of Words: 0, Number of Characters: 1, Security: 0
     3  extract-1561667899.060086-HTTP-FOghls3WpIjKpvXaEl: PE32 executable (GUI) Intel 80386, for MS Windows
Zeek extracted three files. The "file" command shows us one .txt file, one .doc/.docx file and one .exe file. Zeek renames extracted files. The name format consists of four values that come from conn.log and files.log files; default "extract" keyword, timestamp value (ts), protocol (source), and connection id (conn_uids). Let's look at the files.log to understand possible anomalies better and verify the findings. Look at the below output; files.log provides the same results with additional details. Let's focus on the .exe and correlate this finding by searching its connection id (conn_uids).
The given terminal output shows us that there are three files extracted from the traffic capture. Let's look at the file.log and correlate the findings with the rest of the log files.
Investigate files
ubuntu@ubuntu$ cat files.log | zeek-cut fuid conn_uids tx_hosts rx_hosts mime_type extracted | nl
     1  Fpgan59p6uvNzLFja   CaeNgL1QzYGxxZPwpk  23.63.254.163   10.6.27.102 text/plain  extract-1561667874.743959-HTTP-Fpgan59p6uvNzLFja
     2  FB5o2Hcauv7vpQ8y3   CCwdoX1SU0fF3BGBCe  107.180.50.162  10.6.27.102 application/msword  extract-1561667889.703239-HTTP-FB5o2Hcauv7vpQ8y3
     3  FOghls3WpIjKpvXaEl  CZruIO2cqspVhLuAO9  107.180.50.162  10.6.27.102 application/x-dosexec   extract-1561667899.060086-HTTP-FOghls3WpIjKpvXaEl

ubuntu@ubuntu$ grep -rin CZruIO2cqspVhLuAO9 * | column -t | nl | less -S
#NOTE: The full output is not shown here!. Redo the same actions in the attached VM!
     1  conn.log:43:1561667898.852600   CZruIO2cqspVhLuAO9  10.6.27.102     49162        107.180.50.162      80    tcp  http
     2  files.log:11:1561667899.060086  FOghls3WpIjKpvXaEl  107.180.50.162  10.6.27.102  CZruIO2cqspVhLuAO9  HTTP  0    EXTRACT,PE
     3  http.log:11:1561667898.911759   CZruIO2cqspVhLuAO9  10.6.27.102     49162        107.180.50.162      80    1    GET
The "grep" tool helps us investigate the particular value across all available logs. The above terminal output shows us that the connection id linked with .exe appears in conn.log, files.log, and http.log files. Given example demonstrates how to filter some fields and correlate the findings with the rest of the logs. We've listed the source and destination addresses, file and connection id numbers, MIME types, and file names. Up to now, provided outputs and findings show us that record number three is a .exe file, and other log files provide additional information.
Notice Framework | Intelligence
The intelligence framework can work with data feeds to process and correlate events and identify anomalies. The intelligence framework requires a feed to match and create alerts from the network traffic. Let's demonstrate a single user-generated threat intel file and let Zeek use it as the primary intelligence source.
Intelligence source location: /opt/zeek/intel/zeek_intel.txt
There are two critical points you should never forget. First, the source file has to be tab-delimited. Second, you can manually update the source and adding extra lines doesn't require any re-deployment. However, if you delete a line from the file, you will need to re-deploy the Zeek instance.
Let's add the suspicious URL gathered from the case1.pcap file as a source intel and see this feature in action! Before executing the script, let's look at the intelligence file and the script contents.
Investigate intel file and script
ubuntu@ubuntu$ cat /opt/zeek/intel/zeek_intel.txt
#fields indicator   indicator_type  meta.source meta.desc
smart-fax.com   Intel::DOMAIN   zeek-intel-test Zeek-Intelligence-Framework-Test

ubuntu@ubuntu$ cat intelligence-demo.zeek
# Load intelligence framework!
@load policy/frameworks/intel/seen
@load policy/frameworks/intel/do_notice
redef Intel::read_files += { "/opt/zeek/intel/zeek_intel.txt" };
The above output shows the contents of the intel file and script contents. There is one intelligence input, and it is focused on a domain name, so when this domain name appears in the network traffic, Zeek will create the "intel.log" file and provide the available details.
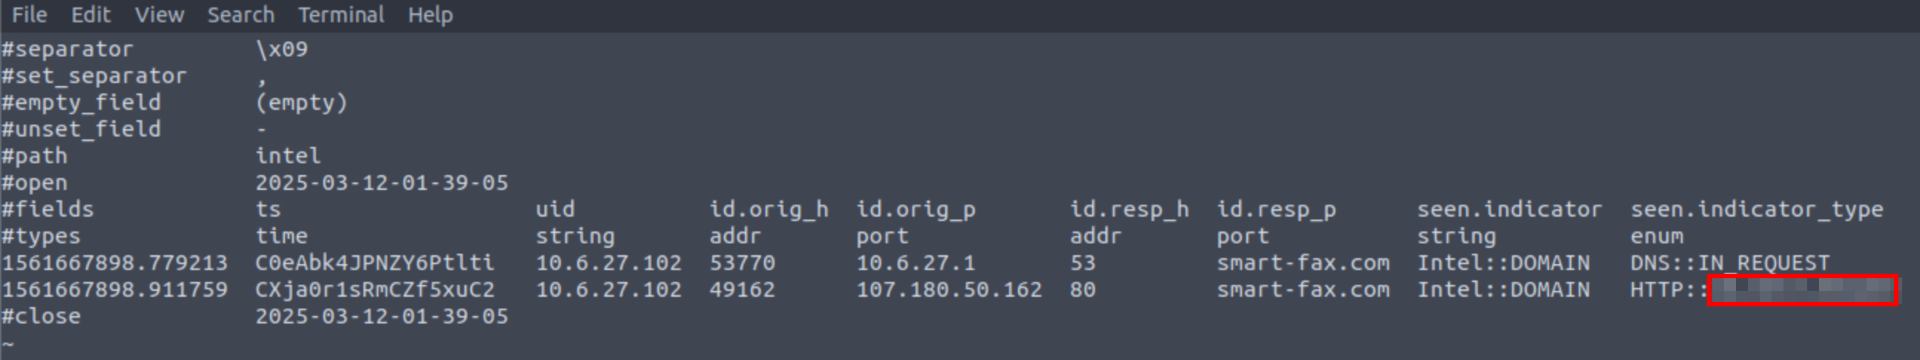
Investigate intel file and script
ubuntu@ubuntu$ zeek -C -r case1.pcap intelligence-demo.zeek

ubuntu@ubuntu$ cat intel.log | zeek-cut uid id.orig_h id.resp_h seen.indicator matched
CZ1jLe2nHENdGQX377  10.6.27.102 10.6.27.1   smart-fax.com   Intel::DOMAIN
C044Ot1OxBt8qCk7f2  10.6.27.102 107.180.50.162  smart-fax.com   Intel::DOMAIN
The above output shows that Zeek detected the listed domain and created the intel.log file. This is one of the easiest ways of using the intelligence framework. You can read more on the intelligence framework here and here.
Flag 1
Investigate the case1.pcap file with intelligence-demo.zeek script. Investigate the intel.log file. Look at the second finding, where was the intel info found?
We run zeek -C -r case1.pcap intelligence-demo.zeek.
To retrieve our flag, we run cat intel.log | column -t | less -S.
-
column -tandless -Sare run as additional parameters to better output formatting
We just notice the seen.indicator_type of the second output to get our flag.
Flag 2
Investigate the http.log file. What is the name of the downloaded .exe file?
We just run cat http.log | grep .exe to retieve the .exe file name.

Flag 3
Investigate the case1.pcap file with hash-demo.zeek script. Investigate the files.log file. What is the MD5 hash of the downloaded .exe file?
We first run zeek -C -r case1.pcap hash-demo.zeek.
We then run cat files.log | zeek-cut mime_type md5 | grep exe.

Flag 4
Investigate the case1.pcap file with file-extract-demo.zeek script. Investigate the "extract_files" folder. Review the contents of the text file. What is written in the file?
After running zeek -C -r case1.pcap file-extract-demo.zeek, we can cd into extract_files.

We can then run file * | nl to list all file types.
We see the first file is in ASCII text, indicating a text file.
We can then run cat on it to read the file and retrieve the flag.

8. Zeek Scripts: Packages
Scripts 204 | Package Manager
Zeek Package Manager helps users install third-party scripts and plugins to extend Zeek functionalities with ease. The package manager is installed with Zeek and available with the zkg command. Users can install, load, remove, update and create packages with the "zkg" tool. You can read more on and view available packages here and here. Please note that you need root privileges to use the "zkg" tool.
Basic usage of zkg;
| Command | Description |
|---|---|
zkg install package_path |
Install a package. Example (zkg install zeek/j-gras/zeek-af_packet-plugin). |
zkg install git_url |
Install package. Example (zkg install https://github.com/corelight/ztest). |
zkg list |
List installed package. |
zkg remove |
Remove installed package. |
zkg refresh |
Check version updates for installed packages. |
zkg upgrade |
Update installed packages. |
There are multiple ways of using packages. The first approach is using them as frameworks and calling specific package path/directory per usage. The second and most common approach is calling packages from a script with the "@load" method. The third and final approach to using packages is calling their package names; note that this method works only for packages installed with the "zkg" install method.
Packages | Cleartext Submission of Password
Let's install a package first and then demonstrate the usage in different approaches.
Note: The package is installed in the given VM.
ubuntu@ubuntu$ zkg install zeek/cybera/zeek-sniffpass
The following packages will be INSTALLED:
  zeek/cybera/zeek-sniffpass (master)
Proceed? [Y/n] Y
Installing "zeek/cybera/zeek-sniffpass"
Installed "zeek/cybera/zeek-sniffpass" (master)
Loaded "zeek/cybera/zeek-sniffpass"

ubuntu@ubuntu$ zkg list
zeek/cybera/zeek-sniffpass (installed: master) - Sniffpass will alert on cleartext passwords discovered in HTTP POST requests
The above output shows how to install and list the installed packages. Now we successfully installed a package. As the description mentions on the above terminal, this package creates alerts for cleartext passwords found in HTTP traffic. Let's use this package in three different ways!
### Calling with script
ubuntu@ubuntu$ zeek -Cr http.pcap sniff-demo.zeek
### View script contents
ubuntu@ubuntu$ cat sniff-demo.zeek
@load /opt/zeek/share/zeek/site/zeek-sniffpass
### Calling from path
ubuntu@ubuntu$ zeek -Cr http.pcap /opt/zeek/share/zeek/site/zeek-sniffpass
### Calling with package name
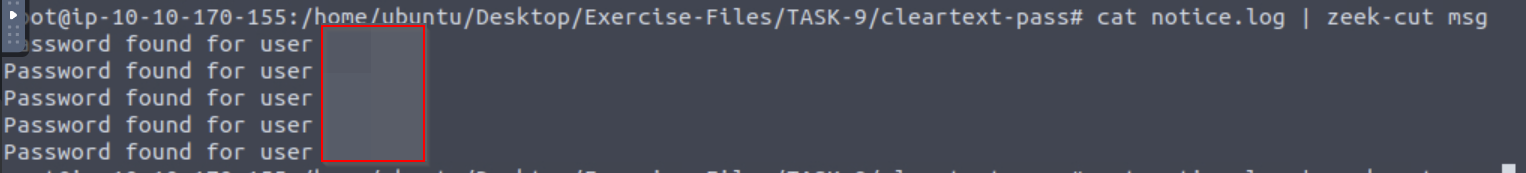
ubuntu@ubuntu$ zeek -Cr http.pcap zeek-sniffpassThe above output demonstrates how to execute/load packages against a pcap. You can use the best one for your case. The "zeek-sniffpass" package provides additional information in the notice.log file. Now let's review the logs and discover the obtained data using the specific package.
ubuntu@ubuntu$ cat notice.log | zeek-cut id.orig_h id.resp_h proto note msg
10.10.57.178    44.228.249.3    tcp SNIFFPASS::HTTP_POST_Password_Seen  Password found for user BroZeek
10.10.57.178    44.228.249.3    tcp SNIFFPASS::HTTP_POST_Password_Seen  Password found for user ZeekBro
The above output shows that the package found cleartext password submissions, provided notice, and grabbed the usernames. Remember, in TASK-5 we created a signature to do the same action. Now we can do the same activity without using a signature file. This is a simple demonstration of the benefit and flexibility of the Zeek scripts.
Packages | Geolocation Data
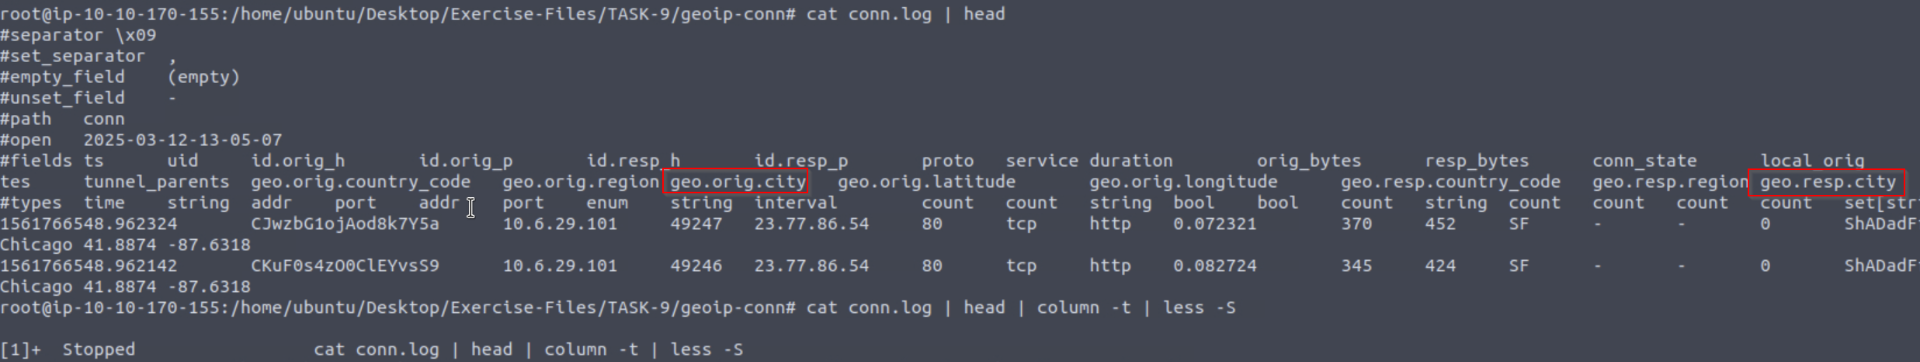
Let's use another helpful package called "geoip-conn". This package provides geolocation information for the IP addresses in the conn.log file. It depends on "GeoLite2-City.mmdb" database created by MaxMind. This package provides location information for only matched IP addresses from the internal database.
ubuntu@ubuntu$ zeek -Cr case1.pcap geoip-conn

ubuntu@ubuntu$ cat conn.log | zeek-cut uid id.orig_h id.resp_h geo.orig.country_code geo.orig.region geo.orig.city geo.orig.latitude geo.orig.longitude geo.resp.country_code geo.resp.region geo.resp.city
Cbk46G2zXi2i73FOU6  10.6.27.102 23.63.254.163   -   -   -   -   -   US  CA  Los Angeles
Up to now, we've covered what the Zeek packages are and how to use them. There are much more packages and scripts available for Zeek in the wild. You can try ready or third party packages and scripts or learn Zeek scripting language and create new ones.
Flag 1
Investigate the http.pcap file with the zeek-sniffpass module. Investigate the notice.log file. Which username has more module hits?
We first run zeek -Cr http.pcap zeek-sniffpass.
Then we run cat notice.log | zeek-cut msg to see which username has the most alerts logged.
Count the number of occurences of all usernames, the one with the highest is the flag.
Flag 2
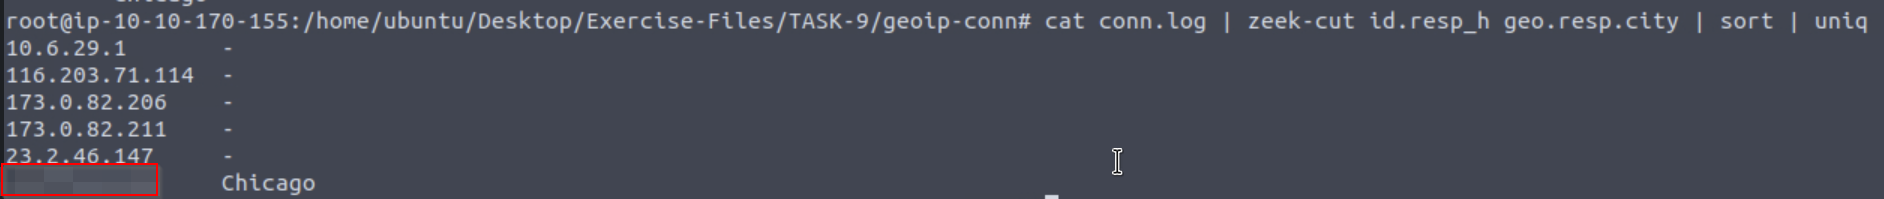
Investigate the case2.pcap file with geoip-conn module. Investigate the conn.log file. What is the name of the identified City?
We start off by running zeek -Cr case2.pcap geoip-conn.
We then cat conn.log | head to view the parameter where the city name is stored. And we see 2 that might be of our interest.
With that in mind, we just run cat conn.log | zeek-cut geo.orig.city geo.resp.city | sort | uniq to get the flag.

Flag 3
Which IP address is associated with the identified City?
To find the associated IP, just run cat conn.log | zeek-cut id.resp_h geo.resp.city | sort | uniq to get the flag.
Flag 4
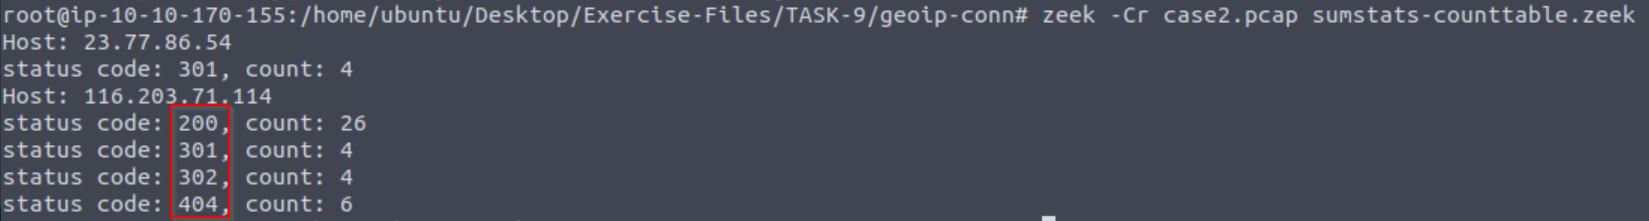
Investigate the case2.pcap file with sumstats-counttable.zeek script. How many types of status codes are there in the given traffic capture?
After ensuring the location of the sumstats-countable.zeek script, we just run zeek -Cr case2.pcap sumstats-counttable.zeek.

The number of error codes displayed will be our flag.