Monitoring MySQL database processes often feels like solving a puzzle in motion. For DBAs, maintaining optimal performance starts with tackling key challenges such as tracking client connections, diagnosing long-running queries, and pinpointing resource bottlenecks. Specific pain points arise when a lack of visibility into active processes causes operational bottlenecks or even downtime.
The SHOW PROCESSLIST Command
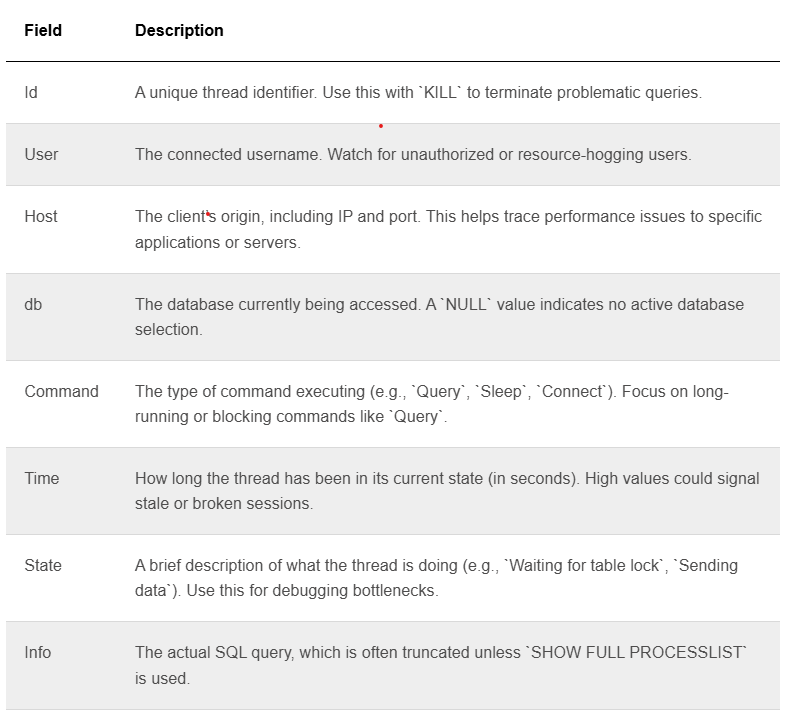
The SHOW PROCESSLIST command in MySQL is a crucial tool for database administrators to monitor active threads and take control of ongoing operations. Executing this command provides a snapshot of all threads currently running on the server, offering insights into each connected client. The syntax is straightforward:
SHOW PROCESSLIST;Alternatively, adding the FULL keyword extends the output by revealing complete query texts that might otherwise be truncated:
SHOW FULL PROCESSLIST;Each row in the SHOW PROCESSLIST output represents an active thread and includes several fields:
Spotting and Diagnosing Slow Queries
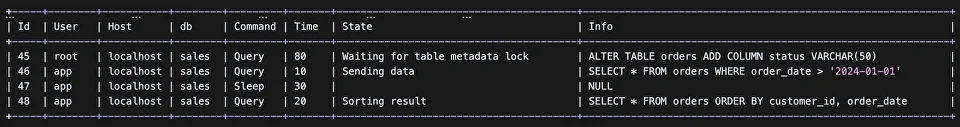
Imagine you need to investigate slow queries. Run the command "SHOW FULL PROCESSLIST":
+----+------+-----------+------+---------+------+---------------+--------------------------------------------------------------+
| Id | User | Host      | db   | Command | Time | State         | Info                                                         |
+----+------+-----------+------+---------+------+---------------+--------------------------------------------------------------+
| 12 | app  | localhost | shop | Query   |  245 | Sorting result| SELECT * FROM orders ORDER BY customer_id, order_date LIMIT 1 |
+----+------+-----------+------+---------+------+---------------+--------------------------------------------------------------+
The row shows an expensive query (Sorting result state, 245 seconds runtime). Evaluate its execution plan and consider adding indexes.
Handling Stuck Queries or Deadlocks
Queries marked as Locked or Waiting for table metadata lock in the State column suggest potential deadlocks or contention issues.
Use the KILL command to terminate problematic threads carefully:
KILL 45; -- Terminates the thread with Id 45Afterward, examine transaction logs or use SHOW ENGINE INNODB STATUS for further troubleshooting.
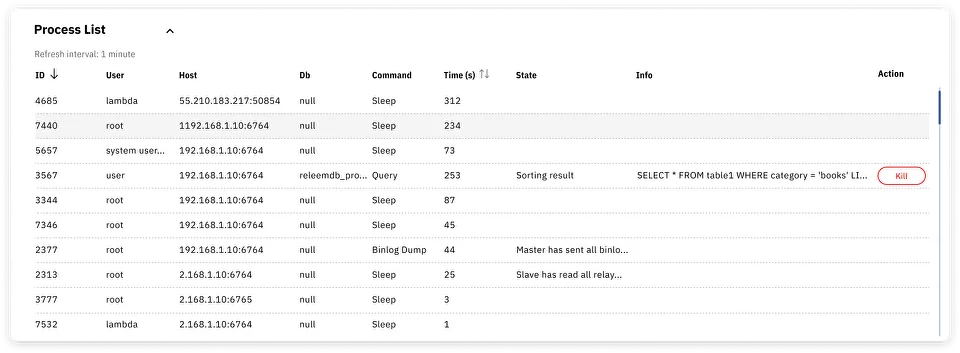
Using Releem for MySQL Process Monitoring
Experienced DBAs understand the value of real-time insights into MySQL processes, especially when troubleshooting long-running queries or tuning database performance. Releem’s Dashboard eliminates the need for manual SSH access, providing a centralized, user-friendly interface for monitoring and optimizing operations.
For example, using Releem’s process monitoring feature, DBAs can instantly view the MySQL process list with detailed metrics like query execution time, resource utilization, and session-specific activity.