The primary objective of a Chaos Experiment is to uncover hidden bugs, weaknesses, or non-obvious points of failure in a system that could lead to significant outages, degradation of service, or system failure under unpredictable real-world conditions.
What is a Chaos Experiment?
A Chaos Experiment is a carefully designed, controlled, and monitored process that systematically introduces disturbances or abnormalities into a system’s operation to observe and understand its response to such conditions.
It forms the core part of ‘Chaos Engineering’, which is predicated on the idea that ‘the best way to understand system behavior is by observing it under stress.’ This means intentionally injecting faults into a system in production or simulated environments to test its reliability and resilience.
This practice emerged from the understanding that systems, especially distributed systems, are inherently complex and unpredictable due to their numerous interactions and dependencies.
The Components of a Chaos Engineering Experiment
Hypothesis Formation. At the initial stage, a hypothesis is formed about the system’s steady-state behavior and expected resilience against certain types of disturbances. This hypothesis predicts no significant deviation in the system’s steady state as a result of the experiment.
Variable Introduction. This involves injecting specific variables or conditions that simulate real-world disturbances (such as network latency, server failures, or resource depletion). These variables are introduced in a controlled manner to avoid unnecessary risk.
Scope and Safety. The experiment’s scope is clearly defined to limit its impact, often called the “blast radius.” Safety mechanisms, such as automatic rollback or kill switches, are implemented to halt the experiment if unexpected negative effects are observed.
Observation and Data Collection. Throughout the experiment, system performance and behavior are closely monitored using detailed logging, metrics, and observability tools. This data collection is critical for analyzing the system’s response to the introduced variables.
Analysis and Learning. After the experiment, the data is analyzed to determine whether the hypothesis was correct. This analysis extracts insights regarding the system’s vulnerabilities, resilience, and performance under stress.
Iterative Improvement. The findings from each chaos experiment inform adjustments in system design, architecture, or operational practices. These adjustments aim to mitigate identified weaknesses and enhance overall resilience.
💡 Note → The ultimate goal is not to break things randomly but to uncover systemic weaknesses to improve the system’s resilience. By introducing chaos, you can enhance the understanding of your systems, leading to higher availability, reliability, and a better user experience.
Types of Chaos Experiments
1. Dependency Failure Experiment
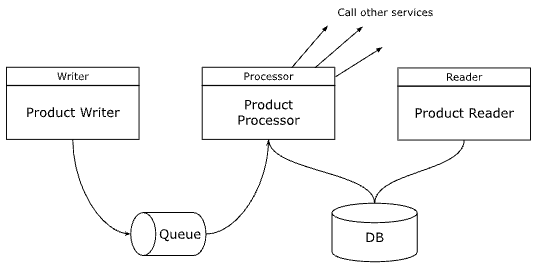
Objective: To assess how microservices behave when one or more of their dependencies fail. In a microservices architecture, services are designed to perform small tasks and often rely on other services to fulfill a request. The failure of these external dependencies can lead to cascading failures across the system, resulting in degraded performance or system outages. Understanding how these failures impact the overall system is crucial for building resilient services.
Possible Experiments
Network Latency and Packet Loss. Simulate increased latency or packet loss to understand its impact on service response times and throughput.
Service Downtime. Emulate the unavailability of a critical service to observe the system’s resilience and failure modes.
Database Connectivity Issues. Introduce connection failures or read/write delays to assess the robustness of data access patterns and caching mechanisms.
Third-party API Limiting. Mimic rate limiting or downtime of third-party APIs to evaluate external dependency management and error handling.
How to Run a Dependency Failure Experiment
Map Out Dependencies.
Begin with a comprehensive inventory of all the external services your system interacts with. This includes databases, third-party APIs, cloud services, and internal services if you work in a microservices architecture.
For each dependency, document how your system interacts with it. Note the data exchanged, request frequency, and criticality of each interaction to your system’s operations.
Rank these dependencies based on their importance to your system’s core functionalities. This will help you focus your efforts on the most critical dependencies first.
Simulate Failures
Use service virtualization or proxy tools like SteadyBit to simulate various failures for your dependencies. These can range from network latency, dropped connections, and timeouts to complete unavailability.
For each dependency, configure the types of faults you want to introduce. This could include delays, error rates, or bandwidth restrictions, mimicking real-world issues that could occur.
Start with less severe faults (like increased latency) and gradually move to more severe conditions (like complete downtime), observing the system’s behavior at each stage.
Test Microservices Isolation
Implement Resilience Patterns. Use libraries like Hystrix, resilience4j, or Spring Cloud Circuit Breaker to implement patterns that prevent failures from cascading across services. This includes:
Bulkheads. Isolate parts of the application into “compartments” to prevent failures in one area from overwhelming others.
Circuit Breakers. Automatically, “cut off” calls to a dependency if it’s detected as down, allowing it to recover without being overwhelmed by constant requests.
Carefully configure thresholds and timeouts for these patterns. This includes setting the appropriate parameters for circuit breakers to trip and recover and defining bulkheads to isolate services effectively.
Monitor Inter-Service Communication
Utilize monitoring solutions like Prometheus, Grafana, or Datadog to monitor how services communicate under normal and failure conditions. Service meshes like Istio or Linkerd can provide detailed insights without changing your application code.
Focus on metrics like request success rates, latency, throughput, and error rates. These metrics will help you understand the impact of dependency failures on your system’s performance and reliability.
💡 Recommendation → Monitoring in real-time allows you to quickly identify and respond to unexpected behaviors, minimizing the impact on your system.
Analyze Fallback Mechanisms
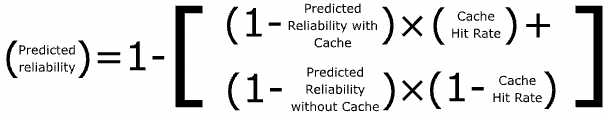
Evaluate the effectiveness of implemented fallback mechanisms. This includes static responses, cache usage, default values, or switching to a secondary service if the primary is unavailable.
Assess if the ‘retry logic’ is appropriately configured. This includes evaluating the retry intervals, backoff strategies, and the maximum number of attempts to prevent overwhelming a failing service.
Ensure that fallback mechanisms enable your system to operate in a degraded mode rather than failing outright. This helps maintain a service level even when dependencies are experiencing issues.
2. Resource Manipulation Experiment
Objective: To understand how a system behaves when subjected to unusual or extreme resource constraints, such as CPU, memory, disk I/O, and network bandwidth. The aim is to identify potential bottlenecks and ensure that the system can handle unexpected spikes in demand without significantly degrading service.
Possible Experiments
CPU Saturation. Increase CPU usage gradually to see how the system prioritizes tasks and whether essential services remain available.
Memory Consumption. Simulate memory leaks or high memory demands to test the system’s handling of low memory conditions.
Disk I/O and Space Exhaustion. Increase disk read/write operations or fill up disk space to observe how the system copes with disk I/O bottlenecks and space limitations.
How to Run a Resource Manipulation Experiment
Define Resource Limits
Start by monitoring your system under normal operating conditions to establish a baseline for CPU, memory, disk I/O, and network bandwidth usage.
Based on historical data and performance metrics, define the normal operating range for each critical resource. This will help you identify when the system is under stress, or resource usage is abnormally high during the experiment.
Check and Verify the Break-Even Point
Understand your system’s maximum capacity before it requires scaling. This involves testing the system under gradually increasing load to identify the point at which performance starts to degrade, and additional resources are needed.
If you’re using auto-scaling (either in the cloud or on-premises), clearly define and verify the rules for adding new instances or allocating resources. This includes setting CPU, memory usage thresholds, and other metrics that trigger scaling actions.
Use load testing tools like JMeter, Gatling, or Locust to simulate demand spikes and verify that your auto-scaling rules work as expected. This will ensure that your system can handle real-world traffic patterns.
Select Manipulation Tool
While Stress and Stress-ng are powerful for generating CPU, memory, and I/O load on Linux systems, they might not be easy to use across distributed or containerized environments. Tools like Steadybit offer more user-friendly interfaces for various environments, including microservices and cloud-native applications.
💡 Pro Tip → Ensure that the tool you select can accurately simulate the types of resource manipulation you’re interested in, whether it’s exhausting CPU cycles, filling up memory, saturating disk I/O, or hogging network bandwidth.
Apply Changes Gradually
Start by applying small changes to resource consumption and monitor the system’s response.
Monitor system performance carefully to identify the thresholds at which performance degrades or fails. This will help you understand the system’s resilience and where improvements are needed.
Monitor System Performance
- Use comprehensive monitoring solutions to track the impact of resource manipulation on system performance. Look for changes in response times, throughput, error rates, and system resource utilization.
💡 Pro Tip → Platforms like Steadybit can integrate with monitoring tools to provide a unified view of how resource constraints affect system health, making it easier to correlate actions with outcomes.
Evaluate Resilience
Analyze how effectively your system scales up resources in response to the induced stress. This includes evaluating the timeliness of scaling actions and whether the added resources alleviate the performance issues.
Evaluate the efficiency of your resource allocation algorithms. This involves assessing whether resources are being utilized optimally and whether unnecessary wastage or contention exists.
Test the robustness of your failover and redundancy mechanisms under ‘conditions of resource scarcity’. This can include switching to standby systems, redistributing load among available resources, or degrading service gracefully.
3. Network Disruption Experiment
Objective: To simulate various network conditions that can affect a system’s operations, such as outages, DNS failures, or limited network access. By introducing these disruptions, the experiment seeks to understand how a system responds and adapts to network unreliability, ensuring critical applications can withstand and recover from real-world network issues.
Possible Experiments
DNS Failures. Introduce DNS resolution issues to evaluate the system’s reliance on DNS and its ability to use fallback DNS services.
Latency Injection. Introduce artificial delay in the network to simulate high-latency conditions, affecting the communication between services or components.
Packet Loss Simulation. Simulate the loss of data packets in the network to test how well the system handles data transmission errors and retries.
Bandwidth Throttling. Limit the network bandwidth available to the application, simulating congestion conditions or degraded network services.
Connection Drops. Forcing abrupt disconnections or intermittent connectivity to test session persistence and reconnection strategies.
How to Run a Network Disruption Experiment
Identify Network Paths
Start by mapping out your network’s topology, including routers, switches, gateways, and the connections between different segments. Tools like Nmap or network diagram software can help visualize your network’s structure.
Focus on identifying the critical paths data takes when traveling through your system. These include paths between microservices, external APIs, databases, and the Internet.
Document these paths and prioritize them based on their importance to your system’s operation. This will help you decide where to start with your network disruption experiments.
Choose Disruption Type
Decide on the type of network disruption to simulate. Options include:
complete network outages,
latency (delays in data transmission)
packet loss (data packets being lost during transmission)
bandwidth limitations
Next, choose disruptions based on their likelihood and potential impact on your system.
For example, simulating latency and packet loss might be particularly relevant if your system is distributed across multiple geographic locations.
Use Network Chaos Tools
Traffic Control (TC). The ‘tc’ command in Linux is a powerful tool for controlling network traffic. It allows you to introduce delays, packet loss, and bandwidth restrictions on your network interfaces.
⚠️ Note → Simulating DNS failures can be complex but is crucial for understanding how your system reacts to DNS resolution issues. Consider using specialized tools or features for this purpose.
On the flip side, chaos experiment solutions like Steadybit provide user-friendly interfaces for simulating network disruptions. For example, you get safety features like built-in rollback strategies to minimize the risk of long-term impact on your system.
Monitor Connectivity and Throughput
During the experiment, use network monitoring tools and observability platforms to track connectivity and throughput metrics in real time.
Focus on monitoring packet loss rates, latency, bandwidth usage, and error rates to assess the impact of the network disruptions you’re simulating.
Assess Failover and Recovery
Evaluate how well your system’s failover mechanisms respond to network disruptions. For example, you could switch to a redundant network path, use a different DNS server, or take other predefined recovery actions.
Measure the time it takes for the system to detect and recover the issue. This includes the time it takes to failover and return to normal operations after the disruption ends.
💡 Recommended → Analyze the overall resilience of your system to network instability. This assessment should include how well services degrade (if at all) and how quickly and effectively they recover once normal conditions are restored.
If you want to read more, you can check out the rest of the post about principles of chaos engineering and popular tools here.