This article was co-authored by @mjgnzls (Jhaye Marie Gonzales)
INTRODUCTION
Have you ever wondered how YouTube knows what you’ll want to watch next? Or how online shopping apps know exactly what you would want to buy? These are all made possible because of data–more specifically, data analysis. Better decisions and more intelligent systems are made possible by statistical analysis, which uncovers patterns in data. Luckily, we have R, a powerful programming language designed for statistical computation, and RStudio, its user-friendly and intuitive workspace, which greatly simplifies the process of learning and using data analysis.
WHAT IS R?
For starters, R is a free, open-source programming language and software environment specifically designed for statistical computing, data analysis, and graphical visualization. Developed in the 1990s by Ross Ihaka and Robert Gentleman, R has grown into one of the most widely used tools in data science, academic research, and industry analytics. But Why Use R? The language itself is designed specifically for statistical analysis offering a beginner-friendly syntax and packages that makes it ideal for tasks that include data modeling, cleaning and graphing.
WHAT IS RSTUDIO?
RStudio is a powerful and user-friendly Integrated Development Environment (IDE) made specifically for working with R. When using R, it serves as a workspace, which greatly improves the efficiency and ease of writing, testing, and visualizing code. Whether you’re developing statistical models or analyzing data, RStudio offers an organized and user-friendly interface that improves the entire process.
INSTALLATION PROCESS FOR R AND RSTUDIO
To help you get started with R programming, here is a detailed step-by-step process on how to install R and RStudio to your very own devices!
R Installation
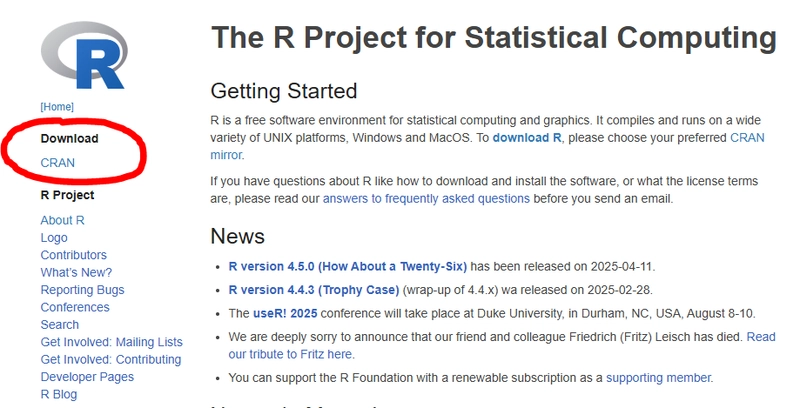
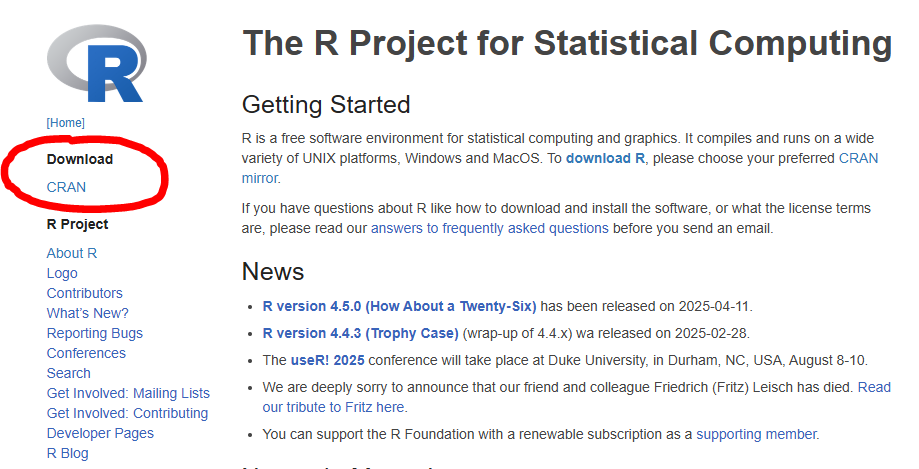
1. Visit the R project via www.r-project.org/ .
2. Click CRAN located under Download.
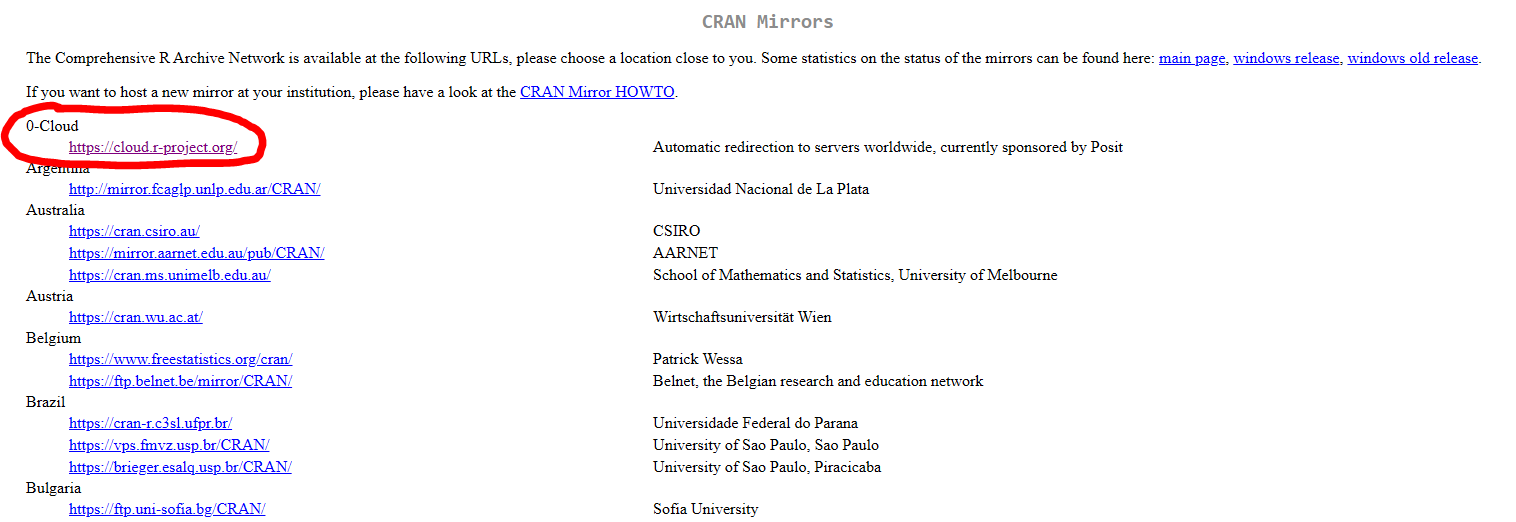
3. Click on https://cloud.r-project.org/ .
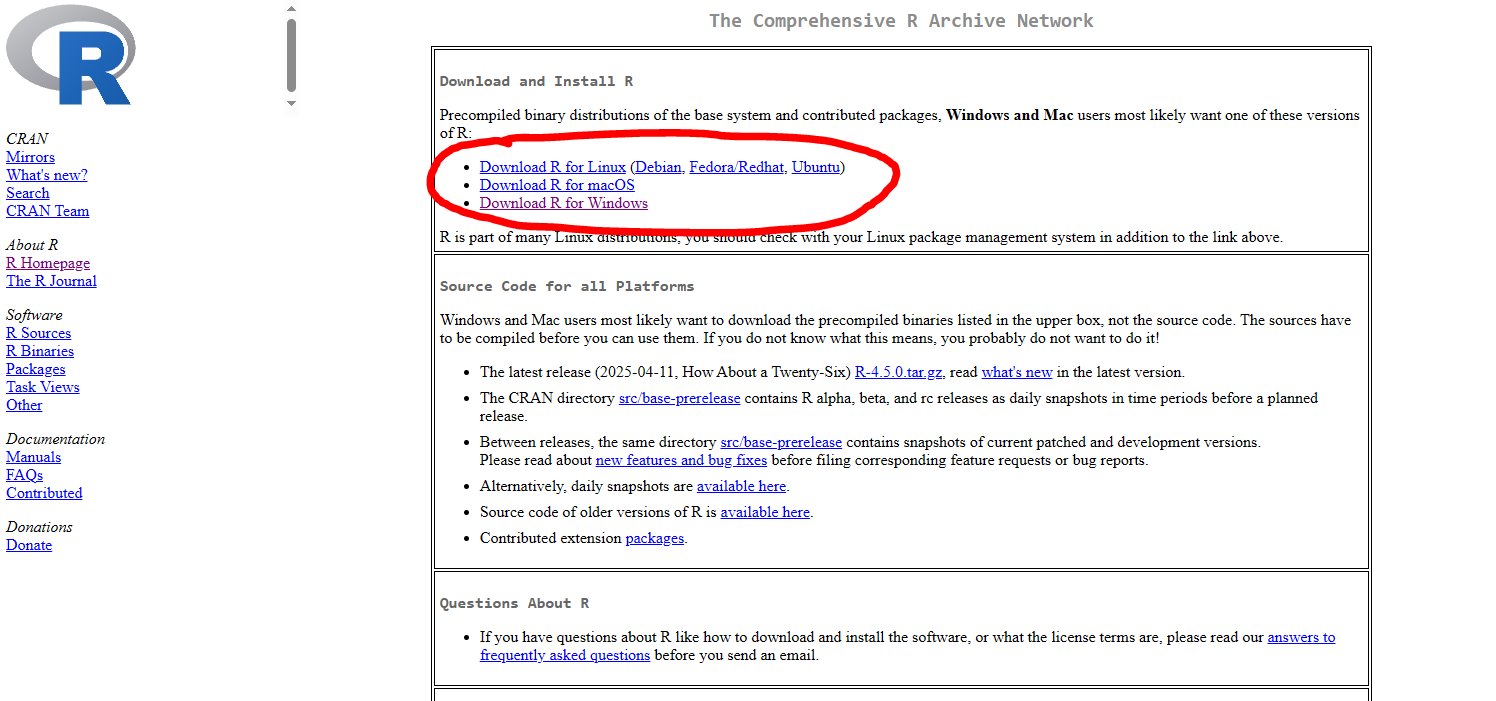
4. Under Download and Install R, choose what operating system you are currently using.
5. Run the .exe setup file and wait for the installation process to finish.
RStudio Installation
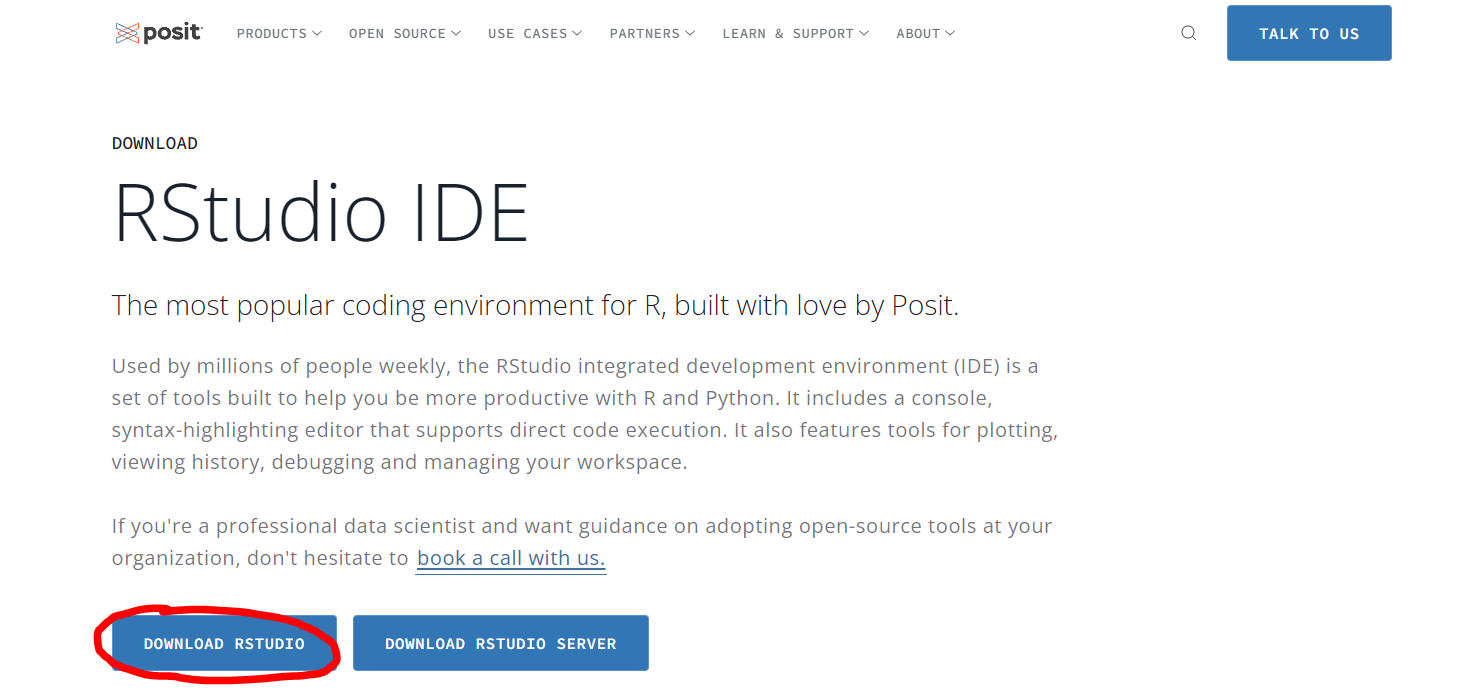
1. Visit Posit via https://posit.co/downloads/ .
2. Click Download RStudio.
3. Scroll down until you see the download list.
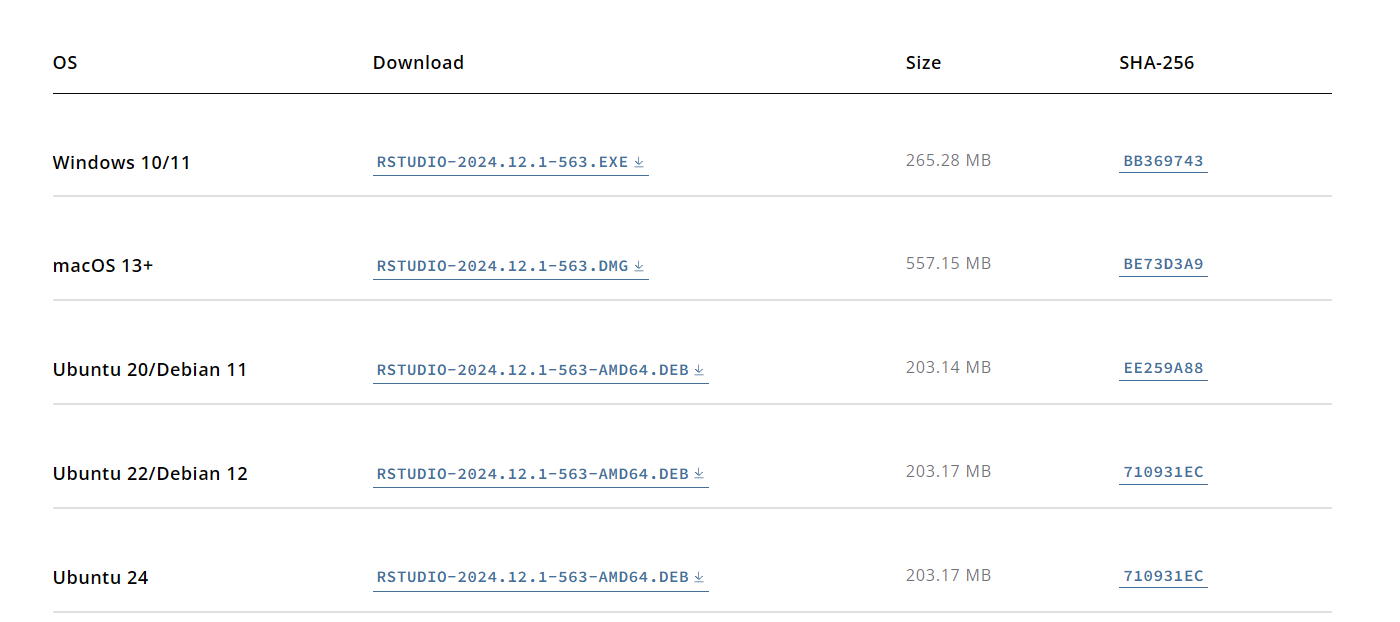
4. Click the download for your operating system. The setup file should automatically start downloading once clicked.
5. Run the .exe setup and wait for the installation process to finish.
RSTUDIO'S WORKSPACE
When installed, this is what your RStudio should look like. Let’s break each one of them down to not get confused.
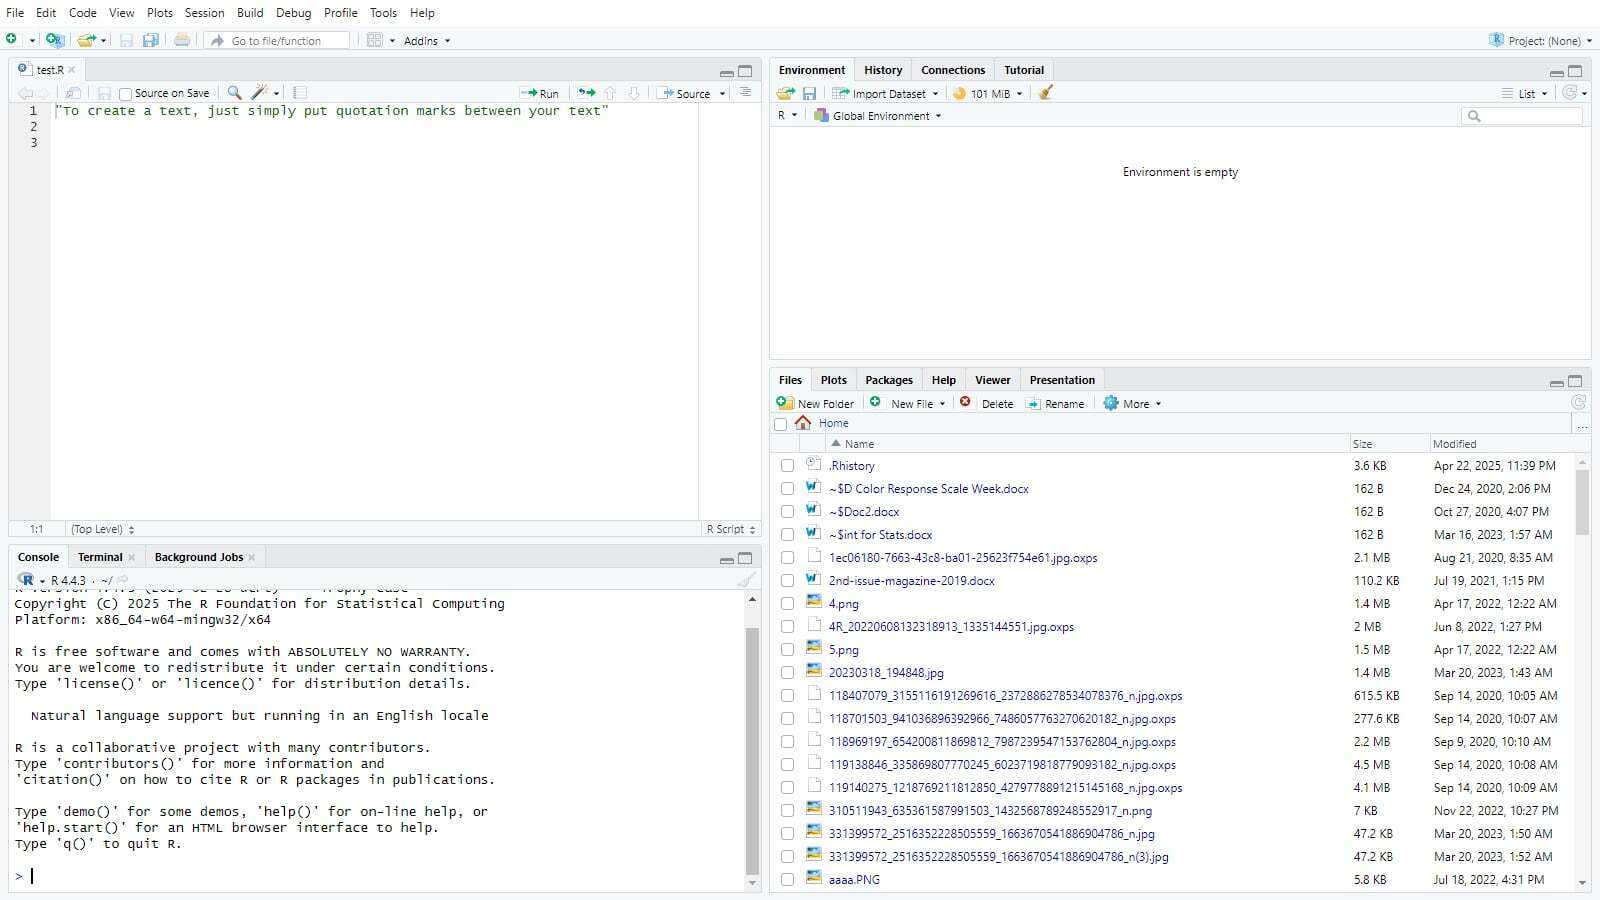
1. Source Editor (Top-Left)
This serves as your coding workspace for writing and editing R scripts, R Markdown files, or Shiny apps, featuring syntax highlighting, code execution shortcuts, and multi-file tab management.
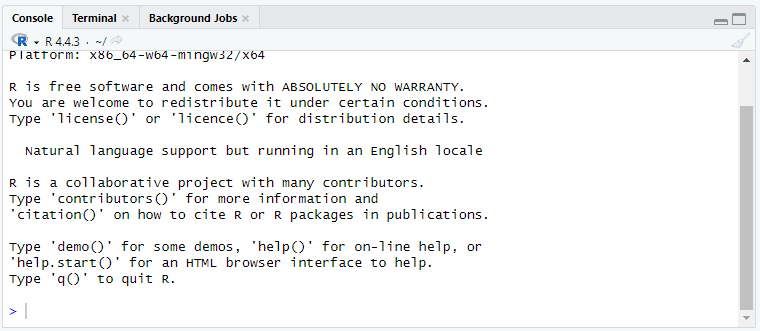
2. Console (Bottom-Left)
The interactive command center where you run R code directly, view immediate results or errors, and use autocompletion for efficiency.
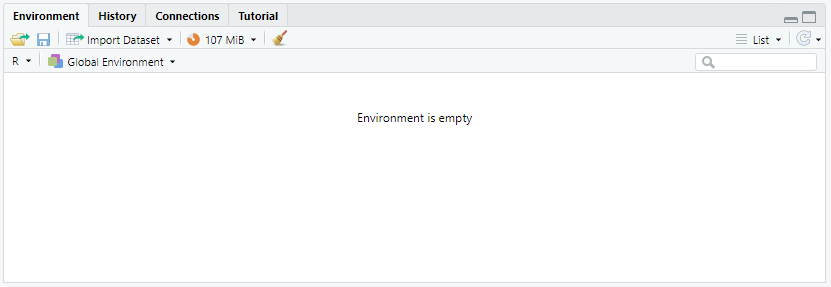
3. Environment and History (Top-Right)
The Environment tab tracks active variables and datasets for quick inspection, while the History tab logs past commands for easy re-execution.
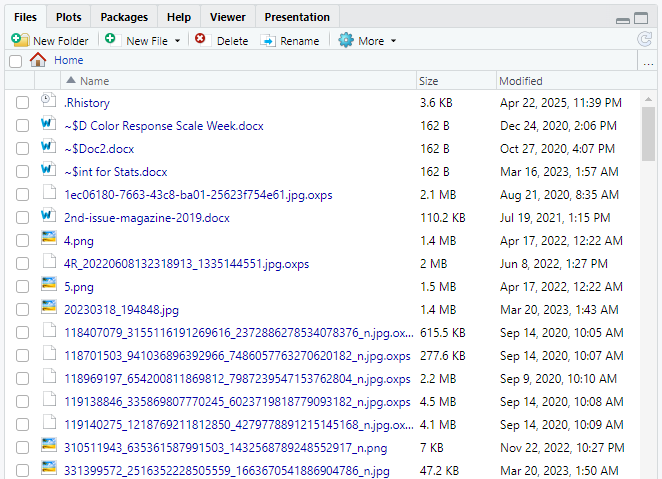
4. Tools (Bottom-Right)
A multi-tool pane for file navigation, plot display, package management, and accessing R’s documentation and tutorials.
BASICS OF R PROGRAMMING
Before diving into the different statistical tools, let's first get to know the basic syntax used in R.
1. Output
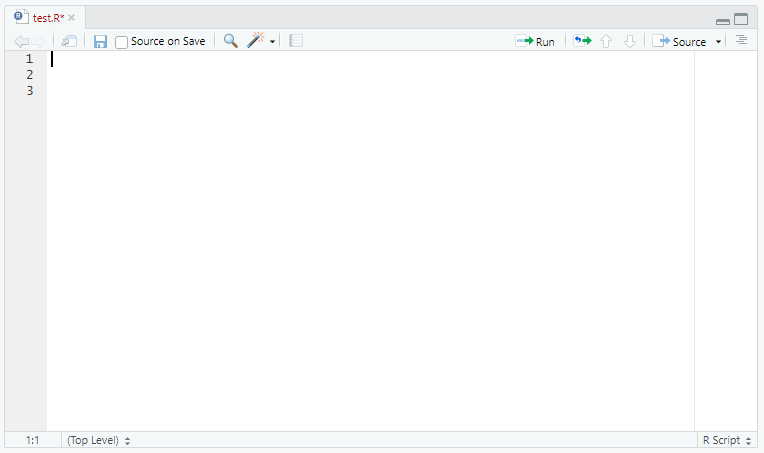
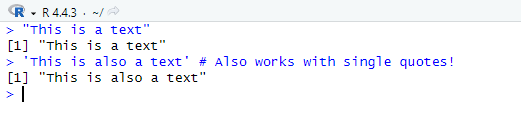
1a. Text
To display text, enclose your text in single or double quotes.
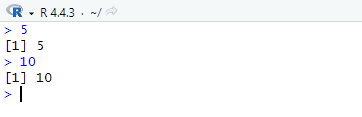
1b. Numbers
To display numbers, simply type them (no quotes needed).
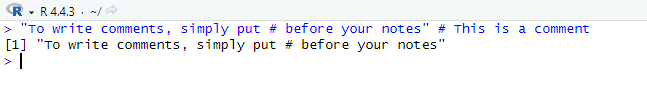
2. Comments
To add comments, add a # before your comment/note. R ignores lines after detecting a hashtag symbol.
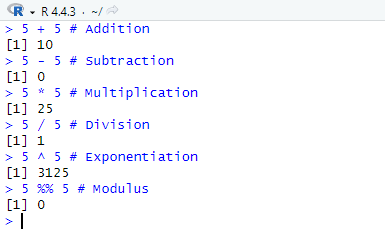
3. Basic Arithmetic Operations
To perform basic arithmetic operations, use standard math operators:
- + (Addition)
- - (Subtraction)
- * (Multiplication)
- / (Division)
- ^ (Exponentiation)
- % (Modulus)
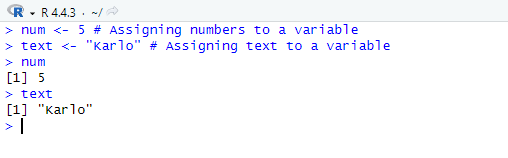
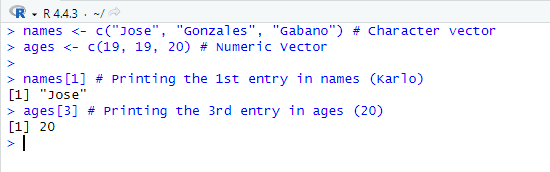
4. Variables and Assignment
To declare and assign values to variables, first type the name of the variable you want to add. Next, assign a value by using <- then typing the value. Remember to use single or double quotes when assigning text to a variable.
5. Vectors
To create a vector, create a variable and assign c() as its value.
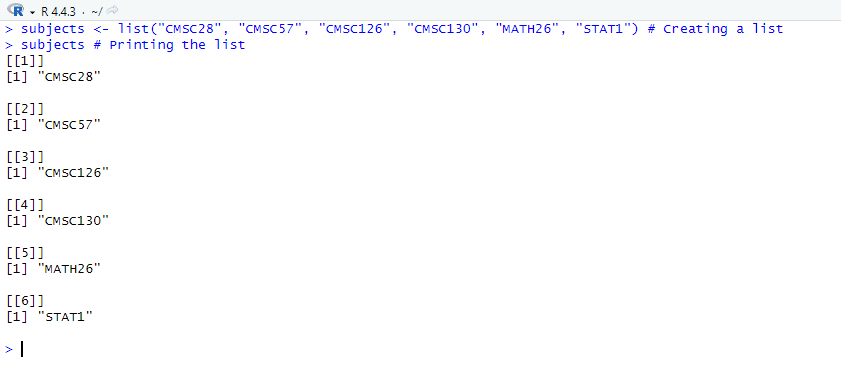
6. Lists
To create a list, create a variable and assign list() as its value. Remember that a list can store mixed data types.
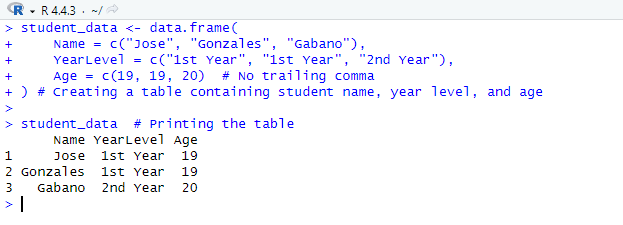
7. Data Frames (tables)
To create tables, create a variable and assign data.frame() as its value.
More information about R’s syntax can be found at https://www.w3schools.com/r/default.asp
R GRAPHICAL TOOLS
Now that we have an idea of R's basic syntax, let's learn how to use R's different graphical tools to help you visualize and present your data.
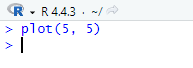
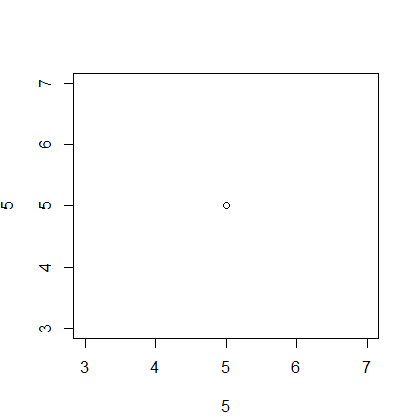
1. Plots
The plot() function in R is a tool for creating visualizations of data. It automatically generates different types of plots depending on the input data type, making it a quick and easy way to explore relationships, trends, and distributions.
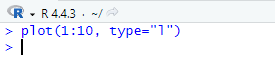
2. Lines
To create a line, we can modify our plot() function with type=l which adds connected line segments to an existing plot in R. Doing so does not create a new graph but modifies an active one.
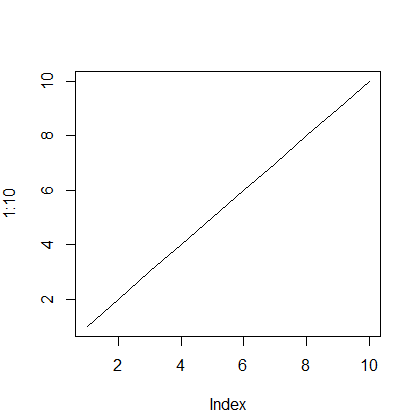
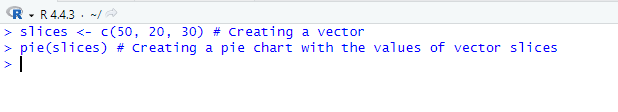
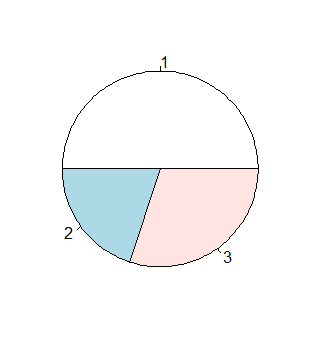
3. Pie Chart
The pie() function creates a pie chart, which divides a circle into slices to represent proportions of a whole.
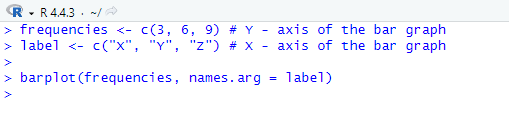
4. Bar Graph
The barplot() function creates rectangular bars to represent categorical data, where heights/lengths correspond to values. It's more precise than pie charts for comparing quantities.
R STATISTICAL ANALYSIS TOOLS
For this portion of the article, we will be using a built-in dataset within R which is “airquality”, a data set which contains records of New York’s air quality levels. If you want to test these statistical analysis tools/functions for yourself, here are other available built-in datasets within R:
- mtcars: a data set which contains fuel efficiency and several performance metrics for 32 automobiles.
- iris: a data set which contains measurements of the length and width for 50 flowers each from three Iris species.
- ToothGrowth: a dataset which contains experimental data measuring the effect of vitamin C supplementation delivered either via orange juice or ascorbic acid on tooth growth in 60 Guinea pigs.
- USArrests: a data set contains statistics about violent crime rates by the US state.
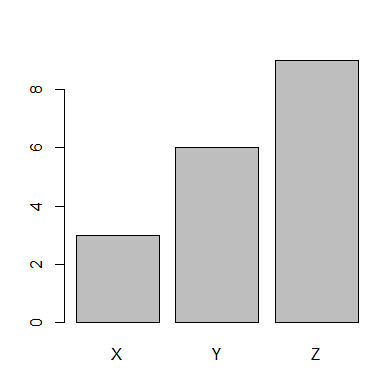
1. Minimum and Maximum Values
To get the minimum and maximum values of a data set, we can use the built-in math functions min() and max().
2. Mean
The mean is the sum of all values divided by the number of observations, representing the central tendency of a dataset. Doing this manually would be very time consuming, so instead, we can quickly get the mean value by using the built-in function mean().

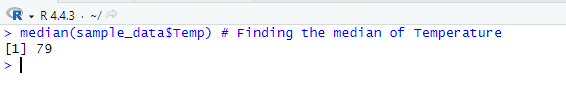
3. Median
The median is the middle value of a dataset when sorted, representing the 50th percentile. In R, you can quickly find the median value by using the built-in function median().
4. Percentiles
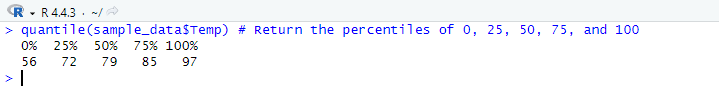
Percentiles divide a dataset into 100 equal parts, helping you understand the distribution of values (e.g., "What value is higher than 25% of the data?"). In R, you calculate them using the built-in function quantile().
On default, the quantile() function will return the percentiles of 0, 25, 50, 75, and 100:
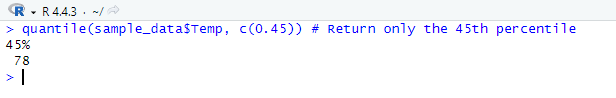
We can utilize the c() function along with the quantile() function to find the desired percentile value:
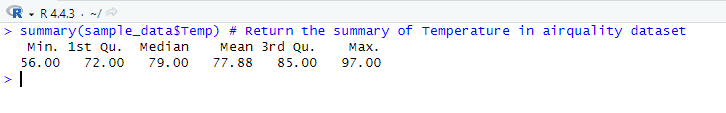
5. Summary
Lastly, we can use the summary() function to display the minimum value, 1st quartile, median, mean, 3rd quartile, and maximum value all at once, respectively.
CONCLUSION
R is a powerful language on its own and when paired with RStudio, they provide a comprehensive and user-friendly environment for performing statistical analysis. When combined, they make data manipulation, visualization and modeling much easier which makes them a great place for beginners to start. In this article we were able to explore what makes R and RStudio essential tools for statistical analysis. R and RStudio offer the versatility and power to make your ideas come to life, whether you're examining data, evaluating patterns, or visualizing relationships. Now that you know the basics, it's time to move on to the next phase. So go ahead and install R and RStudio, and let this guide be your first step into the world of data analysis. Use it as your guide as you begin exploring, experimenting, and unlocking the full potential of R.
REFERENCES
R: What is R? (n.d.). https://www.r-project.org/about.html
Worsley, S. (2023, October 17). What is R? - An Introduction to The Statistical Computing Powerhouse. https://www.datacamp.com/blog/all-about-r
W3Schools.com. (n.d.). https://www.w3schools.com/r/default.asp
R Built-in data sets - Easy Guides - Wiki - STHDA. (n.d.). https://www.sthda.com/english/wiki/r-built-in-data-sets