Recently, I was exploring different ways to animate my charts and realized I didn't fully understand how all this magic works in D3. It’s easy to say “Sure, D3 can animate stuff!”, but it’s another thing to really know what's going on under the hood.
So, I decided to dive deeper, experiment a bit, and came up with this tutorial.
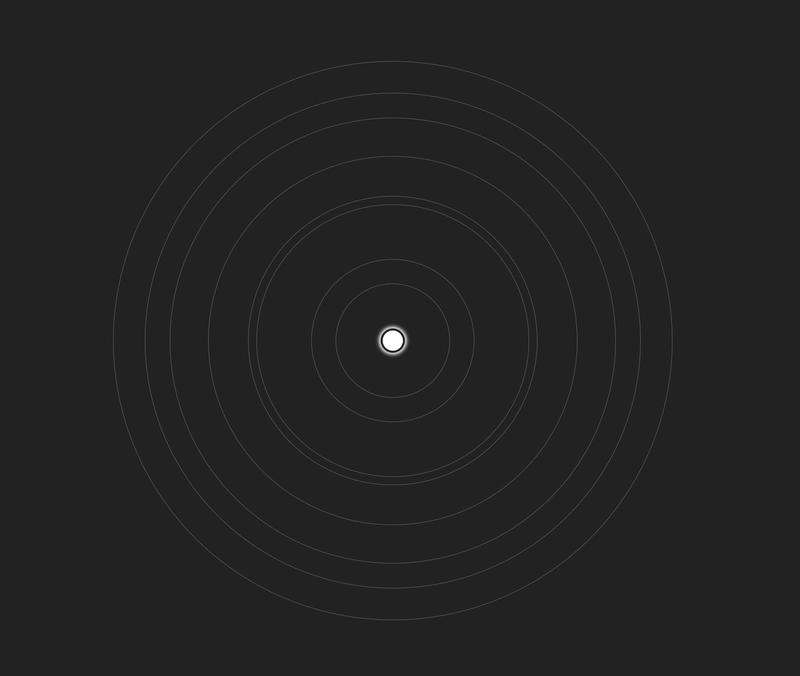
Instead of using typical bar or line charts, I chose to draw something playful (and, yes, slightly off-topic) — a simple planetary system.
🔗 Feel free to skip the explanation if you're only interested in the final result: https://codepen.io/gnykka/pen/EaYzyJz.
I don't want to spend too much time on rendering details, so I'll just show you my basic code with inline comments and then focus on creating smooth animations. Let’s jump in!
</span>


      body {
        display: flex;
        justify-content: center;
        align-items: center;
        width: 100vw;
        height: 100vh;
        margin: 0;
        background: #222;
      }


    <span class="na">src="https://d3js.org/d3.v7.js">


     id="orbit" width="800" height="800">


      // Select the main SVG element
      const svg = d3.select("#orbit");

      // Set up the data with random orbits, radii, and rotation periods
      const center = { x: 400, y: 400 };
      const starRadius = 16;
      const planetsData = [];

      for (let i = 0; i < 8; i++) {
        const orbit = 40 * (i + 1) + Math.random() * 40;
        const radius = 6 + Math.random() * 10;
        const period = radius * 500;

        planetsData.push({ orbit, radius, period });
      }

      // Draw the central star as a blurred white circle
      svg.append("circle")
        .attr("cx", center.x)
        .attr("cy", center.y)
        .attr("r", starRadius)
        .attr("fill", "white")
        .style("filter", "blur(2px)");

      // Add grey orbit paths around the star
      planetsData.forEach(({ orbit }) => {
        svg.append("circle")
          .attr("cx", center.x)
          .attr("cy", center.y)
          .attr("r", orbit)
          .attr("fill", "none")
          .attr("stroke", "#666")
          .attr("stroke-width", 0.5);
      });

      // Create circle elements for each planet
      const planets = svg
        .selectAll(".planet")
        .data(planetsData)
        .enter()
        .append("circle")
        .attr("class", "planet")
        .attr("cx", center.x)
        .attr("cy", center.y)
        .attr("r", d => d.radius)
        .attr("fill", "white")
        .attr("stroke", "#222");


    Enter fullscreen mode


    Exit fullscreen mode


This code is static: the planets aren't moving, and they're all bunched up in the center of screen. I could position each one on its own orbit and animate them manually using a custom requestAnimationFrame function, but that approach feels too complicated. D3 provides its own animation mechanism that uses the same requestAnimationFrame under the hood, but in a more native D3-like way.I'm talking about the transition function. Usually, you see it in simple snippets that change a property from one value to another. For example, this snippet changes the background of the selection:

selection
  .transition()
  .style("background-color", "red");


    Enter fullscreen mode


    Exit fullscreen mode


In its simplest form, a transition changes the property from the old value to the new one in one go. I have a more complex case here: I need to change element positions — two properties at once — and calculate them based on their angle.That’s where the special tween function comes into play. You can apply it to any transition to customize how properties are interpolated. The tween function should return another function that receives the eased time as an argument. That inner function is run every frame of the transition and updates the selection.Now, let’s jump into writing a custom tween. I’ll start with a simple draft for transitioning all the planets:

function startOrbit(selection, d) {
  selection
    .transition();
}

planets.each(function(d) {
  startOrbit(d3.select(this), d);
});


    Enter fullscreen mode


    Exit fullscreen mode


To make the transition smooth, each planet should complete a full orbit over the transition's duration. I'll create an interpolator that maps the eased time to the angle range [0, 2𝜋] and calculates coordinates from this angle:

selection
  // Start the treansition
  .transition()
  // Attach a custom tween named "orbit"
  .tween("orbit", function() {
    // Select the planet element (the current DOM node)
    const planet = d3.select(this);

    // Create an interpolator that goes from 0 to 2π (a full orbit)
    const angleInterpolate = d3.interpolateNumber(0, 2 * Math.PI);

    // Return the function that will run each frame of the transition
    return function(t) {
      // Calculate the current angle for this frame
      const angle = angleInterpolate(t);

      // Determine the planet's x and y based on its orbit radius
      const x = center.x + d.orbit * Math.cos(angle);
      const y = center.y + d.orbit * Math.sin(angle);

      // Update the planet's position
      planet.attr("cx", x).attr("cy", y);
    };
  })
  // When the transition ends, call startOrbit again to keep it looping
  .on("end", () => startOrbit(selection, d));


    Enter fullscreen mode


    Exit fullscreen mode


Here is my result. Weird, huh?  The planets are moving too fast because I didn't set the animation duration. By default, the transition lasts 250 milliseconds, so let’s replace it with each planet’s period:

selection
  .transition()
  .duration(d.period)
  ...


    Enter fullscreen mode


    Exit fullscreen mode


Better, right? But now I see the easing is off. That’s because the default easing function is easeCubic. I need easeLinear instead:

selection
  .transition()
  .duration(d.period)
  .ease(d3.easeLinear)
  ...


    Enter fullscreen mode


    Exit fullscreen mode


With this last change the planets finally move as I expect them to move. I can also change any of their other properties on every frame of the transition however I like. For instance, let’s give them some color. First, I’ll create a color scale that maps the angle range [0, 2𝜋] to the interpolateSinebow palette:

const colorScale = d3.scaleSequential()
  .domain([0, 2 * Math.PI])
  .interpolator(d3.interpolateSinebow);


    Enter fullscreen mode


    Exit fullscreen mode


Then I can apply it in my tween function like this:

planet.attr("fill", colorScale(angle));


    Enter fullscreen mode


    Exit fullscreen mode


My final result: And that's it!You can find the fully commented example on my Codepen: https://codepen.io/gnykka/pen/EaYzyJzThanks for reading and happy coding! 👾