A Step-by-Step Guide to Creating Interactive Polls with Chart.js
🌟 Introduction
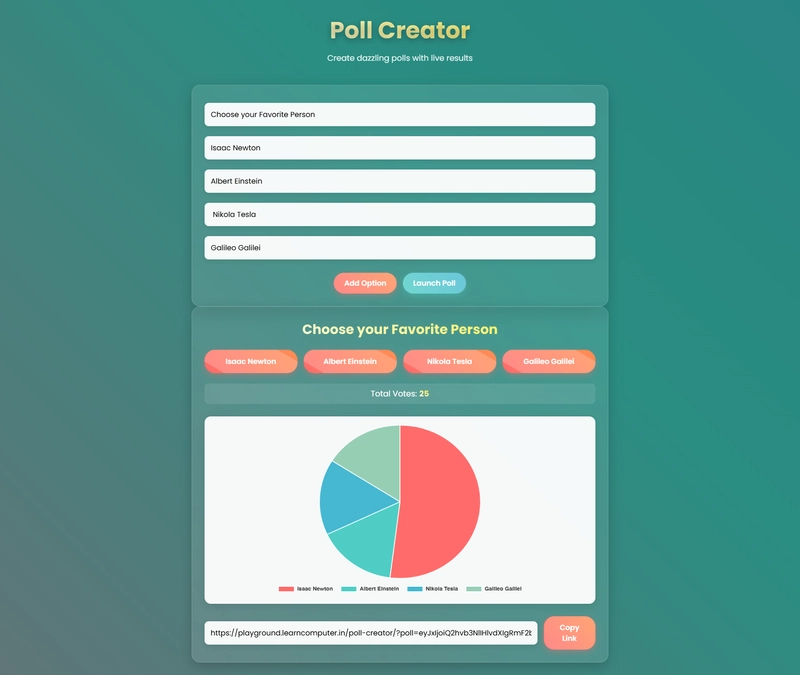
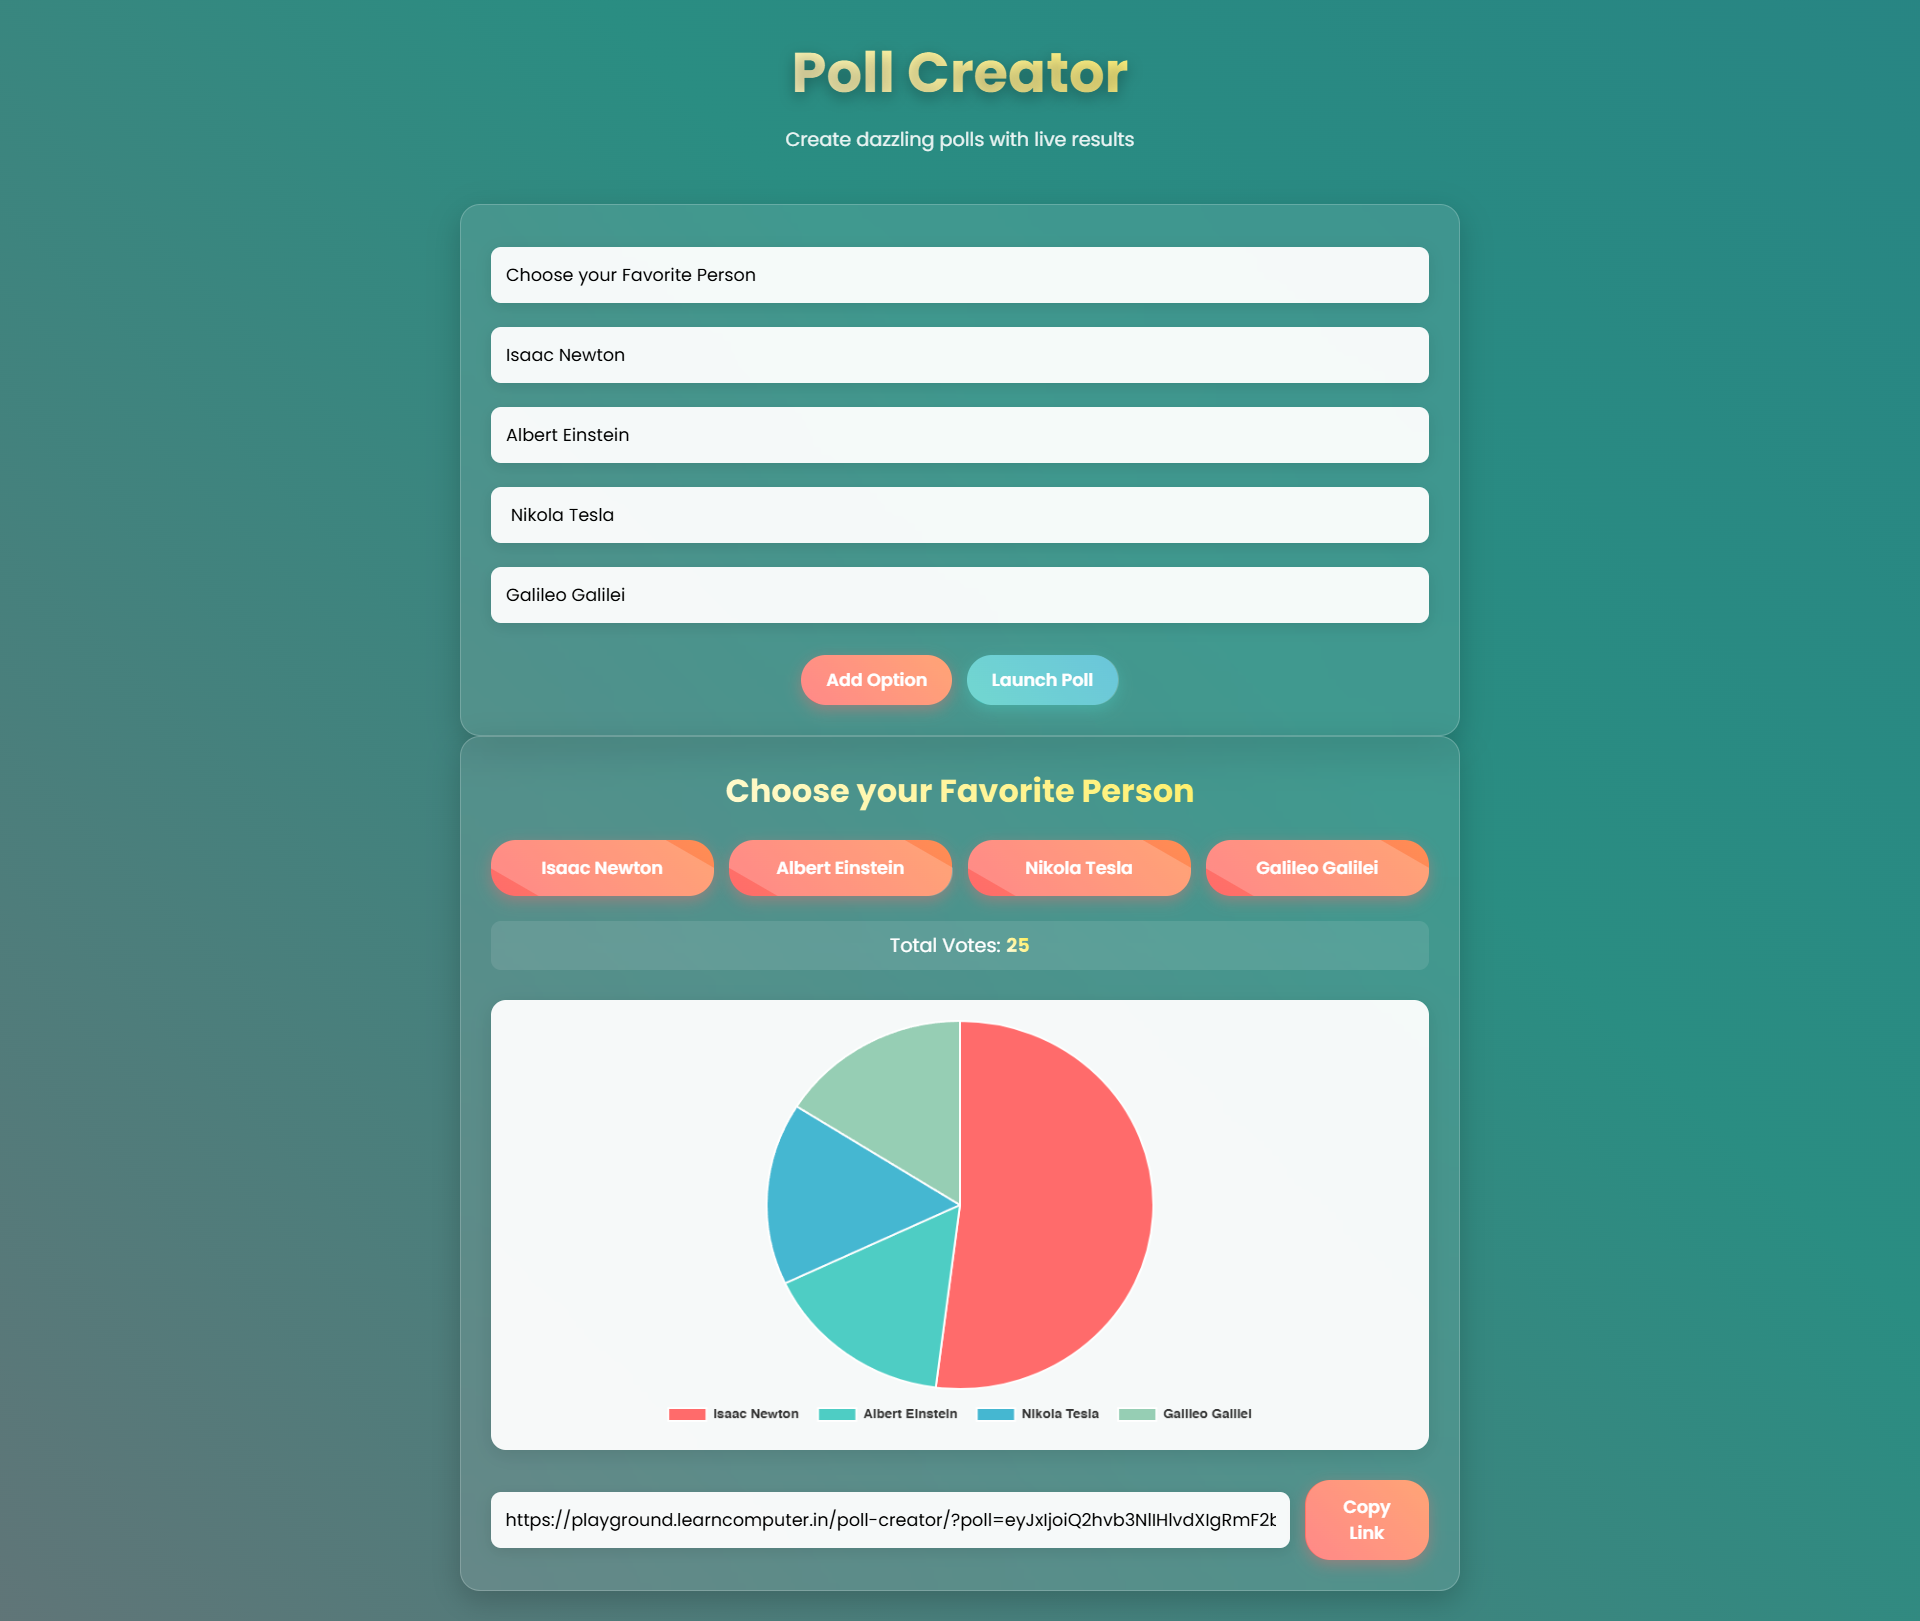
Have you ever wanted to create live polls where results update instantly like magic? In this 2,000+ word guide, we'll build a professional poll creator from scratch that:
✅ Updates charts in real-time
✅ Generates shareable links
✅ Shows beautiful percentage visualizations
✅ Works entirely in your browser
No backend needed! Perfect for event organizers, teachers, or anyone who needs quick audience feedback. You can checkout the final app here - https://playground.learncomputer.in/poll-creator/
🎯 What We'll Build
Here's the feature breakdown:
Core Features
-
Poll Creation Interface
- Question input field
- Dynamic option inputs (add/remove)
- Launch button
-
Real-Time Visualization
- Interactive pie chart (Chart.js)
- Percentage labels on buttons
- Total vote counter
-
Sharing System
- Unique URL generator
- Copy-to-clipboard functionality
-
Visual Enhancements
- Smooth animations
- Glassmorphism design
- Mobile-responsive layout
🛠️ Prerequisites
Before we start, you should know:
| Skill Level | Requirements |
|---|---|
| HTML | Basic tags, inputs, divs |
| CSS | Flexbox, animations |
| JavaScript | DOM manipulation, event listeners |
Tools Needed:
- Code editor (VS Code recommended)
- Modern web browser
- Internet connection (for CDN resources)
📂 Project Structure
Create these 3 files:
project-folder/
├── index.html    --> Main structure
├── styles.css    --> Styling rules
└── script.js     --> Functionality & logic
🏗️ HTML Structure (The Skeleton)
</span>
 lang="en">

     charset="UTF-8">
     name="viewport" content="width=device-width, initial-scale=1.0">
    Poll Creator - Real Time Results
     rel="stylesheet" href="styles.css">
    <span class="na">src="https://cdn.jsdelivr.net/npm/chart.js">


     class="container">
         class="fancy-header">
            Poll Creator
            Create dazzling polls with live results


         class="poll-creator">
             class="create-section glass-card">
                 type="text" id="pollQuestion" class="fancy-input" placeholder="What's your brilliant question?">
                 class="options-container" id="optionsContainer">
                     type="text" class="option-input fancy-input" placeholder="Option 1">
                     type="text" class="option-input fancy-input" placeholder="Option 2">

                 class="button-group">
                     id="addOption" class="fancy-btn">Add Option
                     id="createPoll" class="fancy-btn primary">Launch Poll


             class="results-section glass-card" id="resultsSection">
                 id="activeQuestion" class="question-title">
                 class="vote-buttons" id="voteButtons">
                 class="total-votes">Total Votes:  id="totalVotes">0
                 id="resultsChart" class="chart-canvas">
                 class="share-link">
                     type="text" id="shareLink" class="fancy-input" readonly>
                     id="copyLink" class="fancy-btn">Copy Link


    <span class="na">src="script.js">


    Enter fullscreen mode


    Exit fullscreen mode


  Key Components Explained:


Head Section


Chart.js CDN import

Viewport meta tag for responsiveness


Body Structure


    class="create-section">


    class="results-section">


    Enter fullscreen mode


    Exit fullscreen mode


Important Elements


#pollQuestion: Where users type their question


#optionsContainer: Holds dynamic option inputs


#resultsChart: Chart.js canvas element


  🎨 CSS Styling (The Visual Magic)

* {
    margin: 0;
    padding: 0;
    box-sizing: border-box;
    font-family: 'Poppins', sans-serif;
}

body {
    background: linear-gradient(45deg, #d64161, #2a8d82, #1e6388); /* Darker gradient */
    background-size: 400% 400%;
    animation: gradientBG 15s ease infinite;
    min-height: 100vh;
    padding: 30px;
}

@keyframes gradientBG {
    0% { background-position: 0% 50%; }
    50% { background-position: 100% 50%; }
    100% { background-position: 0% 50%; }
}

.container {
    max-width: 1000px;
    margin: 0 auto;
}

.fancy-header {
    text-align: center;
    margin-bottom: 50px;
    animation: float 3s ease-in-out infinite;
}

h1 {
    font-size: 3.5em;
    color: #fff;
    text-shadow: 0 5px 15px rgba(0, 0, 0, 0.3);
    background: linear-gradient(45deg, #fff, #ffeb3b);
    -webkit-background-clip: text;
    -webkit-text-fill-color: transparent;
}

.fancy-header p {
    color: rgba(255, 255, 255, 0.9);
    font-size: 1.2em;
    margin-top: 10px;
}

.glass-card {
    background: rgba(255, 255, 255, 0.1);
    border-radius: 20px;
    padding: 30px;
    backdrop-filter: blur(15px);
    border: 1px solid rgba(255, 255, 255, 0.2);
    box-shadow: 0 10px 30px rgba(0, 0, 0, 0.2);
    transition: transform 0.3s ease;
}

.glass-card:hover {
    transform: translateY(-5px);
}

.fancy-input {
    width: 100%;
    padding: 15px;
    margin: 12px 0;
    border: none;
    border-radius: 10px;
    background: rgba(255, 255, 255, 0.95);
    font-size: 1.1em;
    transition: all 0.3s ease;
    box-shadow: 0 4px 15px rgba(0, 0, 0, 0.1);
}

.fancy-input:focus {
    outline: none;
    box-shadow: 0 0 0 4px rgba(255, 107, 107, 0.4);
    transform: scale(1.02);
}

.button-group {
    display: flex;
    gap: 15px;
    margin-top: 20px;
    justify-content: center;
}

.fancy-btn {
    padding: 12px 25px;
    border: none;
    border-radius: 25px;
    background: linear-gradient(45deg, #ff6b6b, #ff8e53);
    color: white;
    cursor: pointer;
    font-weight: 600;
    font-size: 1.1em;
    transition: all 0.3s ease;
    box-shadow: 0 5px 15px rgba(255, 107, 107, 0.4);
    position: relative;
    overflow: hidden;
}

.fancy-btn.primary {
    background: linear-gradient(45deg, #4ecdc4, #45b7d1);
    box-shadow: 0 5px 15px rgba(78, 205, 196, 0.4);
}

.fancy-btn:hover {
    transform: translateY(-3px);
    box-shadow: 0 8px 25px rgba(255, 107, 107, 0.6);
}

.fancy-btn.primary:hover {
    box-shadow: 0 8px 25px rgba(78, 205, 196, 0.6);
}

.fancy-btn::after {
    content: '';
    position: absolute;
    top: -50%;
    left: -50%;
    width: 200%;
    height: 200%;
    background: rgba(255, 255, 255, 0.2);
    transform: rotate(30deg);
    transition: all 0.5s ease;
}

.fancy-btn:hover::after {
    top: 100%;
    left: 100%;
}

.results-section {
    display: none;
}

.question-title {
    color: #fff;
    font-size: 2em;
    margin-bottom: 20px;
    text-align: center;
    background: linear-gradient(45deg, #fff, #ffeb3b);
    -webkit-background-clip: text;
    -webkit-text-fill-color: transparent;
}

.vote-buttons {
    display: flex;
    flex-wrap: wrap;
    gap: 15px;
    margin: 25px 0;
    justify-content: center;
}

.vote-buttons button {
    flex: 1;
    min-width: 150px;
    padding: 15px;
    position: relative;
}

.vote-buttons button::before {
    content: attr(data-percentage);
    position: absolute;
    top: -20px;
    right: 10px;
    font-size: 0.9em;
    color: #fff;
    background: rgba(0, 0, 0, 0.5);
    padding: 2px 8px;
    border-radius: 10px;
    opacity: 0;
    transition: opacity 0.3s ease;
}

.vote-buttons button:hover::before {
    opacity: 1;
}

.total-votes {
    text-align: center;
    color: #fff;
    font-size: 1.2em;
    margin: 15px 0;
    background: rgba(255, 255, 255, 0.1);
    padding: 10px;
    border-radius: 10px;
}

.total-votes span {
    font-weight: bold;
    background: linear-gradient(45deg, #fff, #ffeb3b);
    -webkit-background-clip: text;
    -webkit-text-fill-color: transparent;
}

.chart-canvas {
    max-height: 450px !important;
    margin: 30px 0;
    border-radius: 15px;
    background: rgba(255, 255, 255, 0.95);
    padding: 20px;
    box-shadow: 0 5px 20px rgba(0, 0, 0, 0.1);
}

.share-link {
    display: flex;
    gap: 15px;
    margin-top: 20px;
}

.share-link input {
    flex-grow: 1;
}

@keyframes float {
    0%, 100% { transform: translateY(0); }
    50% { transform: translateY(-10px); }
}


    Enter fullscreen mode


    Exit fullscreen mode


  Design Breakdown:


  1. Animated Gradient Background

body {
  background: linear-gradient(45deg, #d64161, #2a8d82, #1e6388);
  animation: gradientBG 15s ease infinite;
}


    Enter fullscreen mode


    Exit fullscreen mode


Creates smooth color transitions

Uses CSS keyframe animation


  2. Glassmorphism Effect

.glass-card {
  background: rgba(255, 255, 255, 0.1);
  backdrop-filter: blur(15px);
  border: 1px solid rgba(255, 255, 255, 0.2);
}


    Enter fullscreen mode


    Exit fullscreen mode


Semi-transparent background

Blur effect for frosted glass look


  3. Interactive Elements


Input Fields: Scale up on focus


Buttons: Gradient backgrounds with hover effects


Vote Buttons: Percentage tooltips on hover


  4. Responsive Layout

Flexbox for button groups

Media queries (implicit via Chart.js responsive option)


  ⚙️ JavaScript Logic (The Brain)

class Poll {
    constructor() {
        this.question = '';
        this.options = new Map();
        this.chart = null;
        this.totalVotes = 0;
    }

    initializeChart() {
        const ctx = document.getElementById('resultsChart').getContext('2d');
        this.chart = new Chart(ctx, {
            type: 'pie',
            data: {
                labels: [],
                datasets: [{
                    data: [],
                    backgroundColor: [
                        '#FF6B6B', '#4ECDC4', '#45B7D1',
                        '#96CEB4', '#FFEEAD', '#D4A5A5'
                    ],
                    borderWidth: 2,
                    borderColor: '#fff'
                }]
            },
            options: {
                responsive: true,
                plugins: {
                    legend: {
                        position: 'bottom',
                        labels: {
                            color: '#333',
                            font: { size: 14, weight: 'bold' },
                            padding: 20
                        }
                    }
                },
                animation: {
                    duration: 1500,
                    easing: 'easeOutBounce'
                }
            }
        });
    }

    updateChart() {
        if (this.chart) {
            this.chart.data.labels = Array.from(this.options.keys());
            this.chart.data.datasets[0].data = Array.from(this.options.values());
            this.chart.update();
        }
    }

    calculatePercentage(votes) {
        return this.totalVotes === 0 ? 0 : Math.round((votes / this.totalVotes) * 100);
    }
}

const poll = new Poll();

document.addEventListener('DOMContentLoaded', () => {
    const addOptionBtn = document.getElementById('addOption');
    const createPollBtn = document.getElementById('createPoll');
    const optionsContainer = document.getElementById('optionsContainer');
    const resultsSection = document.getElementById('resultsSection');
    const voteButtons = document.getElementById('voteButtons');
    const activeQuestion = document.getElementById('activeQuestion');
    const shareLink = document.getElementById('shareLink');
    const copyLinkBtn = document.getElementById('copyLink');
    const totalVotesSpan = document.getElementById('totalVotes');

    function generateShareUrl(question, options) {
        const baseUrl = window.location.origin + window.location.pathname;
        const pollData = { q: question, o: options };
        const encodedData = btoa(JSON.stringify(pollData));
        return `${baseUrl}?poll=${encodedData}`;
    }

    function loadPollFromUrl() {
        const urlParams = new URLSearchParams(window.location.search);
        const pollData = urlParams.get('poll');
        if (pollData) {
            try {
                const decodedData = JSON.parse(atob(pollData));
                document.getElementById('pollQuestion').value = decodedData.q;
                optionsContainer.innerHTML = '';
                decodedData.o.forEach((option, index) => {
                    const newOption = document.createElement('input');
                    newOption.type = 'text';
                    newOption.className = 'option-input fancy-input';
                    newOption.value = option;
                    newOption.style.animation = `slideIn 0.5s ease ${index * 0.1}s both`;
                    optionsContainer.appendChild(newOption);
                });
                createPollBtn.click();
            } catch (e) {
                console.error('Invalid poll data in URL');
            }
        }
    }

    addOptionBtn.addEventListener('click', () => {
        if (optionsContainer.children.length < 6) {
            const newOption = document.createElement('input');
            newOption.type = 'text';
            newOption.className = 'option-input fancy-input';
            newOption.placeholder = `Option ${optionsContainer.children.length + 1}`;
            newOption.style.animation = 'slideIn 0.5s ease';
            optionsContainer.appendChild(newOption);
        }
    });

    createPollBtn.addEventListener('click', () => {
        const question = document.getElementById('pollQuestion').value;
        const options = Array.from(optionsContainer.getElementsByTagName('input'))
            .map(input => input.value.trim())
            .filter(value => value !== '');

        if (question && options.length >= 2) {
            poll.question = question;
            options.forEach(opt => poll.options.set(opt, 0));

            activeQuestion.textContent = question;
            voteButtons.innerHTML = '';
            options.forEach((opt, index) => {
                const btn = document.createElement('button');
                btn.textContent = opt;
                btn.className = 'fancy-btn';
                btn.style.animation = `slideIn 0.5s ease ${index * 0.1}s both`;
                btn.setAttribute('data-percentage', '0%');
                btn.addEventListener('click', () => {
                    const currentVotes = (poll.options.get(opt) || 0) + 1;
                    poll.options.set(opt, currentVotes);
                    poll.totalVotes++;
                    totalVotesSpan.textContent = poll.totalVotes;
                    const percentage = poll.calculatePercentage(currentVotes);
                    btn.setAttribute('data-percentage', `${percentage}%`);
                    poll.updateChart();
                    btn.style.transform = 'scale(1.05)';
                    setTimeout(() => btn.style.transform = 'scale(1)', 200);
                });
                voteButtons.appendChild(btn);
            });

            if (!poll.chart) poll.initializeChart();
            poll.updateChart();

            resultsSection.style.display = 'block';
            resultsSection.style.animation = 'fadeIn 0.8s ease';
            shareLink.value = generateShareUrl(question, options);
        }
    });

    copyLinkBtn.addEventListener('click', () => {
        shareLink.select();
        navigator.clipboard.writeText(shareLink.value)
            .then(() => {
                copyLinkBtn.textContent = 'Copied!';
                copyLinkBtn.style.background = 'linear-gradient(45deg, #96ceb4, #ffeead)';
                setTimeout(() => {
                    copyLinkBtn.textContent = 'Copy Link';
                    copyLinkBtn.style.background = 'linear-gradient(45deg, #ff6b6b, #ff8e53)';
                }, 2000);
            })
            .catch(err => console.error('Failed to copy: ', err));
    });

    loadPollFromUrl();
});

const styleSheet = document.styleSheets[0];
styleSheet.insertRule(`
    @keyframes slideIn {
        from {
            opacity: 0;
            transform: translateY(20px);
        }
        to {
            opacity: 1;
            transform: translateY(0);
        }
    }
`, styleSheet.cssRules.length);

styleSheet.insertRule(`
    @keyframes fadeIn {
        from { opacity: 0; }
        to { opacity: 1; }
    }
`, styleSheet.cssRules.length);


    Enter fullscreen mode


    Exit fullscreen mode


  Core Functionality Explained


  1. Poll Class Structure

class Poll {
  constructor() {
    this.question = '';
    this.options = new Map();
    this.chart = null;
    this.totalVotes = 0;
  }
  // Methods here...
}


    Enter fullscreen mode


    Exit fullscreen mode


question: Stores poll question


options: Map of option/vote pairs


chart: Chart.js instance reference


  2. Chart Initialization

initializeChart() {
  const ctx = document.getElementById('resultsChart').getContext('2d');
  this.chart = new Chart(ctx, { /* config */ });
}


    Enter fullscreen mode


    Exit fullscreen mode


Creates pie chart with custom colors

Sets animation parameters


  3. Voting Mechanism

btn.addEventListener('click', () => {
  const currentVotes = (poll.options.get(opt) || 0) + 1;
  poll.options.set(opt, currentVotes);
  poll.totalVotes++;
  poll.updateChart();
});


    Enter fullscreen mode


    Exit fullscreen mode


Increments vote count on click

Triggers chart update


  4. Shareable Links

function generateShareUrl(question, options) {
  const pollData = { q: question, o: options };
  const encodedData = btoa(JSON.stringify(pollData));
  return `${baseUrl}?poll=${encodedData}`;
}


    Enter fullscreen mode


    Exit fullscreen mode


Encodes poll data in Base64

Stores in URL parameters


  🔄 How Everything Works Together


  User Flow

User enters question & options

Clicks "Launch Poll"


System:


Initializes chart

Generates share URL

Shows results section


Voters:


Click options to vote

See chart update instantly


  Data Flow Diagram

User Input → JavaScript Class → Chart Update → DOM Changes


    Enter fullscreen mode


    Exit fullscreen mode


  🚀 Advanced Features Deep Dive


  1. Real-Time Updates


DOM Manipulation: Directly update vote counts


Chart.js API: chart.update() method refreshes visualization


  2. URL Data Encoding


btoa(): Converts JSON to Base64 string


atob(): Decodes Base64 back to JSON


  3. Performance Optimization


Debouncing: Limits rapid chart updates


CSS Transforms: Hardware-accelerated animations


  💡 Enhancement Ideas


  Beginner Upgrades

Add option deletion button

Implement vote undo feature

Create different color themes


  Intermediate Upgrades

Local storage for persistent data

Multiple chart types (bar, line)

Export results as PNG/PDF


  Advanced Upgrades

WebSocket integration for live sharing

User authentication system

Database integration


  🧩 Common Issues & Fixes


Problem
Solution


Chart not showing
Check CDN link & canvas ID


URL sharing broken
Verify Base64 encoding/decoding


Votes not updating
Confirm Map() object usage


Mobile layout issues
Add viewport meta tag


  📚 Learning Resources


Chart.js Documentation - chartjs.org


CSS Gradients Guide - cssgradient.io


JavaScript Map Object - MDN Web Docs


  🎓 Key Takeaways


Modern Browser Capabilities


Can handle complex apps without backend


Chart.js Power


Rich visualizations with minimal code


URL Magic


Store data directly in links


  🚨 Security Considerations
While our app works great, note that:
URL parameters can be manipulated

No vote protection (multiple votes allowed)

Data isn't encrypted

For production use, consider adding:
Vote IP tracking

Data validation

HTTPS encryption


  💬 FAQs
Q: Can I add more than 6 options?
A: Current CSS limits to 6, but you can modify the JavaScript  Q: Why use Map() instead of Object?
A: Map preserves insertion order and has better methods  Q: How to change chart colors?
A: Modify the backgroundColor array in chart config


  🌈 Conclusion
You've just built a complete polling system with:
Real-time visualizations

Shareable links

Beautiful UI

This project demonstrates how modern web technologies can create powerful applications without complex setups. The skills learned here apply to dashboards, analytics tools, and any data visualization project.  Happy coding! 🎉