
Hello fellow developers! 👋
Are you tired of static spreadsheets for budgeting? Want to see how adjusting your spending in one area affects your overall financial picture? In this tutorial, we'll build an interactive budget planner that gives you instant visual feedback as you adjust different spending categories.
This project is perfect for both practical financial planning and learning modern web development techniques!
What We're Building 🛠️
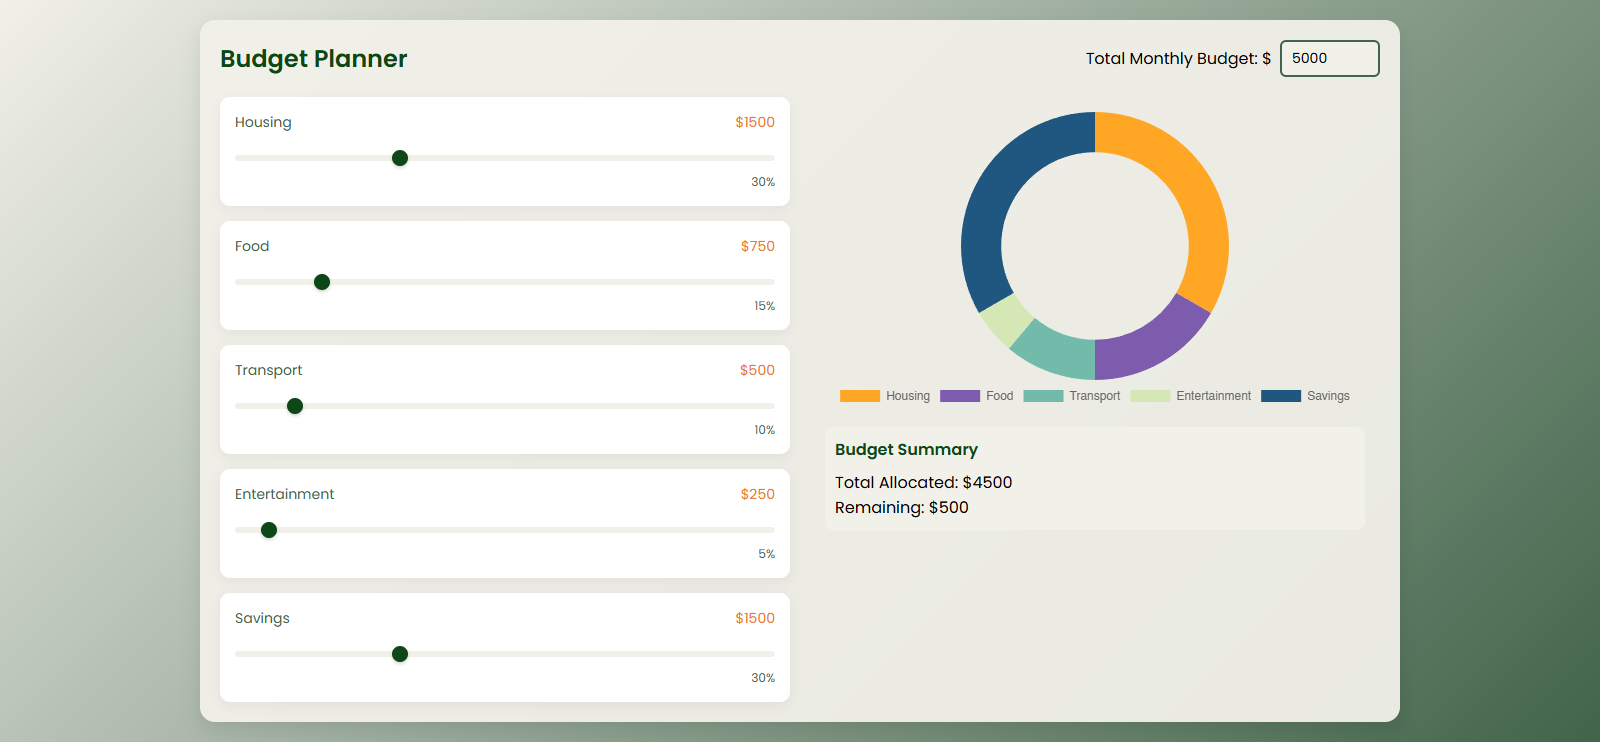
Our Interactive Budget Planner allows users to:
- Set their total monthly budget
- Adjust spending percentages across different categories using sliders
- See real-time updates to a visual pie chart
- Track allocated and remaining funds
- Get warnings when the budget is exceeded
You can try out the live demo here.
Project Structure 📁
We'll use three main files for this project:
-
index.html- Structure -
styles.css- Styling -
script.js- Functionality
Let's dive into each component!
HTML Structure
First, let's create the structure of our application. The HTML sets up the budget input, category sliders, and the visualization area.
</span>
 lang="en">

     charset="UTF-8">
     name="viewport" content="width=device-width, initial-scale=1.0">
    Interactive Budget Planner
     rel="stylesheet" href="styles.css">
     href="https://fonts.googleapis.com/css2?family=Poppins:wght@300;400;600&display=swap" rel="stylesheet">


     class="container">

            Budget Planner
             class="total-budget">
                Total Monthly Budget: $
                 type="number" id="totalBudget" value="5000" min="0">


         class="budget-grid">
             class="sliders-section">
                 class="category" data-category="housing">
                     class="category-header">
                        Housing
                         class="amount">$ class="value">1500

                     type="range" min="0" max="100" value="30" class="slider">
                     class="percentage">30%


                 class="category" data-category="food">
                     class="category-header">
                        Food
                         class="amount">$ class="value">750

                     type="range" min="0" max="100" value="15" class="slider">
                     class="percentage">15%


                 class="category" data-category="transport">
                     class="category-header">
                        Transport
                         class="amount">$ class="value">500

                     type="range" min="0" max="100" value="10" class="slider">
                     class="percentage">10%


                 class="category" data-category="entertainment">
                     class="category-header">
                        Entertainment
                         class="amount">$ class="value">250

                     type="range" min="0" max="100" value="5" class="slider">
                     class="percentage">5%


                 class="category" data-category="savings">
                     class="category-header">
                        Savings
                         class="amount">$ class="value">1500

                     type="range" min="0" max="100" value="30" class="slider">
                     class="percentage">30%


             class="visuals-section">
                 id="budgetChart">
                 class="summary">
                    Budget Summary
                    Total Allocated: $ id="totalAllocated">4000
                    Remaining: $ id="remaining">1000
                     id="warning" class="warning hidden">Budget exceeded!


    <span class="na">src="https://cdn.jsdelivr.net/npm/chart.js">
    <span class="na">src="script.js">


    Enter fullscreen mode


    Exit fullscreen mode


This HTML structure:
Sets up a container with a header section for the title and budget input
Creates a two-column grid layout with sliders on the left and visualizations on the right
Implements five budget categories (Housing, Food, Transport, Entertainment, Savings)
Each category has a label, dollar amount display, range slider, and percentage indicator
The visualization section contains a canvas for our chart and a budget summary


  Styling Our Budget Planner 💅
Next, let's add some CSS to make our app look professional:

* {
    margin: 0;
    padding: 0;
    box-sizing: border-box;
    font-family: 'Poppins', sans-serif;
}

body {
    background: linear-gradient(135deg, #F1F0E9 0%, #41644A 100%);
    min-height: 100vh;
    padding: 20px;
}

.container {
    max-width: 1200px;
    margin: 0 auto;
    background: rgba(241, 240, 233, 0.95);
    border-radius: 15px;
    padding: 20px;
    box-shadow: 0 8px 20px rgba(0, 0, 0, 0.1);
}

header {
    display: flex;
    justify-content: space-between;
    align-items: center;
    margin-bottom: 20px;
}

h1 {
    color: #0D4715;
    font-weight: 600;
    font-size: 24px;
}

.total-budget {
    display: flex;
    align-items: center;
    gap: 8px;
}

.total-budget input {
    padding: 6px 10px;
    border: 2px solid #41644A;
    border-radius: 6px;
    font-size: 14px;
    width: 100px;
    background: #F1F0E9;
}

.budget-grid {
    display: grid;
    grid-template-columns: 1fr 1fr;
    gap: 20px;
}

.sliders-section {
    display: flex;
    flex-direction: column;
    gap: 15px;
}

.category {
    background: #fff;
    padding: 15px;
    border-radius: 10px;
    box-shadow: 0 4px 12px rgba(0, 0, 0, 0.05);
    transition: transform 0.2s;
}

.category:hover {
    transform: translateY(-3px);
}

.category-header {
    display: flex;
    justify-content: space-between;
    margin-bottom: 10px;
    color: #41644A;
    font-weight: 500;
    font-size: 14px;
}

.amount {
    color: #E9762B;
}

.slider {
    width: 100%;
    height: 6px;
    border-radius: 3px;
    background: #F1F0E9;
    outline: none;
    -webkit-appearance: none;
    cursor: pointer;
}

.slider::-webkit-slider-thumb {
    -webkit-appearance: none;
    width: 16px;
    height: 16px;
    border-radius: 50%;
    background: #0D4715;
    box-shadow: 0 2px 4px rgba(0, 0, 0, 0.2);
}

.percentage {
    text-align: right;
    color: #41644A;
    margin-top: 5px;
    font-size: 12px;
}

.visuals-section {
    padding: 15px;
}

canvas {
    max-height: 300px;
}

.summary {
    margin-top: 15px;
    padding: 10px;
    background: #F1F0E9;
    border-radius: 8px;
}

.summary h3 {
    color: #0D4715;
    margin-bottom: 8px;
    font-size: 16px;
}

.warning {
    margin-top: 8px;
    padding: 6px;
    background: #E9762B;
    color: #fff;
    border-radius: 4px;
    text-align: center;
    font-size: 12px;
}

.hidden {
    display: none;
}


    Enter fullscreen mode


    Exit fullscreen mode


Our CSS implements:
A beautiful gradient background
A responsive grid layout that works on both desktop and mobile
Interactive hover effects on category cards
Custom-styled sliders with a green thumb
A clean, modern aesthetic with shadows and rounded corners
Clear visual hierarchy with distinct color coding


  Making It Interactive with JavaScript 🔄
Now for the exciting part - the JavaScript that makes everything interactive:

document.addEventListener('DOMContentLoaded', () => {
    const totalBudgetInput = document.getElementById('totalBudget');
    const sliders = document.querySelectorAll('.slider');
    const totalAllocatedSpan = document.getElementById('totalAllocated');
    const remainingSpan = document.getElementById('remaining');
    const warningDiv = document.getElementById('warning');


    const ctx = document.getElementById('budgetChart').getContext('2d');
    const budgetChart = new Chart(ctx, {
        type: 'doughnut',
        data: {
            labels: ['Housing', 'Food', 'Transport', 'Entertainment', 'Savings'],
            datasets: [{
                data: [1500, 750, 500, 250, 1500],
                backgroundColor: [
                    '#FFA725',
                    '#7E5CAD',
                    '#72BAA9',
                    '#D5E7B5',
                    '#205781'
                ],
                borderWidth: 0
            }]
        },
        options: {
            responsive: true,
            maintainAspectRatio: false,
            cutout: '70%',
            plugins: {
                legend: {
                    position: 'bottom'
                }
            }
        }
    });

    function updateBudget() {
        const totalBudget = parseFloat(totalBudgetInput.value) || 0;
        let totalAllocated = 0;
        const allocations = {};

        sliders.forEach(slider => {
            const percentage = parseFloat(slider.value);
            const category = slider.parentElement.dataset.category;
            const amount = (totalBudget * percentage) / 100;

            slider.parentElement.querySelector('.percentage span').textContent = percentage;
            slider.parentElement.querySelector('.value').textContent = Math.round(amount);
            totalAllocated += amount;
            allocations[category] = amount;
        });

        totalAllocatedSpan.textContent = Math.round(totalAllocated);
        remainingSpan.textContent = Math.round(totalBudget - totalAllocated);


        budgetChart.data.datasets[0].data = [
            allocations.housing,
            allocations.food,
            allocations.transport,
            allocations.entertainment,
            allocations.savings
        ];
        budgetChart.update();


        if (totalAllocated > totalBudget) {
            warningDiv.classList.remove('hidden');
        } else {
            warningDiv.classList.add('hidden');
        }
    }


    totalBudgetInput.addEventListener('input', updateBudget);
    sliders.forEach(slider => {
        slider.addEventListener('input', updateBudget);
    });


    updateBudget();
});


    Enter fullscreen mode


    Exit fullscreen mode


Let's break down what this JavaScript does:


  1. Initialization 🏁
We start by selecting all the DOM elements we need to work with and initializing our Chart.js doughnut chart with default values and colors.


  2. The Update Function ⚙️
The core of our application is the updateBudget() function which:
Reads the current total budget value
Calculates money allocation for each category based on slider percentages
Updates all displays with new values
Refreshes the doughnut chart to reflect new allocations
Shows or hides a warning if budget is exceeded


  3. Event Listeners 👂
We set up event listeners on the budget input and each slider to detect changes and update everything in real-time.


  How It All Works Together
The real magic happens when users interact with the app:
User adjusts a slider or changes the total budget
Event listeners trigger the update function
All values recalculate instantly
Dollar amounts and percentages update in real-time
The chart animates smoothly to its new state
Budget summary reflects new allocations
This creates a seamless experience where users can immediately see how adjusting one category affects their overall budget.


  The Power of Chart.js
For our visualization, we're using Chart.js, which is an excellent library for creating beautiful, responsive charts. We've configured it to:
Display a doughnut chart with a cutout center
Use custom colors for each budget category
Automatically animate when data changes
Include a legend at the bottom
Maintain aspect ratio for proper display


  Key Learning Points 📝
Building this project teaches several important web development concepts:

Real-time DOM manipulation - Updating values based on user input

Event-driven programming - Responding to slider changes

Data visualization - Using Chart.js to represent budget allocations

CSS Grid - Creating responsive layouts

Input validation - Handling budget limitations and warnings


  Possible Enhancements 🌟
Want to take this project further? Here are some ideas:
Add localStorage to save budgets between sessions
Implement a monthly comparison view
Allow users to add and remove custom categories
Add a dark/light theme toggle
Create a mobile-optimized version
Include a budget export feature (PDF or CSV)


  Conclusion 💰
This interactive budget planner demonstrates how modern web technologies can transform mundane tasks like budgeting into engaging, visual experiences. The combination of range sliders for input and Chart.js for visualization creates an intuitive interface that helps users better understand their spending patterns.The real value is in the instant feedback loop - change one value and immediately see how it affects your overall financial picture.I'd love to see your versions or improvements of this project! Share them in the comments below.Happy coding (and budgeting)! 🚀What financial tools have you built with JavaScript? Let me know in the comments!