Welcome! In this blog, we'll guide you through creating a multi-tenant performance and cost tracking solution using Amazon RDS (PostgreSQL), Athena, AWS Glue, and supporting AWS services. This solution is perfect for SaaS products requiring centralized monitoring, log analysis, and schema-level tenant isolation.
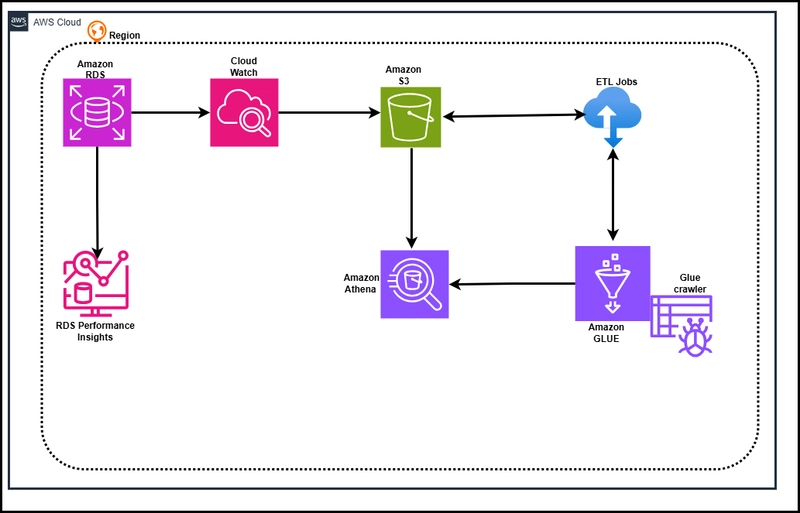
Architecture Diagram - Multi-Tenant RDS Cost & Performance Analytics.

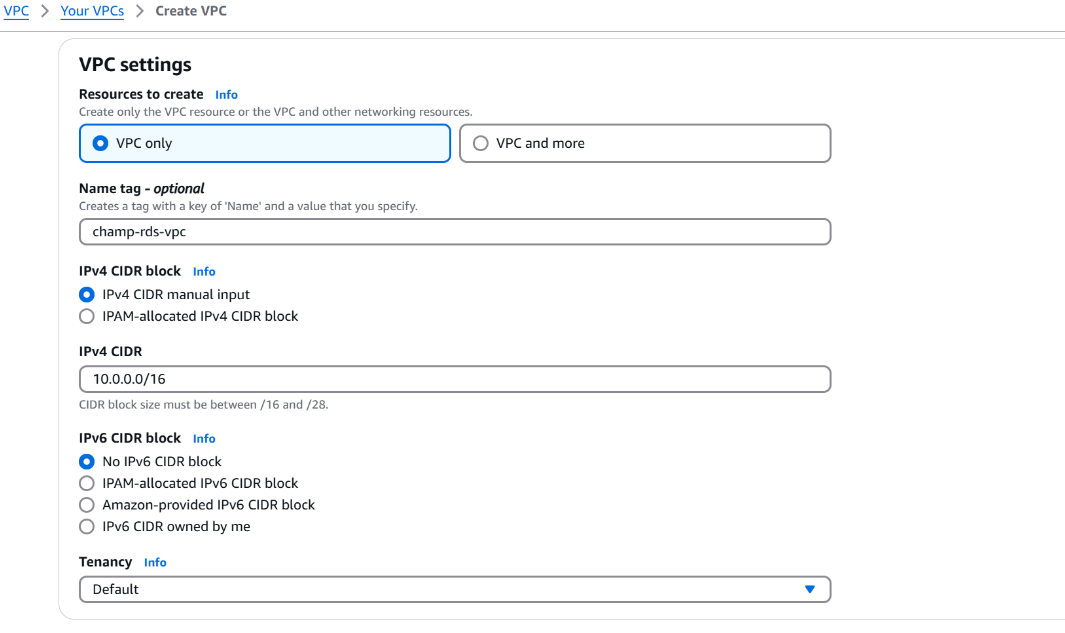
Step 1: Networking Setup
Create a secure environment for hosting the RDS instance:
- VPC CIDR: 10.0.0.0/16
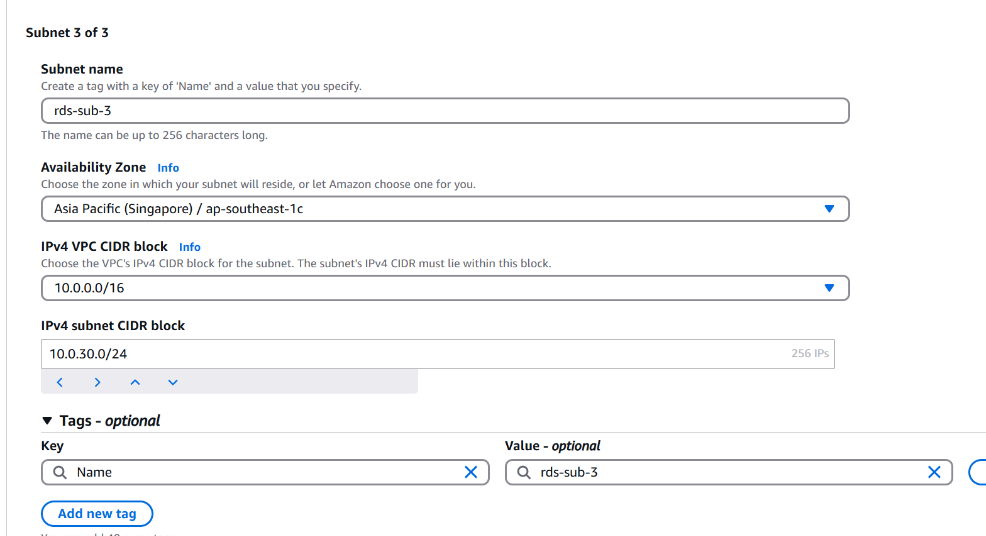
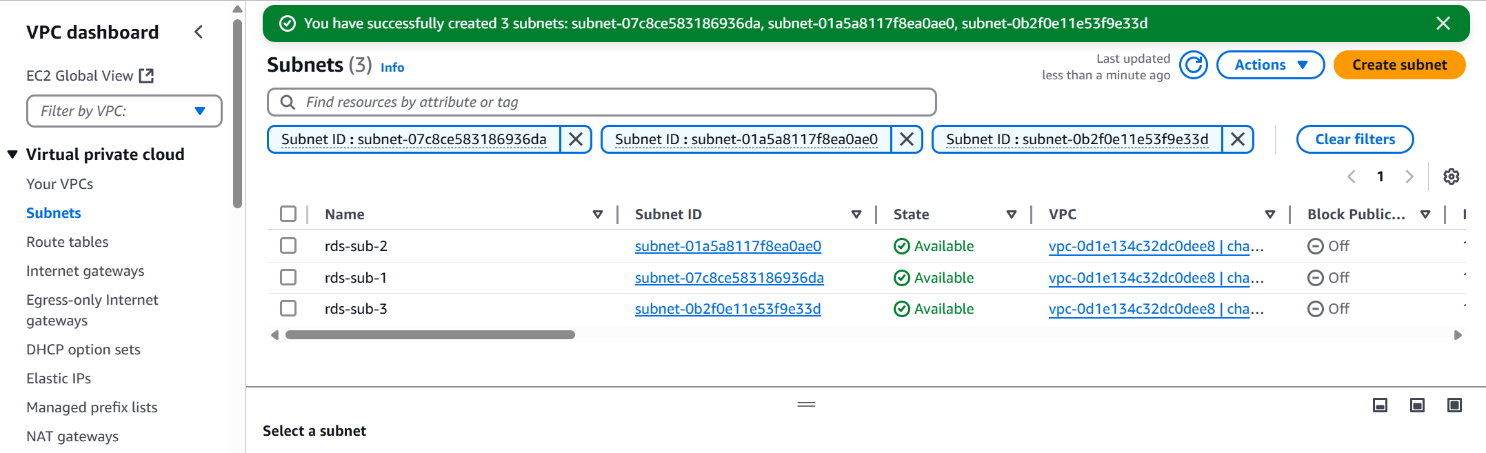
- Subnets: Create at least three across different Availability Zones
- Internet Gateway: Attach and update routing
- Route Table: Add custom routes for outbound traffic
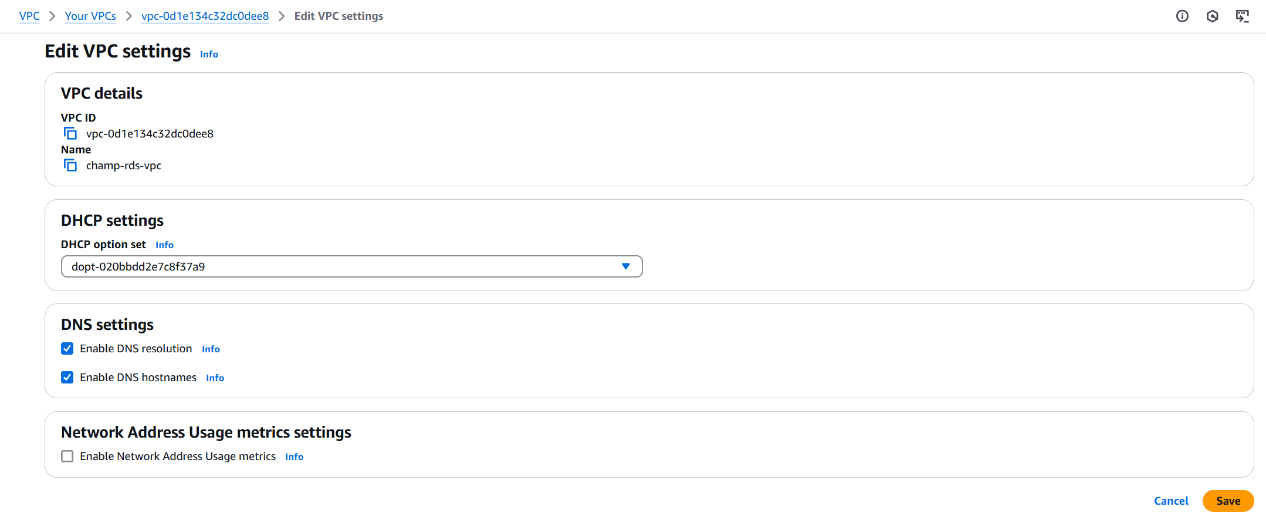
- DNS Hostnames: Enable to facilitate RDS endpoint resolution
Step 2: Deploy Amazon RDS (PostgreSQL)
- Engine: PostgreSQL
- Instance Class: db.t3.micro (Free Tier eligible)
- Database Name: Champrds
- Storage: gp2 with autoscaling
- Network: Place the RDS in the custom VPC and subnet group
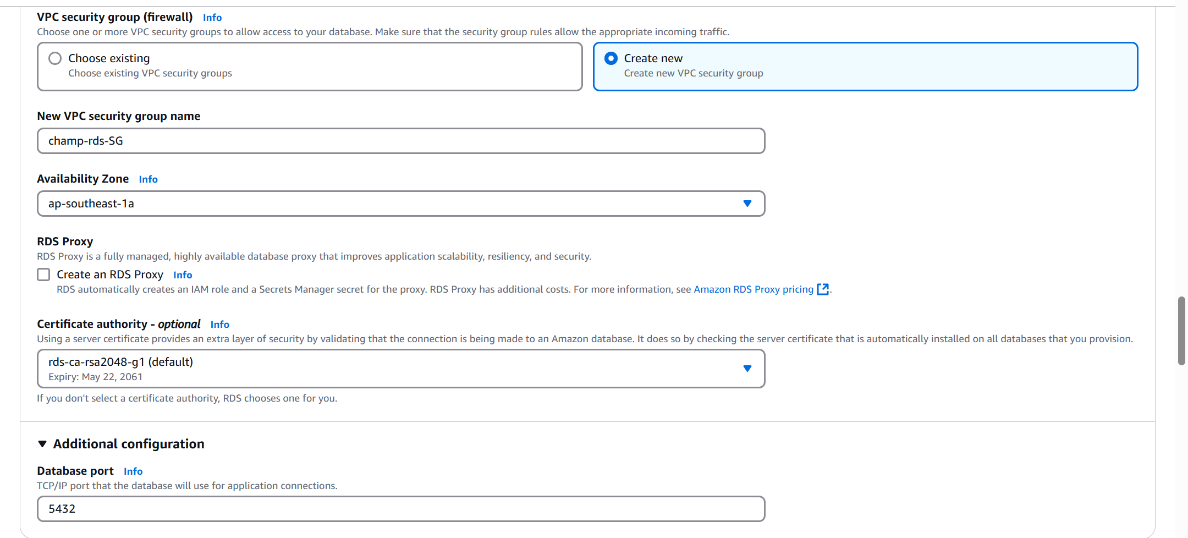
- Security: Allow port 5432 internally; enable deletion protection
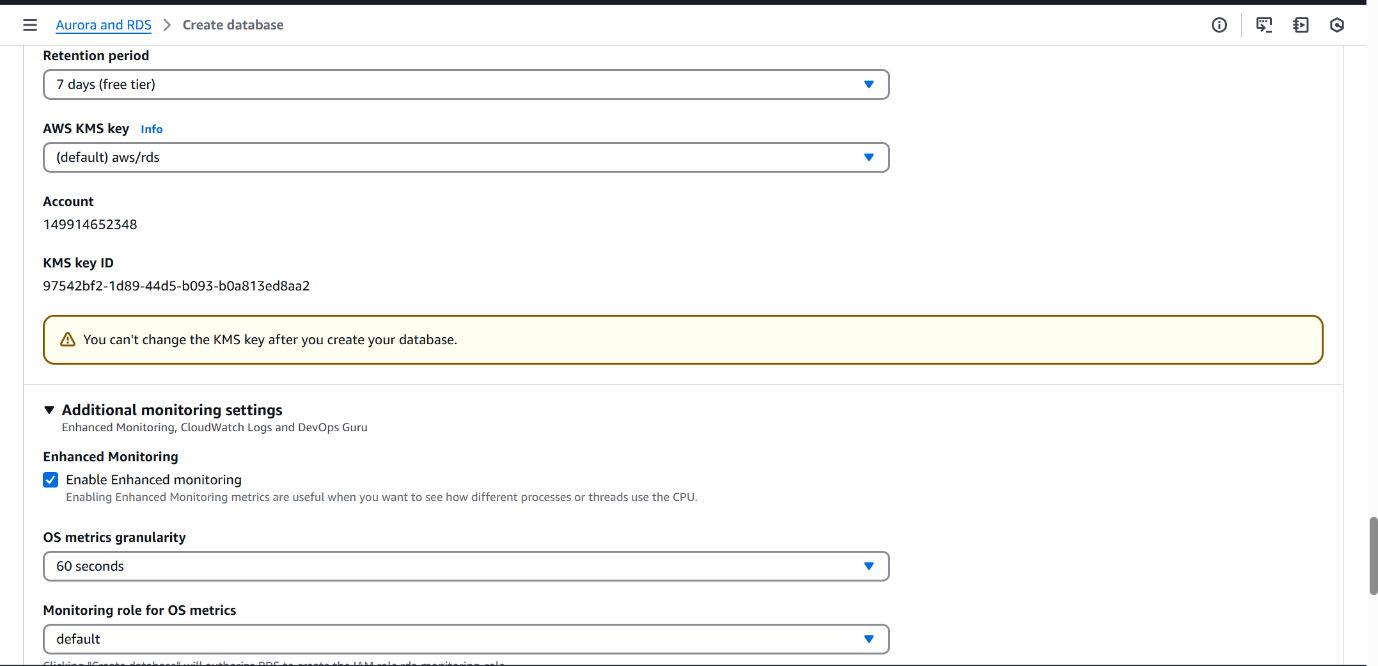
- Monitoring: Enable Enhanced Monitoring and Performance Insights
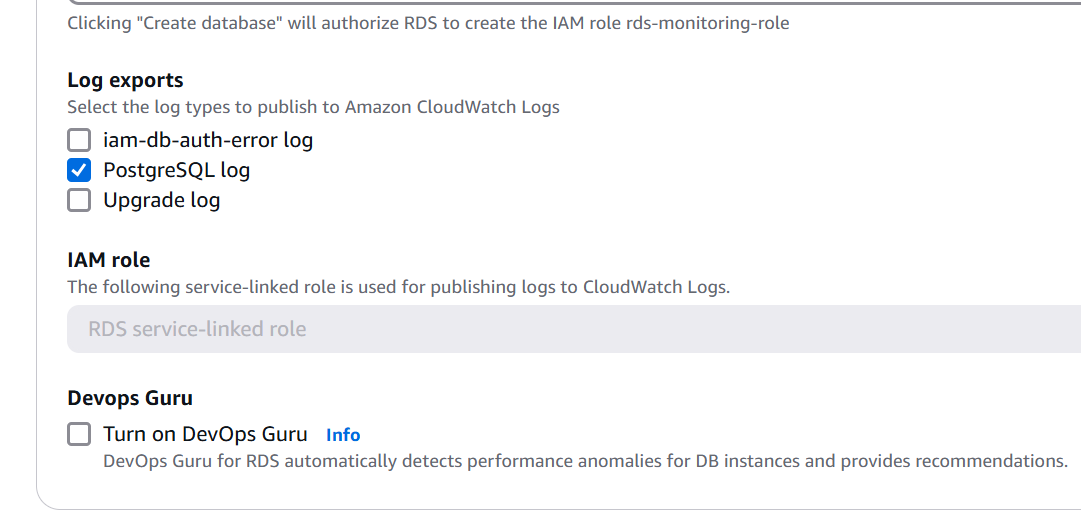
- Logs: Export PostgreSQL logs to Amazon CloudWatch
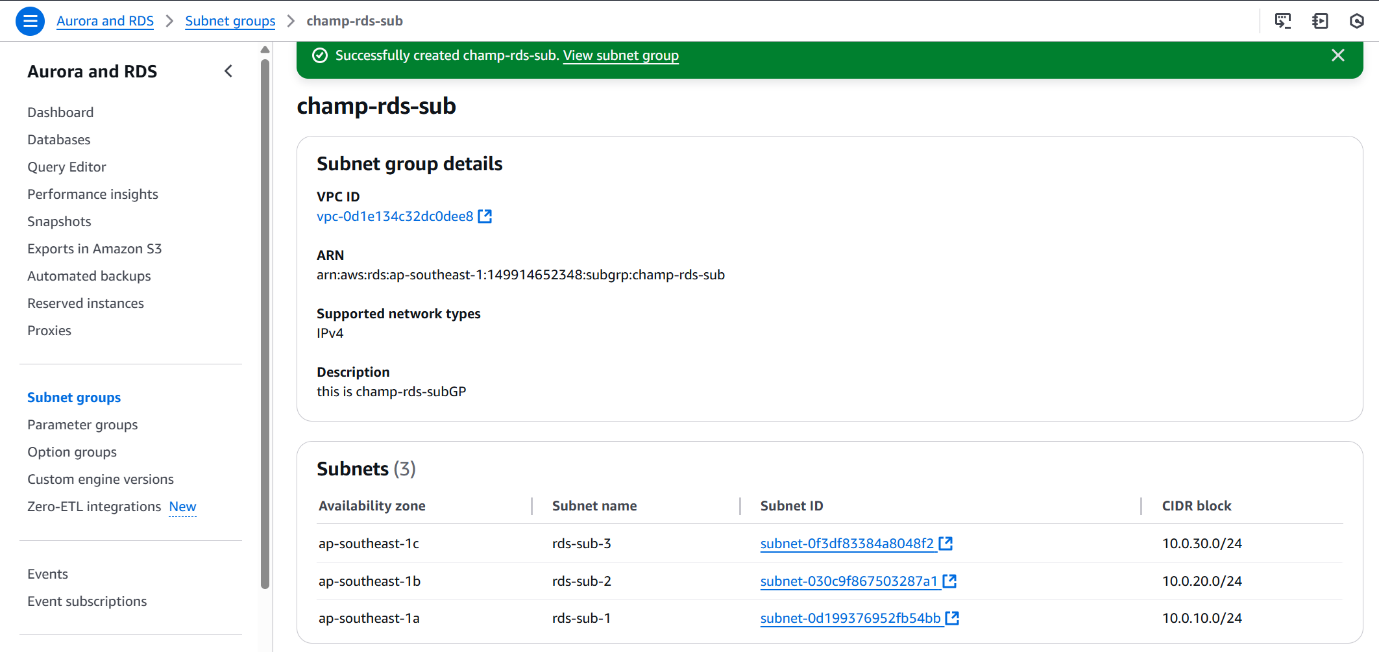
Subnet Group Configuration:
To define a group of subnets in multiple Availability Zones for Amazon RDS, enabling high availability and failover support.
Steps:
- Created a DB Subnet Group using the previously created custom VPC named champ.
- Selected multiple Availability Zones to ensure redundancy.
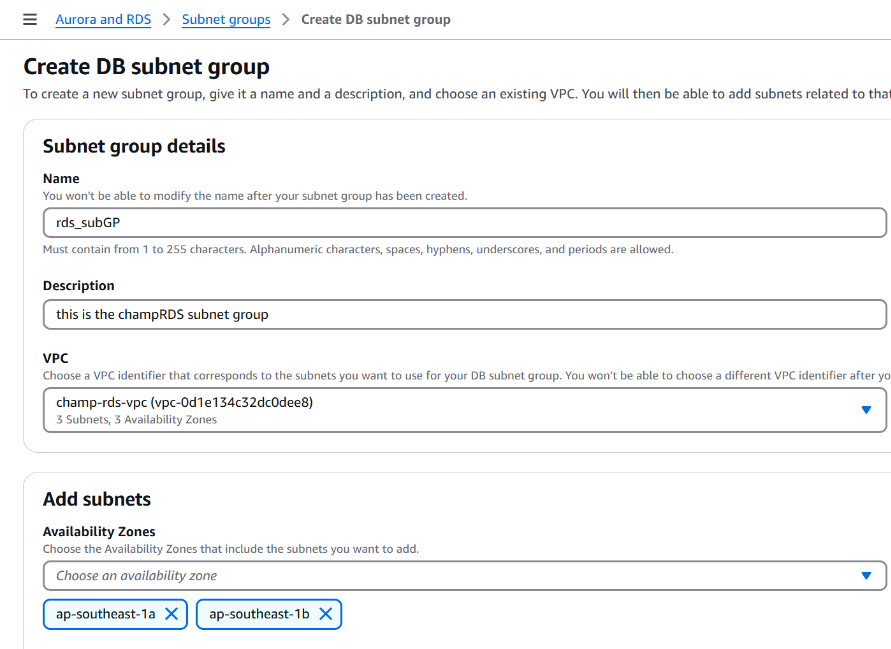
- Added the three private subnets to the subnet group
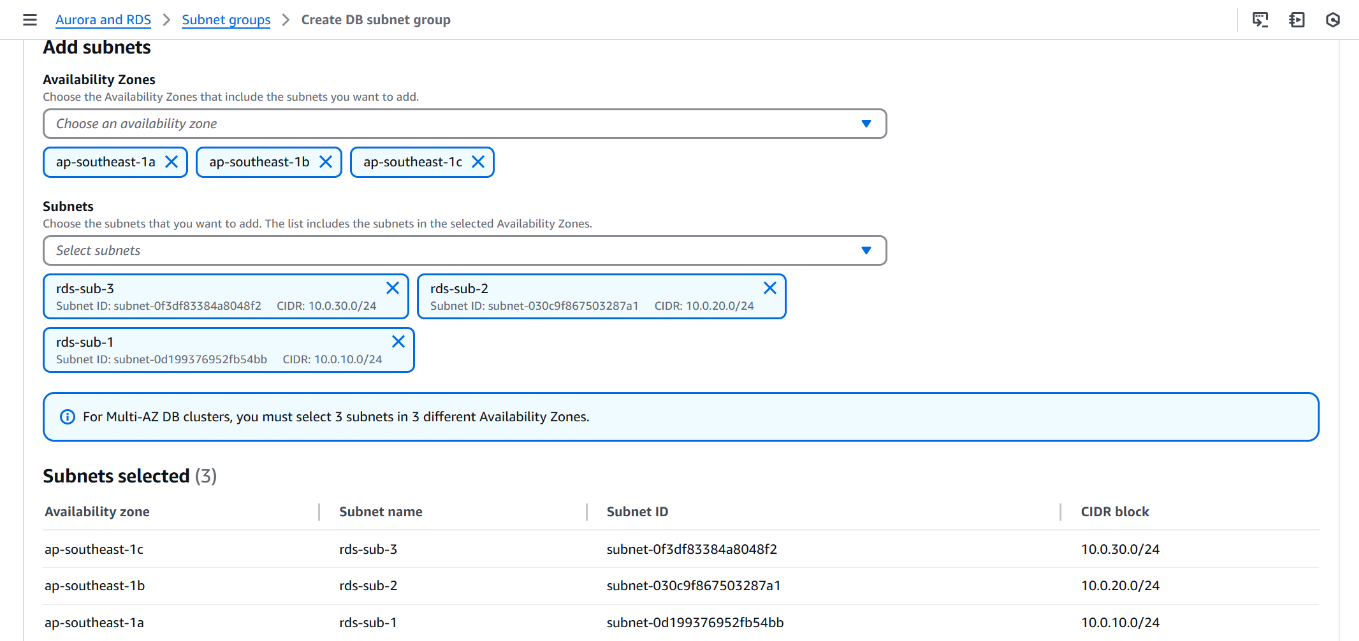
The image shows the final confirmation screen of the DB Subnet Group named champsubnet-group, associated with three subnets across different AZs.
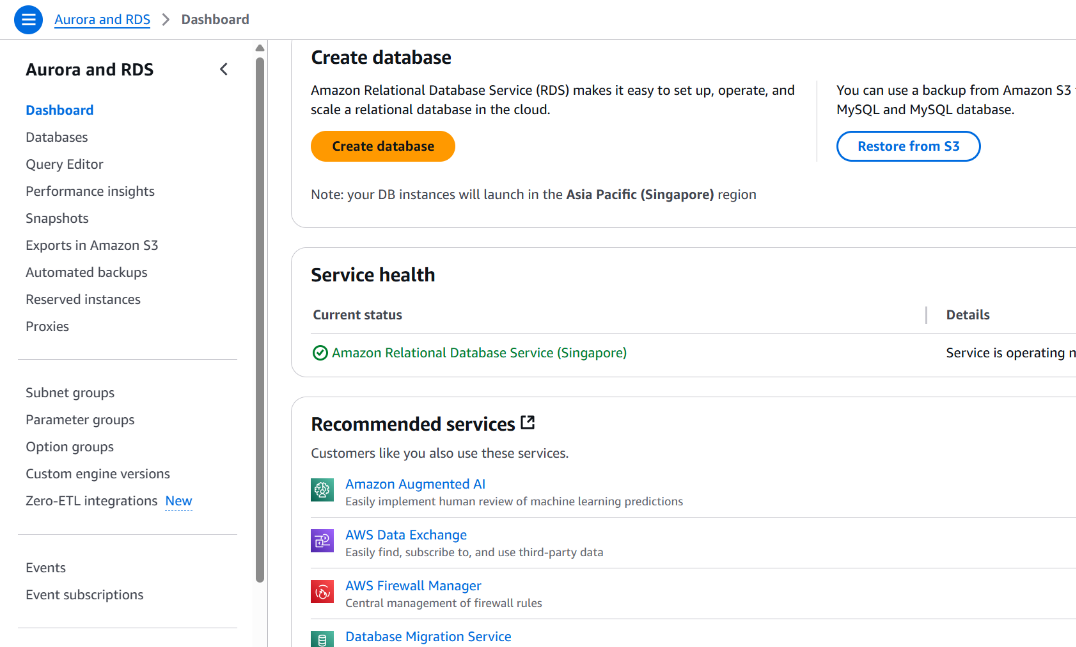
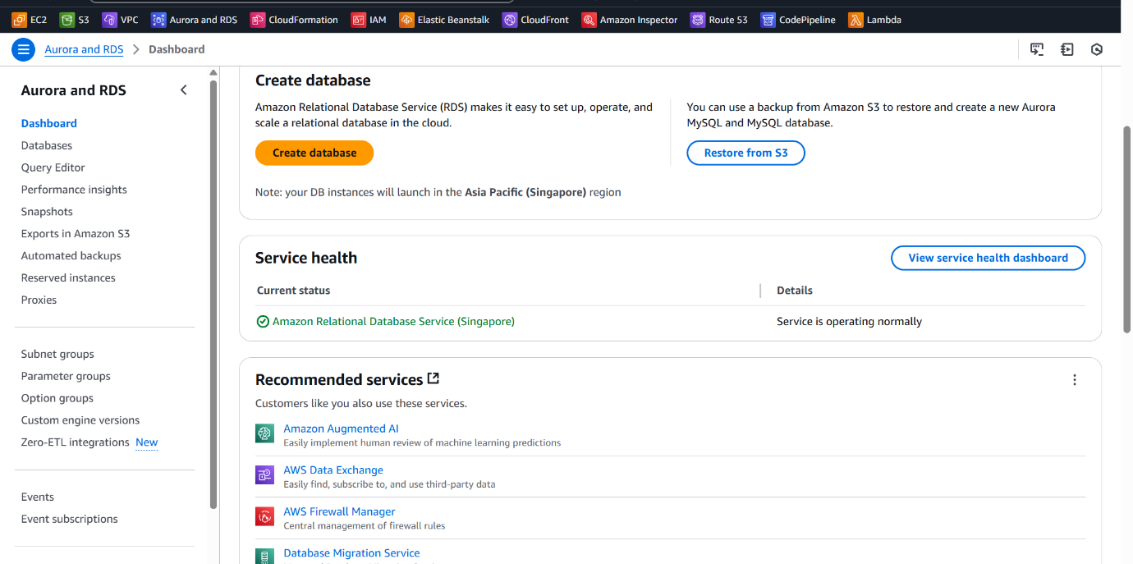
Amazon RDS (PostgreSQL) Configuration:
To provision a managed PostgreSQL database instance with support for multi-tenant architecture and performance monitoring.
Why PostgreSQL?
- Open-source, highly reliable, and feature-rich.
- Strong support for schema-based multi-tenancy.
- Compatible with AWS services like Performance Insights, CloudWatch, and extensions like pg_stat_statements.
*Steps: *
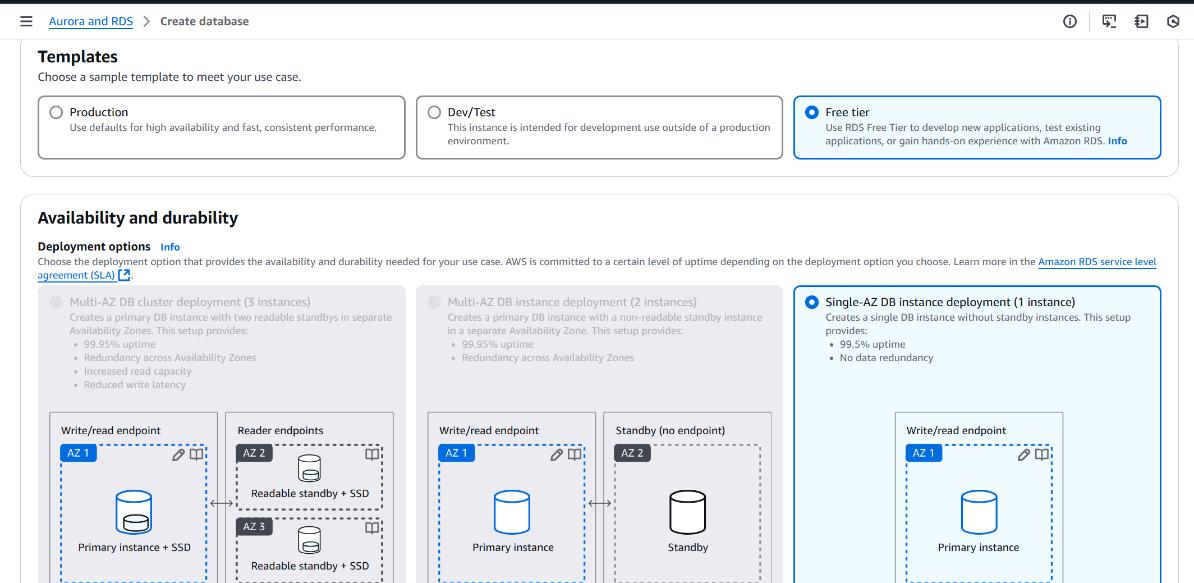
• Selected Amazon RDS from the AWS Console.
• Chose PostgreSQL as the database engine.
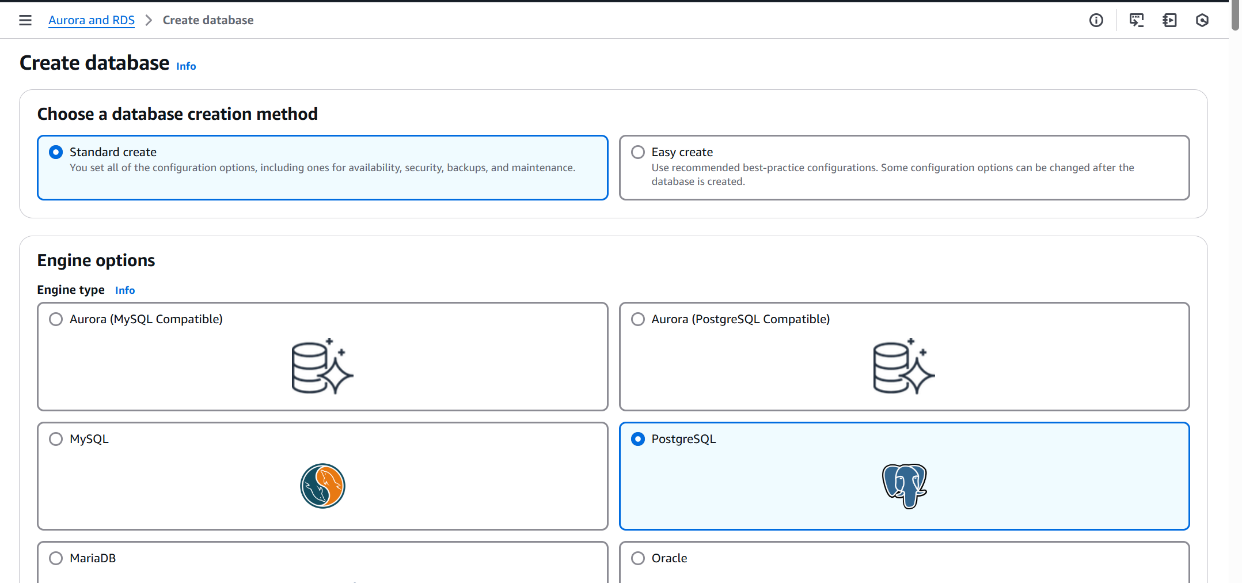
• In Templates, selected Free Tier.
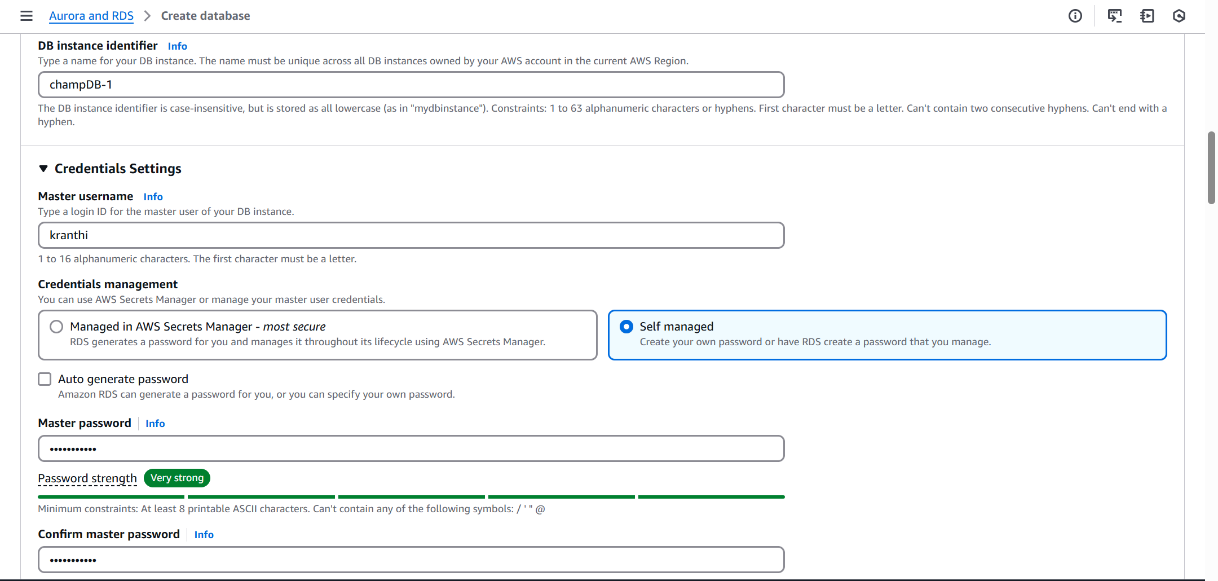
- Set DB instance identifier as champDB-1.
- Under Credential Settings, chose Self-managed credentials.
- Provided custom master username.
- Set a strong password.
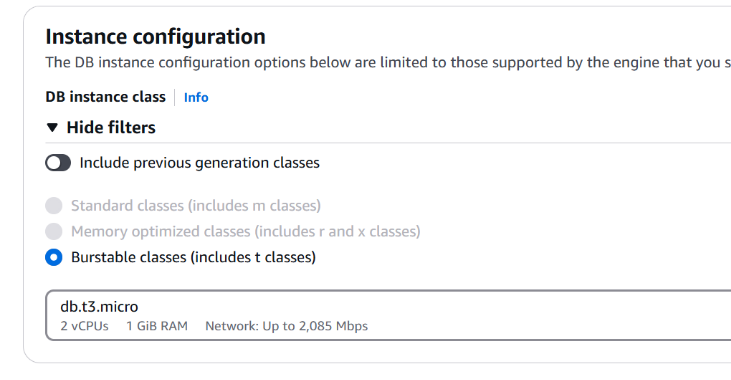
• Selected Burstable instance class (db.t3.micro) for cost-effective performance.
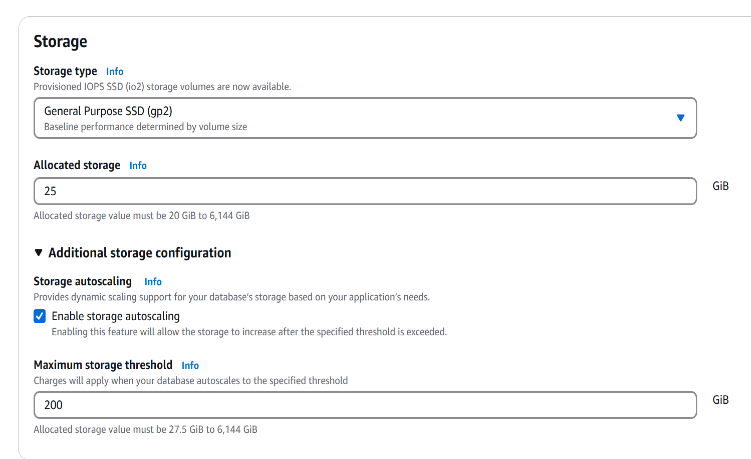
• Chose General Purpose (SSD) – gp2
• Allocated required initial storage
• Enabled Storage Auto Scaling.
• Set Maximum storage threshold
• Chose Not to connect to EC2 as the DB will be accessed using pgAdmin.
• Selected the custom VPC created earlier (champ)
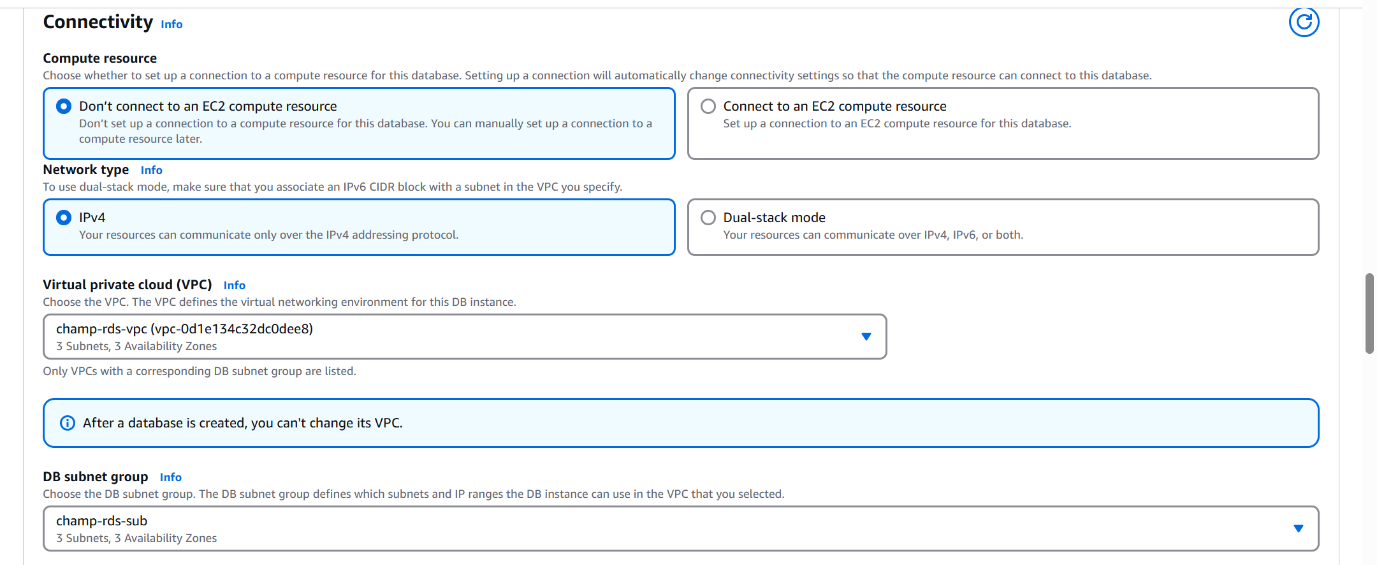
• Selected the DB Subnet Group previous
• Created a new Security Group: - Opened port 5432 (PostgreSQL default) for inbound access.
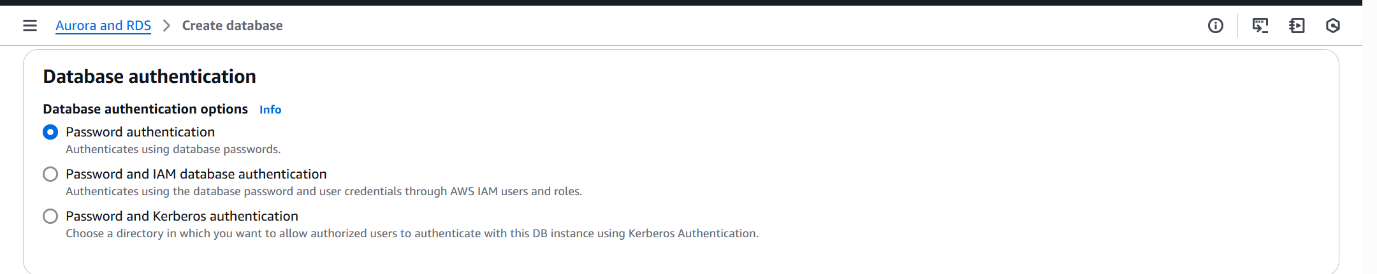
• Selected Password Authentication for database login.
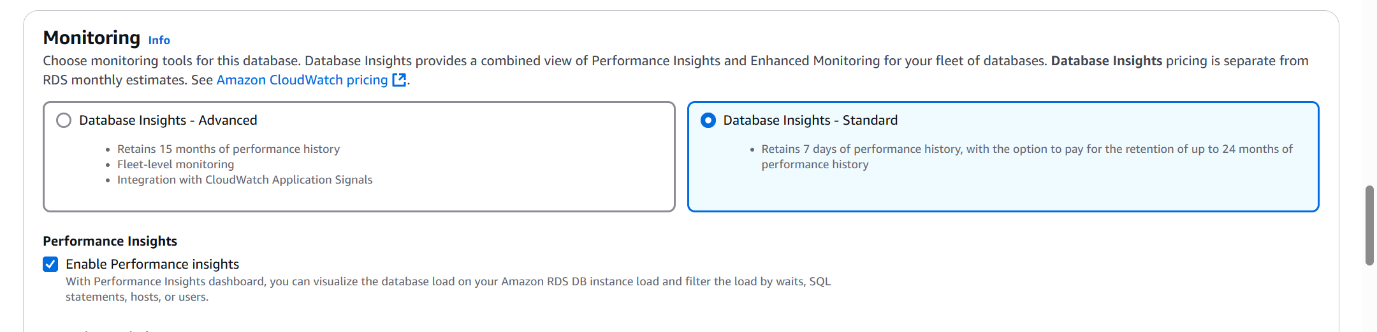
• Enabled Enhanced Monitoring for real-time metrics on the database instance.
• Enabled Performance Insights for in-depth query and load analysis.
_Purpose and Benefits of Enhanced Monitoring_
- - Provides real-time OS-level metrics such as CPU, memory, disk I/O, and network usage.
- - Helps in identifying performance bottlenecks at the instance level.
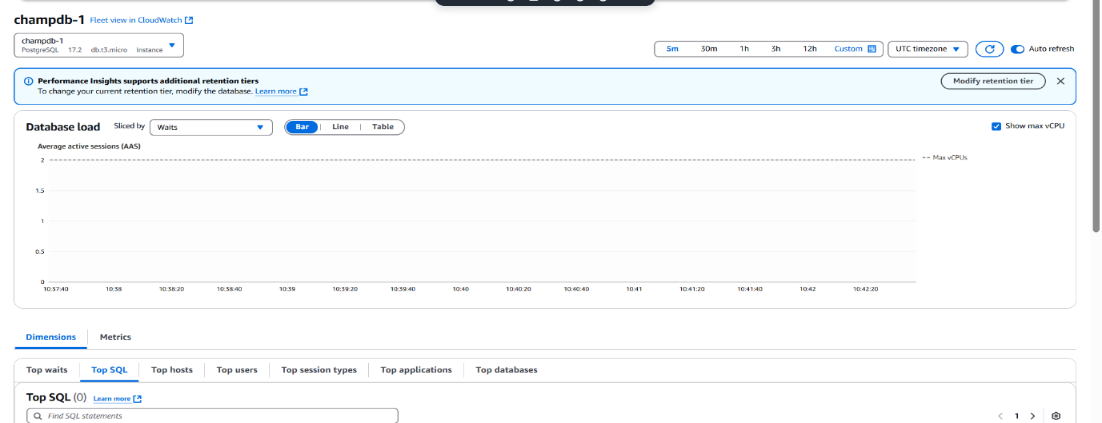
Performance Insights
- - Visualizes database load and query performance over time.
- - Helps in identifying slow or expensive queries.
- - Supports deeper optimization by showing wait events and resource usage patterns.
Enabled PostgreSQL log under Log exports to Amazon CloudWatch Logs.
To capture and centralize PostgreSQL database logs (including general activity, connections, and errors) in CloudWatch Logs for further analysis, alerting, and integration with downstream services like S3, Athena, and Glue.
• Set the Initial database name as Champrds.
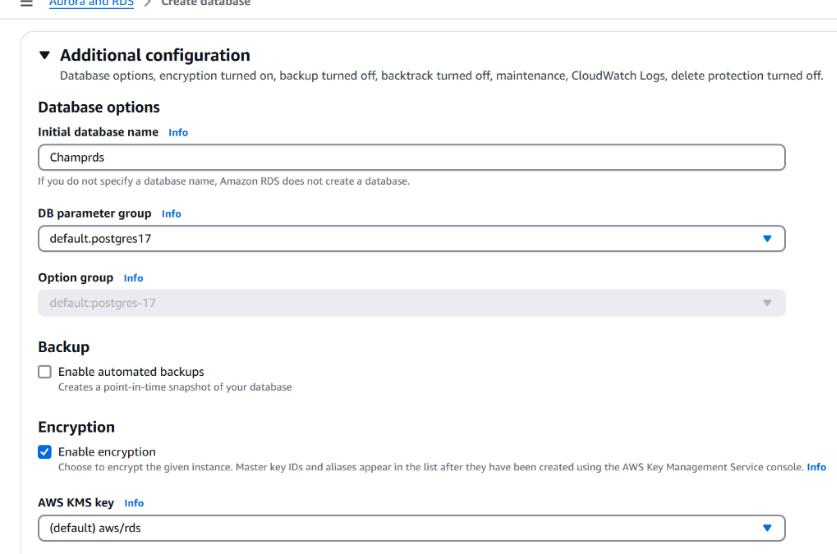
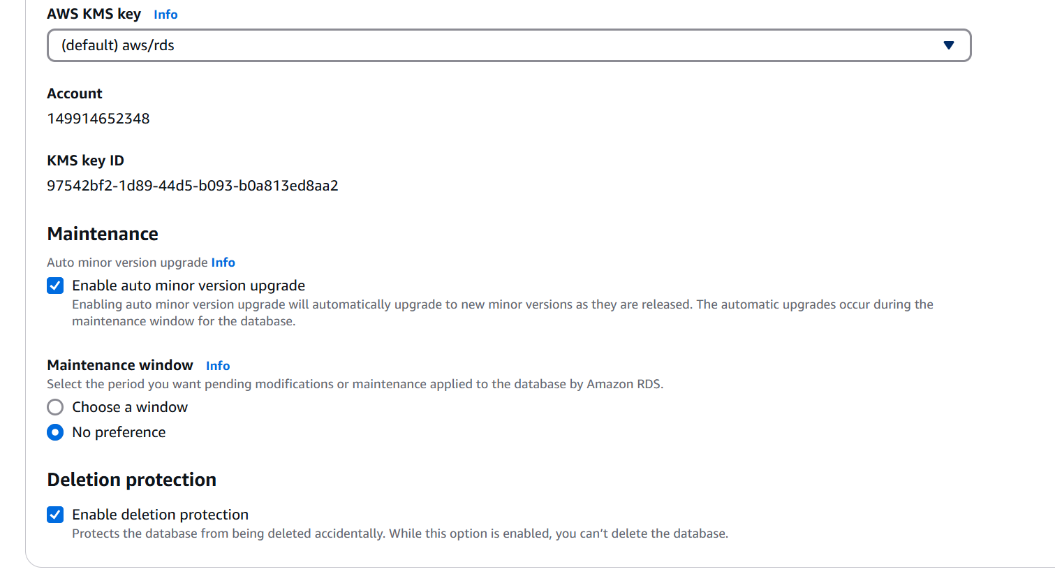
• Enabled Deletion Protection to prevent accidental deletion of the RDS instance.
• Created the PostgreSQL database instance with the name Champrds.
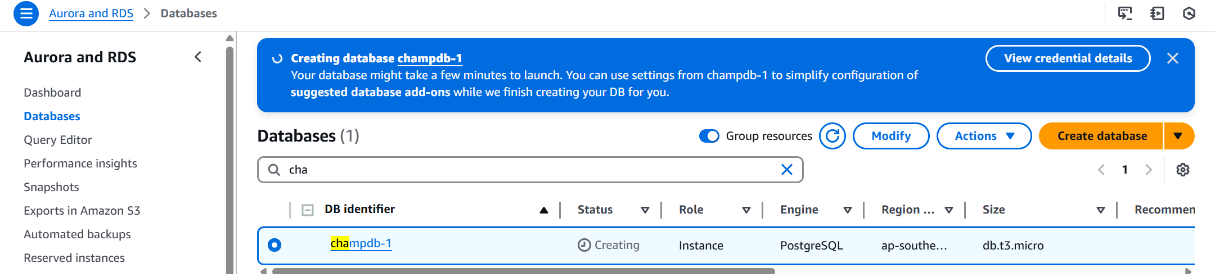
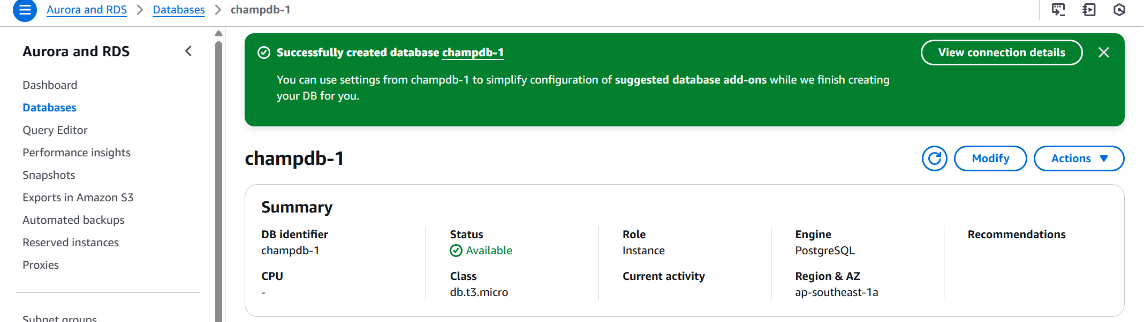
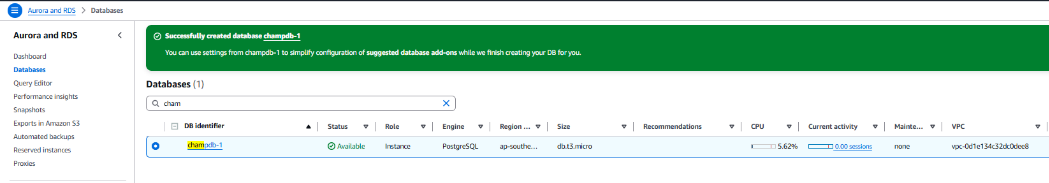
Once the RDS instance reached Available status: The Current Activity tab became visible in the RDS console
- This tab provides real-time query and session metrics using Performance Insights.
- Helps in monitoring active connections, SQL queries, waits, and database load trends.
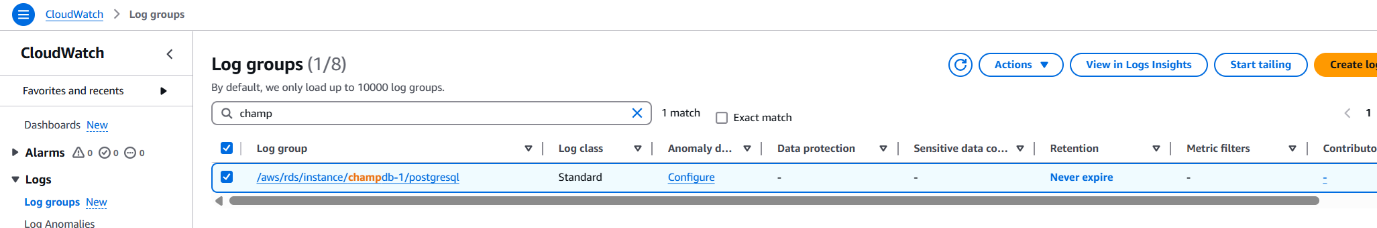
• Navigated to Amazon CloudWatch Logs: Verified that a new Log Group was created for the RDS instance.
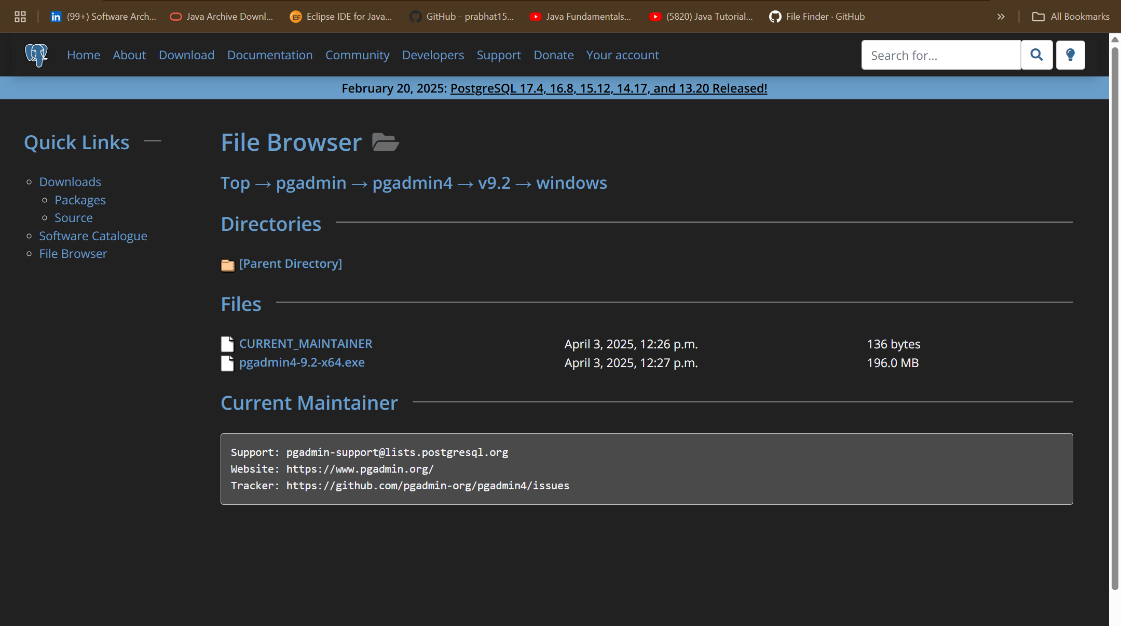
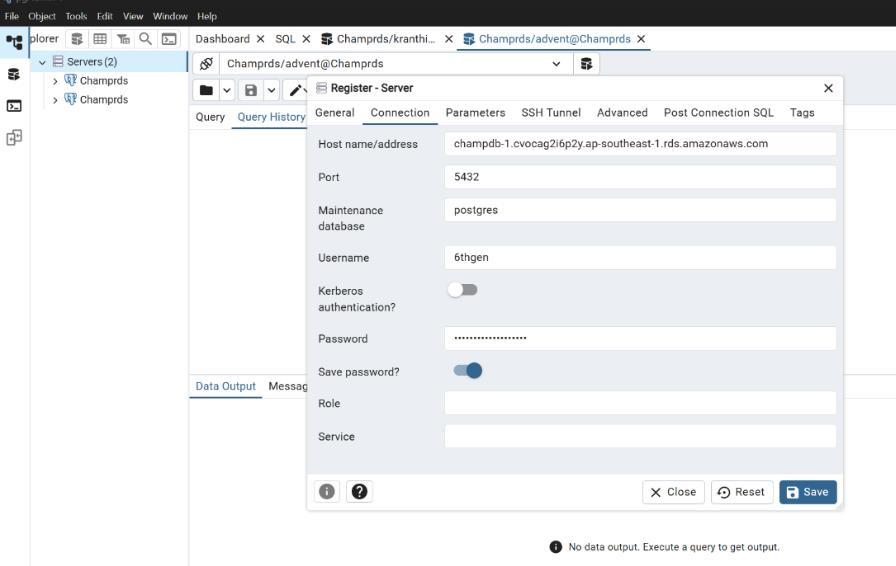
• Installed the latest version of pgAdmin from the official pgAdmin website.
Collected the following connection details from the RDS console:
- Endpoint (hostname)
- Port (5432)
- Master username and password
Database name: Champrds
In pgAdmin:Created a new server connection.
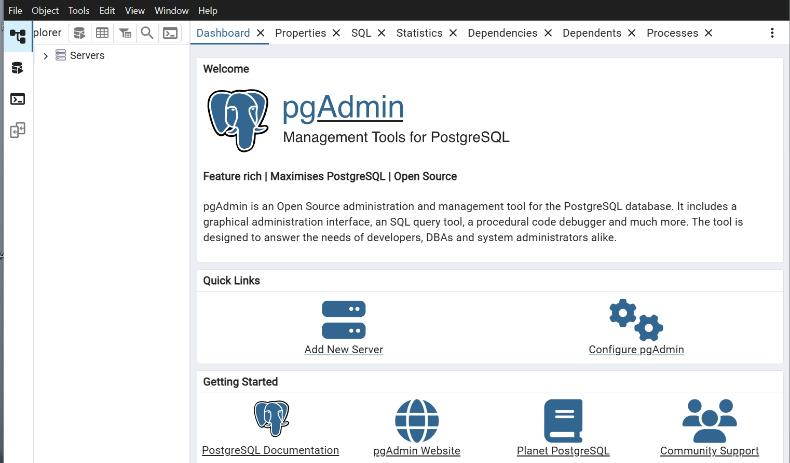
Entered the RDS endpoint and credentials.
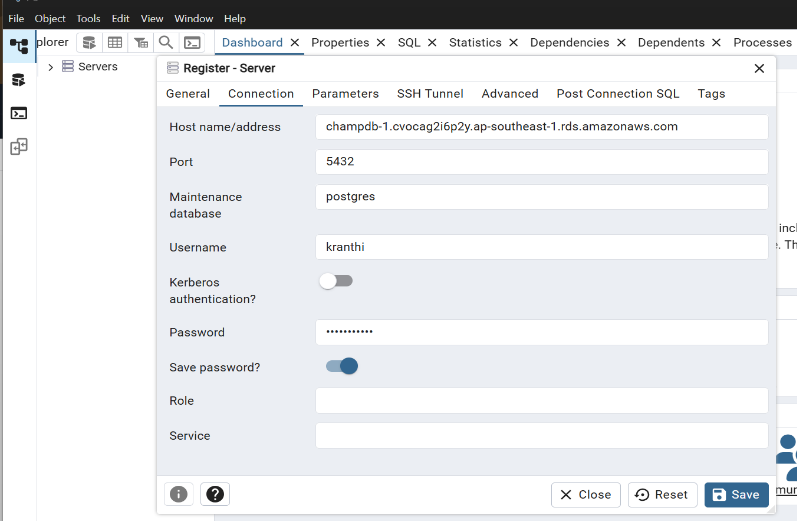
Successfully established the connection to the PostgreSQL RDS instance.
Multi-Tenancy in PostgreSQL – Concept and Use Case
What is Multi-Tenancy?
Multi-tenancy is a database architecture pattern where a single database instance serves multiple users or organizations (called tenants). Each tenant's data is isolated logically, even though they share the same infrastructure.
Why Use Multi-Tenancy?
This approach is widely adopted for:
• Cost efficiency – one DB instance for many users
• Simplified management – easier to maintain and monitor
• Scalability – add new users without deploying separate databases
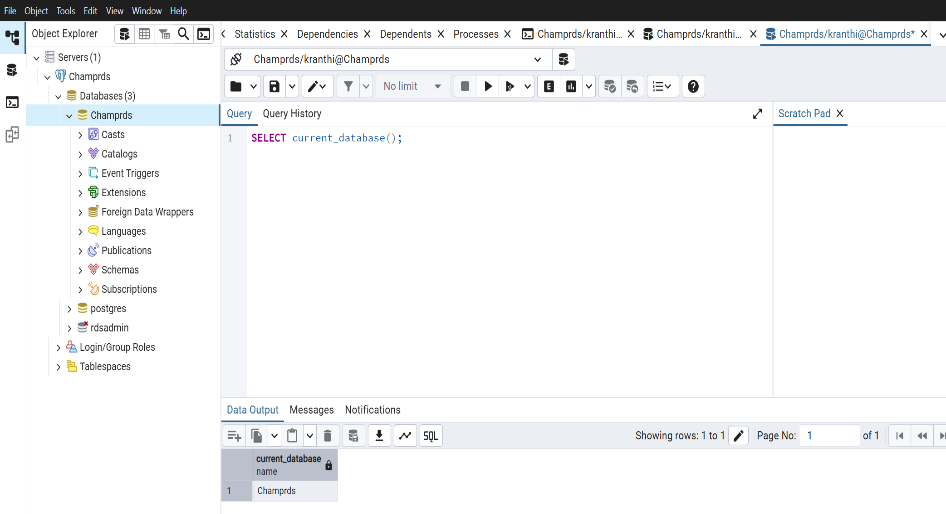
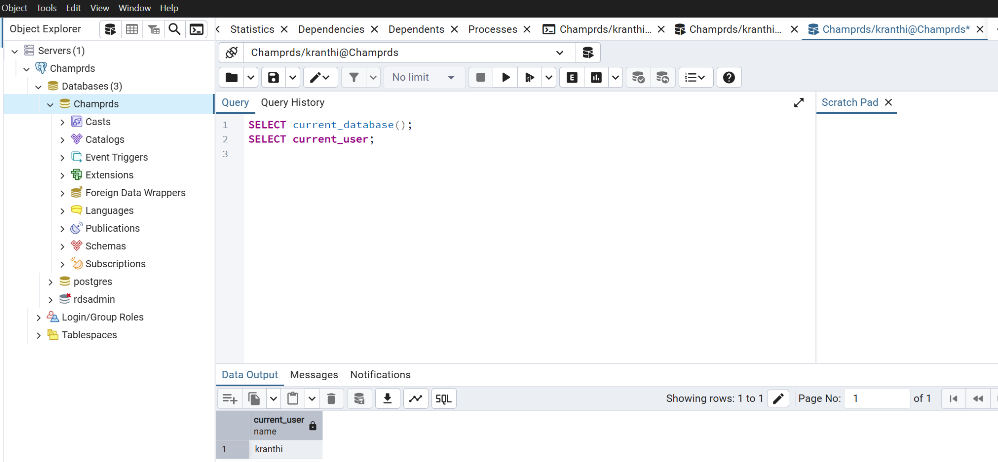
Step 1: Login as Admin
- Connect to RDS database (Champrds) using the master user credentials via pgAdmin.
Step 2: Create Tenant Users
-- Create tenant users
CREATE USER advent WITH PASSWORD 'AdventStrongPass1';
CREATE USER "6thgen" WITH PASSWORD 'SixthGenStrongPass1';
CREATE USER isalam WITH PASSWORD 'IsalamStrongPass1';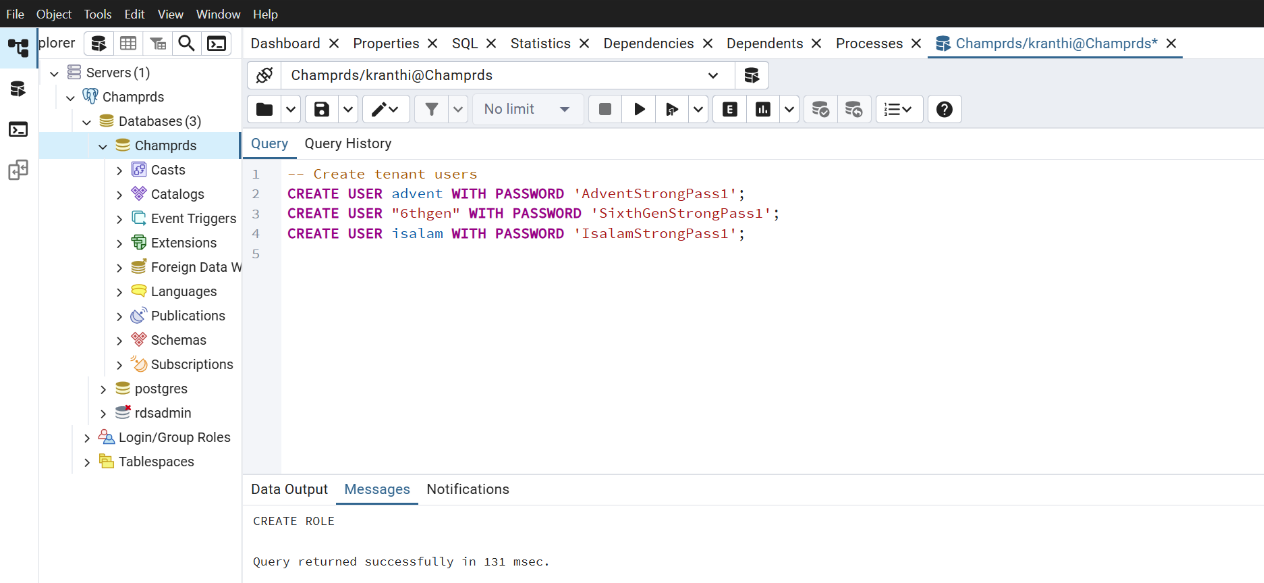
- Create Schemas For AUTHORIZATION
-- Create schemas WITHOUT the AUTHORIZATION clause
CREATE SCHEMA advent;
CREATE SCHEMA "6thgen";
CREATE SCHEMA isalam;
-- Grant access to respective users
GRANT USAGE ON SCHEMA advent TO advent;
GRANT USAGE ON SCHEMA "6thgen" TO "6thgen";
GRANT USAGE ON SCHEMA isalam TO isalam;
-- Allow tenants to create objects in their schemas
GRANT CREATE ON SCHEMA advent TO advent;
GRANT CREATE ON SCHEMA "6thgen" TO "6thgen";
GRANT CREATE ON SCHEMA isalam TO isalam;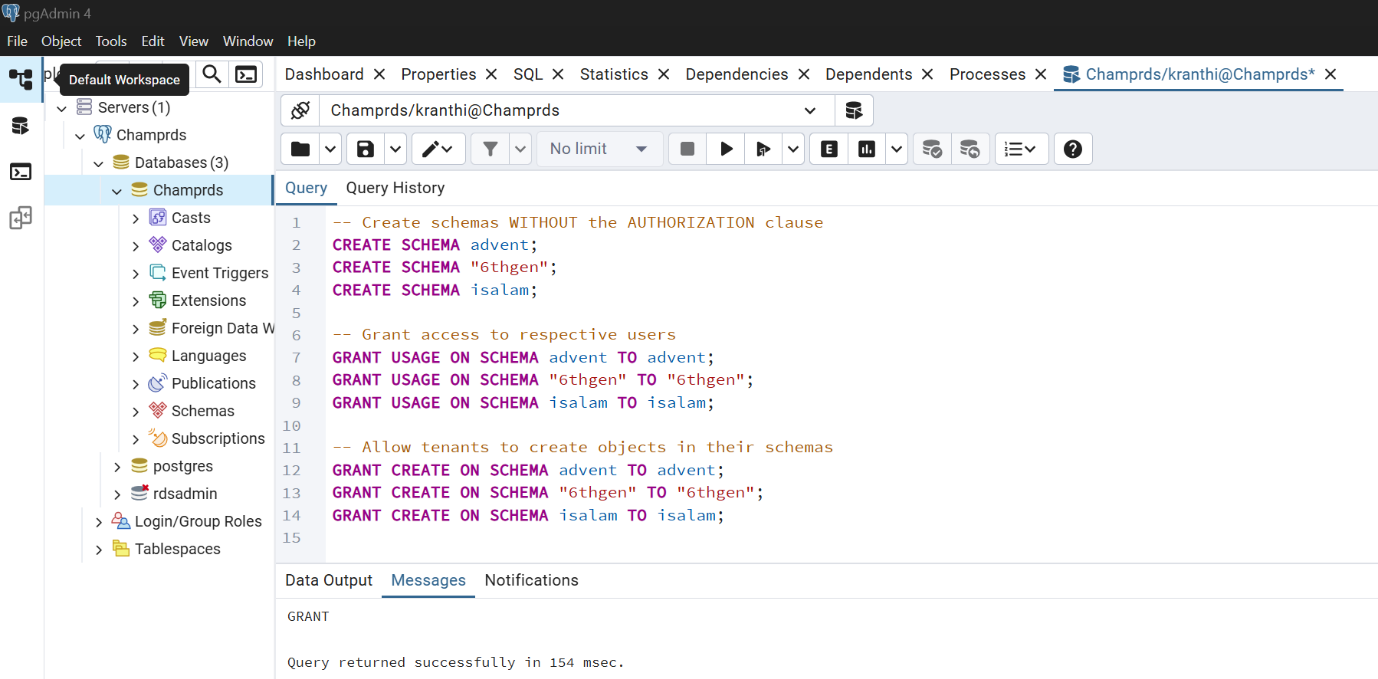
Set Default Schema for Each User (Search Path) You can set the default schema for each user, so they don’t need to set it manually:
ALTER ROLE advent SET search_path = advent;
ALTER ROLE "6thgen" SET search_path = "6thgen";
ALTER ROLE isalam SET search_path = isalam;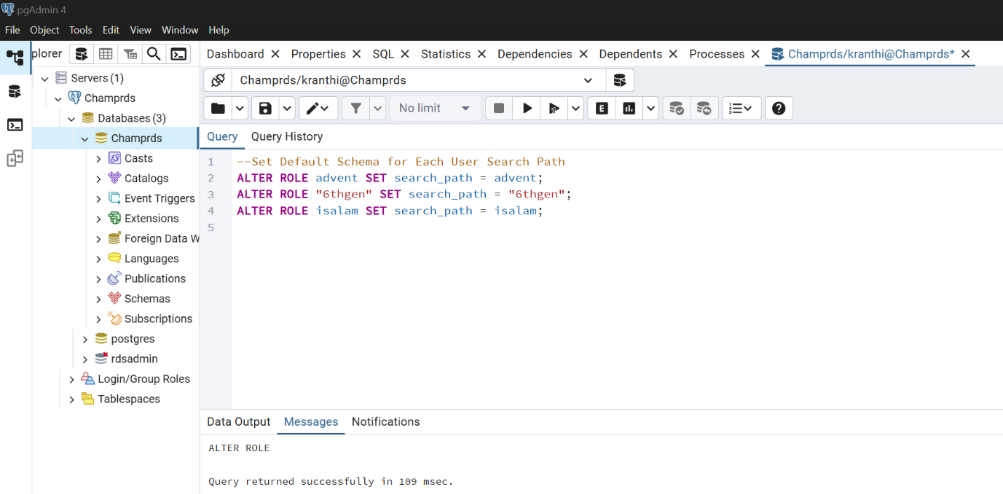
Now each user:
- Has their own schema
- Can create and use their own tables
- Won’t get into privilege issues
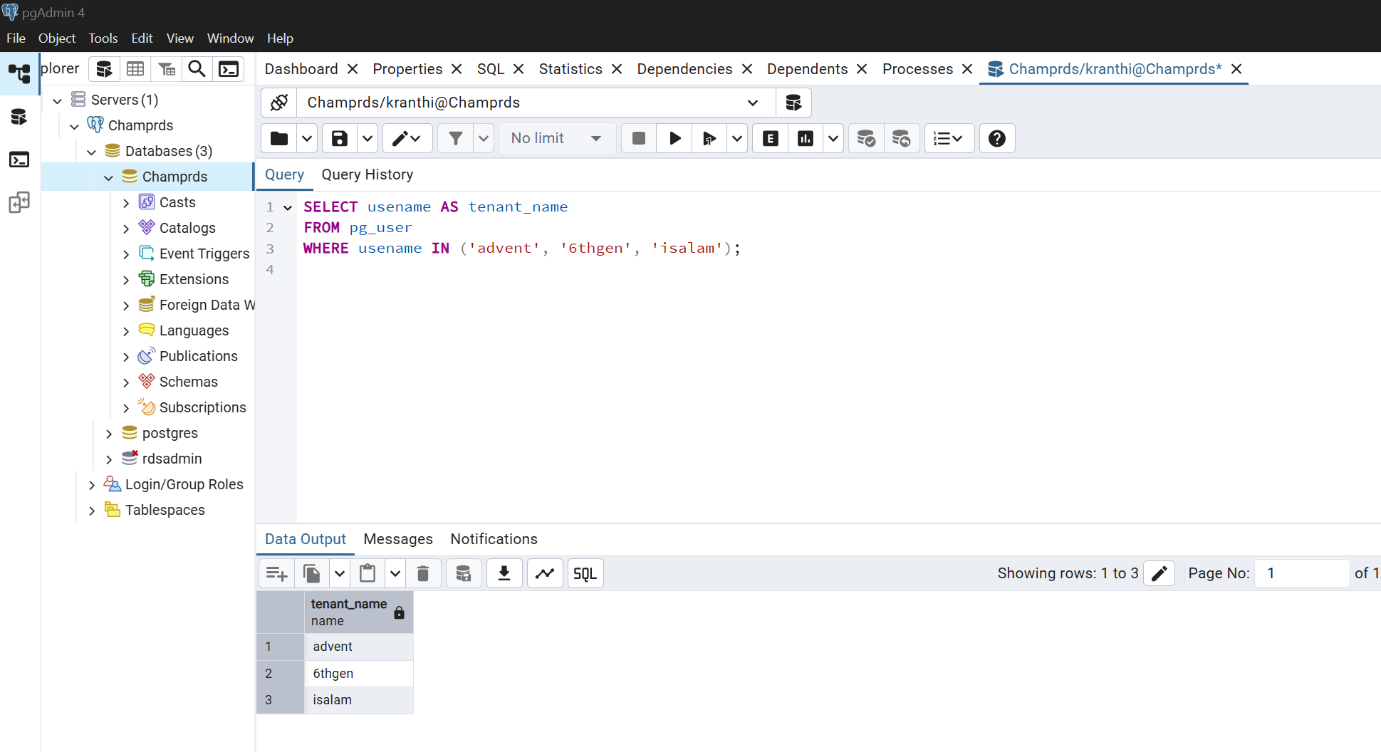
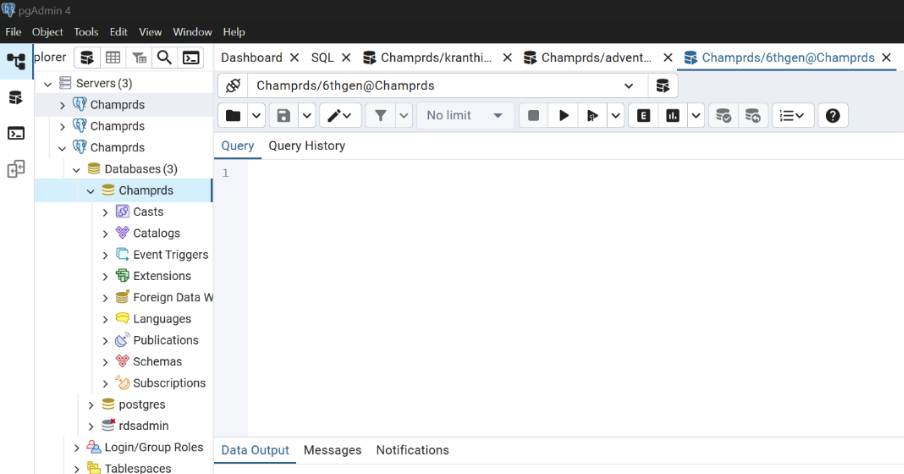
Verifying Multi-Tenant Access via pgAdmin:
Used pgAdmin to connect individually as each tenant user: 6thgen
Verified successful login and access to the shared database for all tenant users via separate sessions.
Monitoring and Analyzing Tenant Activity
- Running Sample Queries for Each Tenant
- Simulating High CPU Load & Slow Queries
- Checking Tenant-wise Usage Patterns
- Analyzing Performance with Performance Insights Dashboard
- Identifying Top Queries and High-Load Users
- Mimicking Real-Time Multi-Tenant Application Behavior
Simulate Activity for Each Tenant User
You'll now open a query tool in each tenant session and run different types of queries to simulate: Normal usage, Heavy joins, Slow queries, High CPU usage.
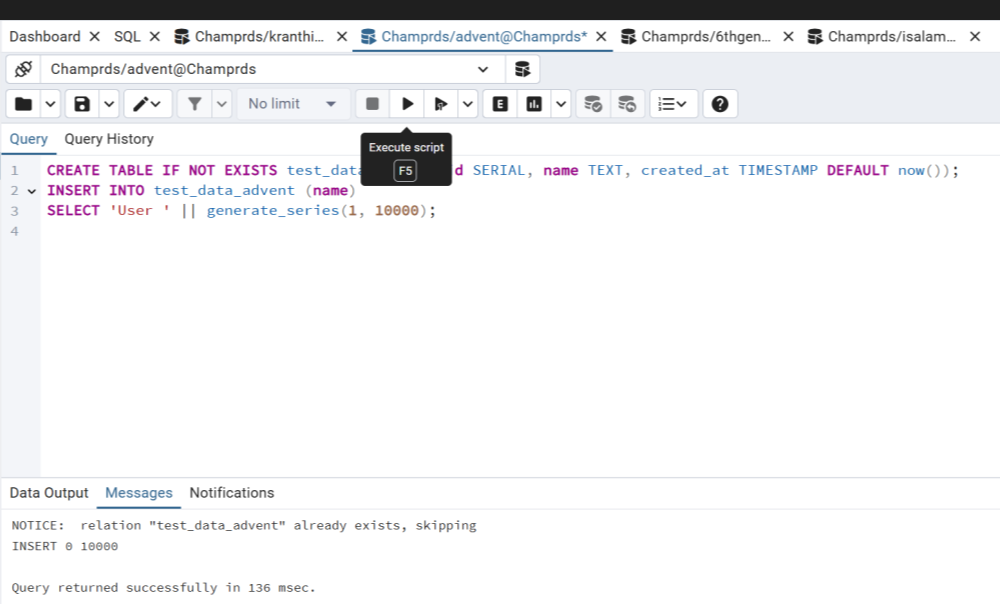
Query To Simulate moderate insert/update activity:
CREATE TABLE IF NOT EXISTS test_data_advent (id SERIAL, name TEXT, created_at
TIMESTAMP DEFAULT now());
INSERT INTO test_data_advent (name)
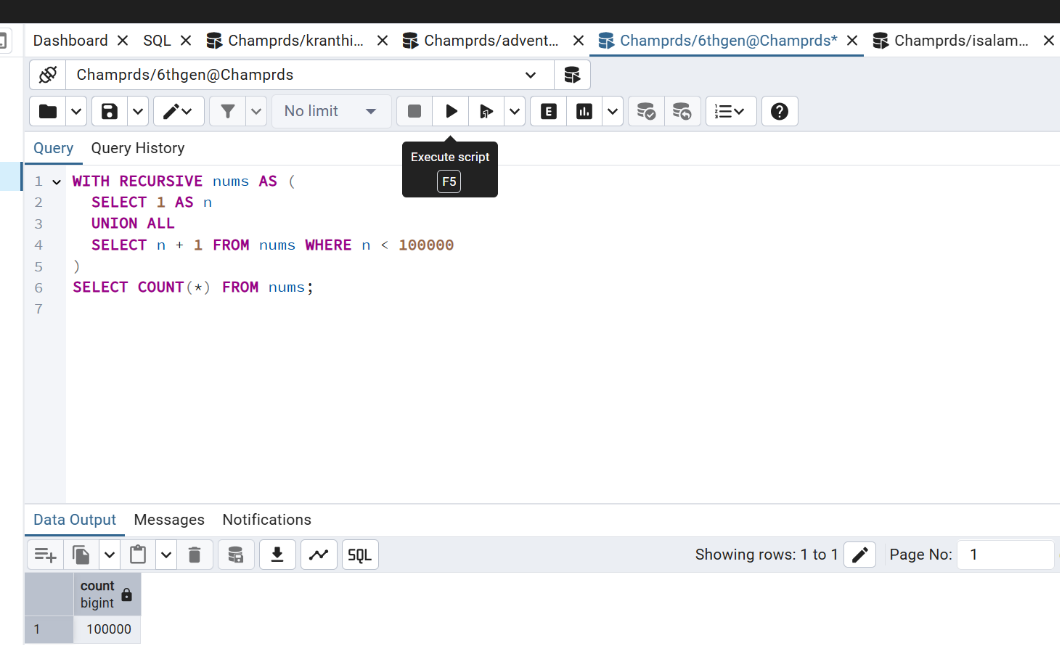
SELECT 'User ' || generate_series(1, 10000);Query To Simulate a CPU-heavy query:
WITH RECURSIVE nums AS (
 SELECT 1 AS n
 UNION ALL
 SELECT n + 1 FROM nums WHERE n < 100000
)
SELECT COUNT(*) FROM nums;
Query To Simulate a slow query using a sleep function:
SELECT pg_sleep(10);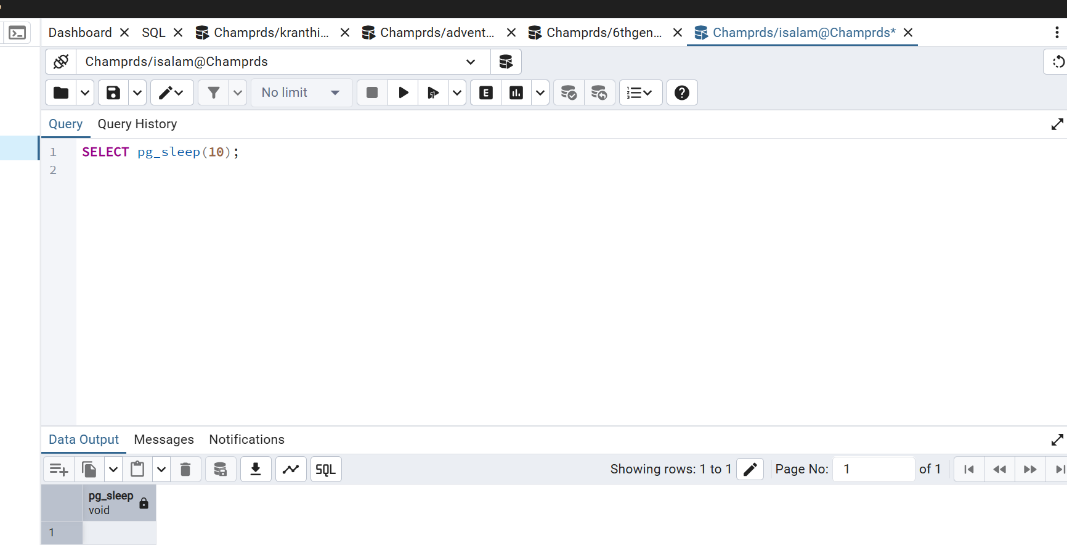
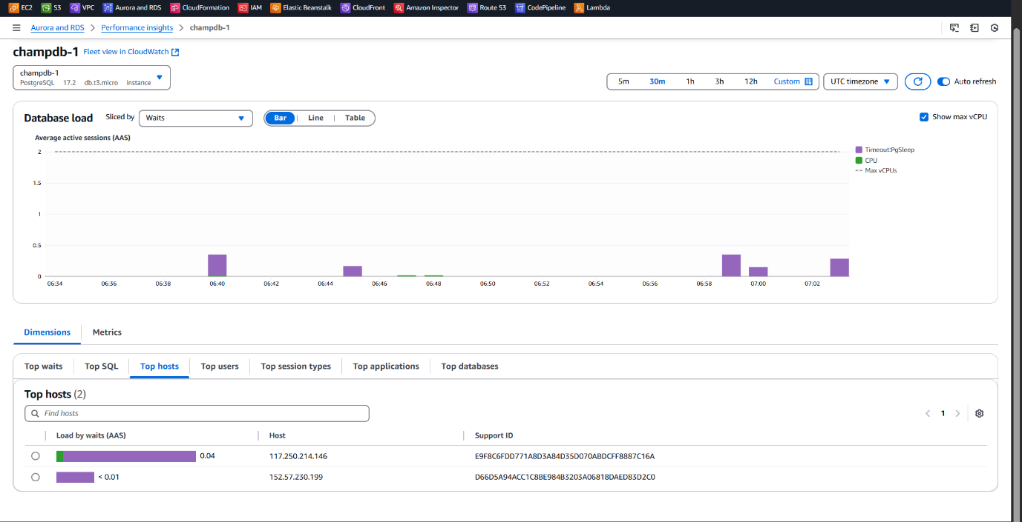
Monitoring with RDS Performance Insights:
Amazon RDS Performance Insights is a powerful tool that helps monitor and analyze database performance in real time. It provides insights into SQL queries, wait events, top resource-consuming users, and helps identify performance bottlenecks. In a multi-tenant setup, this is especially useful to observe how different tenants are impacting the database
load and optimize resource usage accordingly
*Check Performance Insights: *
Once the queries are running:
- Go to RDS > Performance Insights
- Choose your PostgreSQL RDS instance
- Check for:
- Top SQL queries
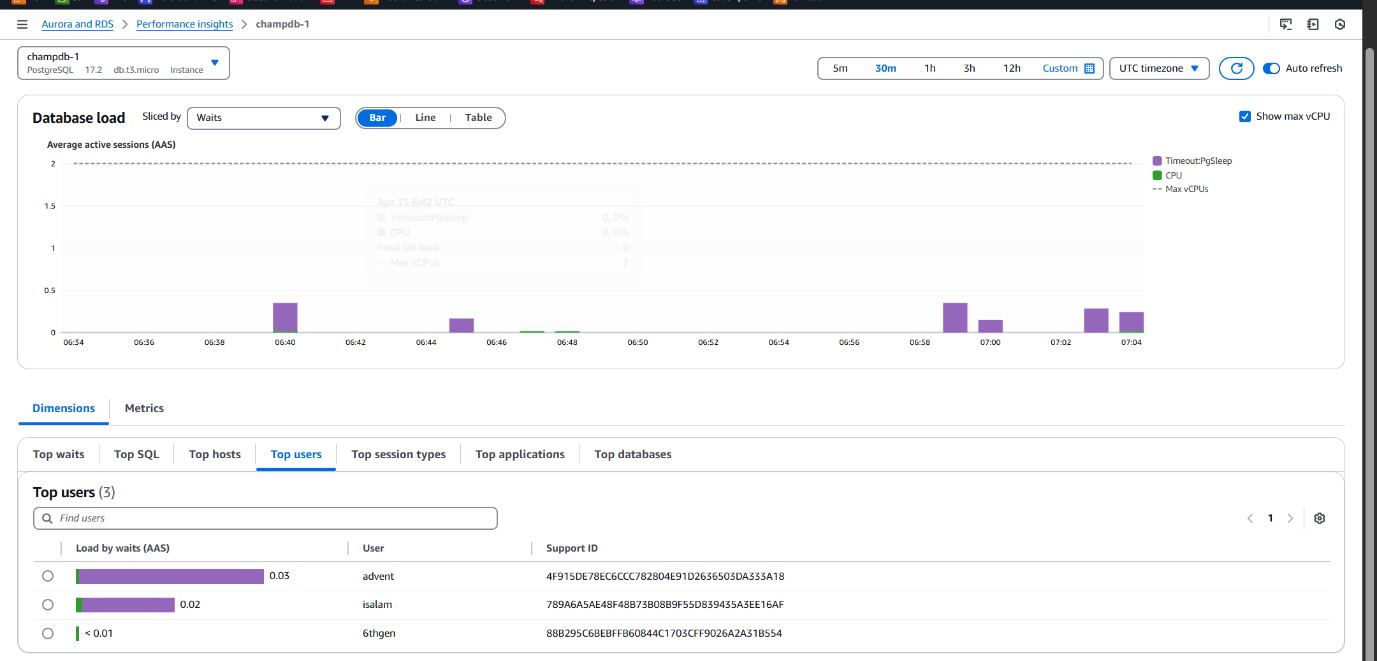
- Load by user (advent, 6thgen, isalam)
- CPU, I/O graphs You’ll see these users now show up in the “Top Load” section.
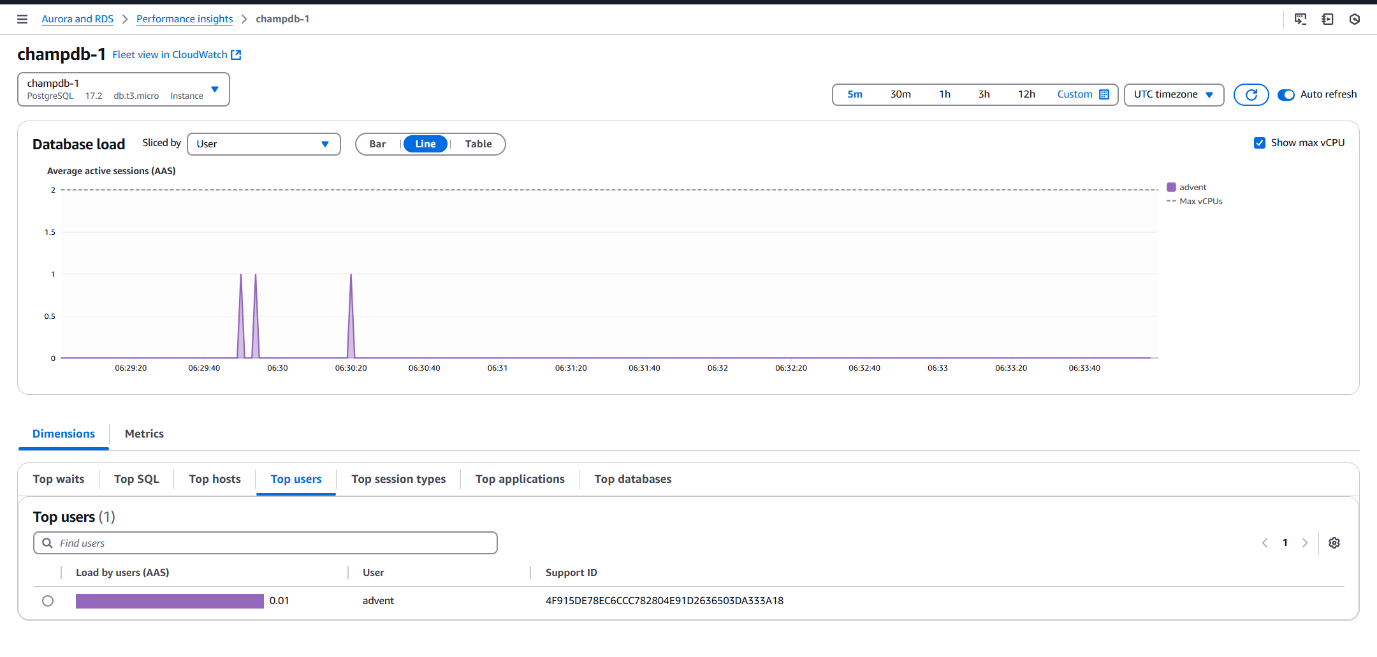
Top Users Overview:
- Performance Insights dashboard displays the top users accessing the database.
- Verified all three tenant users (advent, 6thgen, isalam) are actively visible.
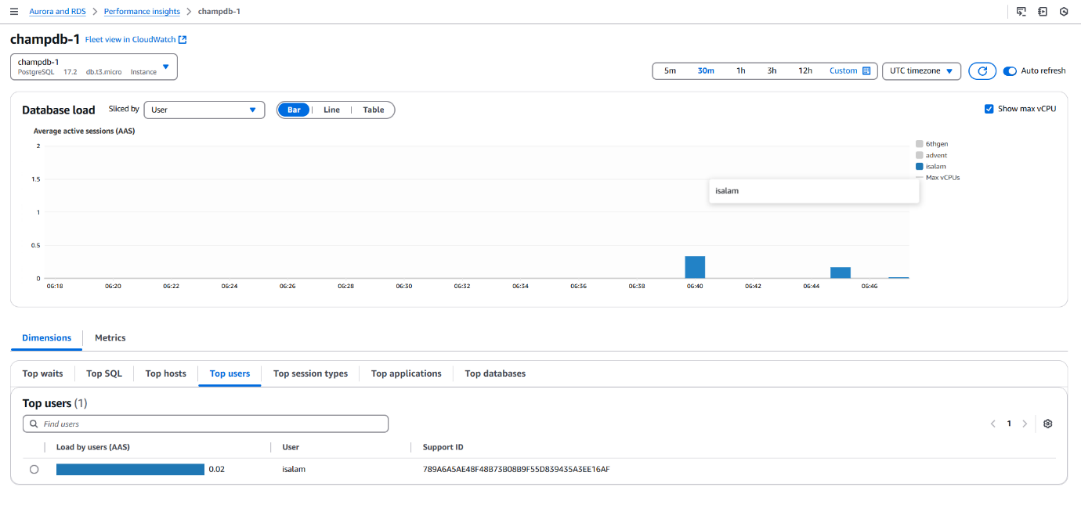
Individual User CPU Usage:
• Shows detailed CPU consumption for each user.
• Helps identify resource-heavy users or inefficient queries per tenant.

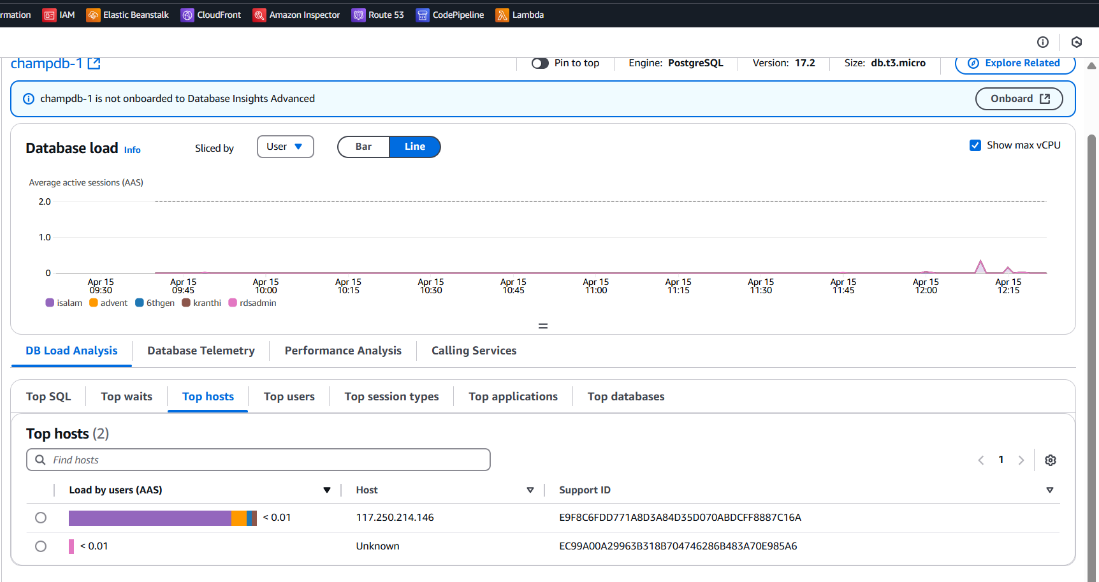
- Verified current host IP online and matched it with dashboard.
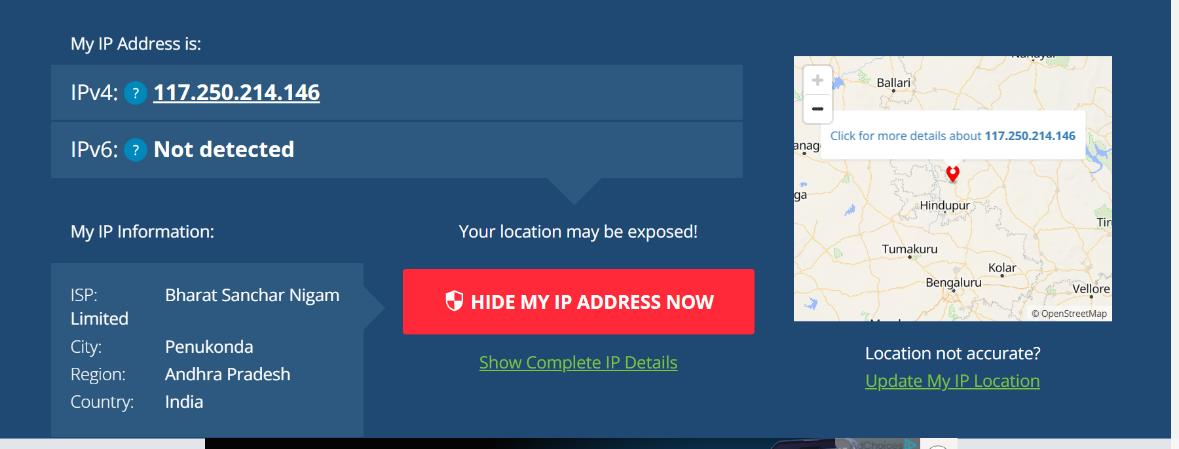
- Connected from a different network (host) by sharing user credentials
• Connected from a different network (host) by sharing user credentials. Dashboard
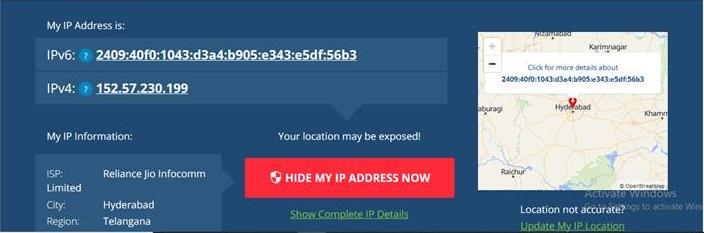
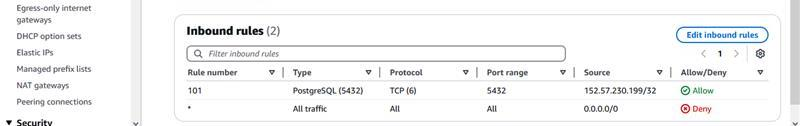
Using AWS security groups or AWS Network ACLs, we can restrict access to the RDS instance by allowing connections only from trusted IP addresses (hosts). This ensures only known networks can access the database, enhancing security in a multi-tenant setup.
ex: (optional)

Exporting RDS Logs from CloudWatch to S3 and Analyzing with Athena:
The main goal is to make RDS logs easily accessible and queryable for operational insights, debugging, and audit trails. By exporting logs from CloudWatch to Amazon S3 and integrating with Athena, we can run SQL queries on log data without maintaining infrastructure—providing a serverless, cost-effective, and scalable analytics solution
Approach:
To achieve this, two methods were used:
1. AWS Glue Integration:
- Set up a Glue Crawler to scan and catalog log data in S3.
- Created a Glue ETL Job to transform logs for structured querying.
- Integrated the cataloged data with Athena for optimized analysis.
2. Direct Athena Table Setup:
- Used Athena to directly point to the S3 bucket containing exported logs.
- Created an external table by specifying the log file format and S3 path.
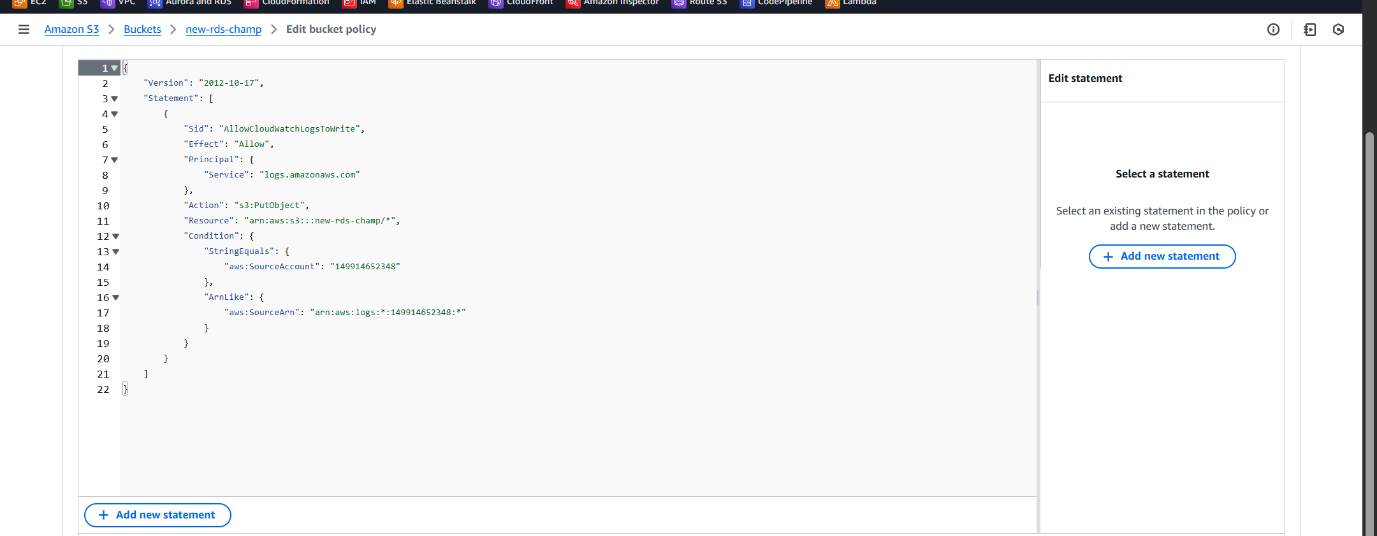
Pre-requisites:
- Create an Amazon S3 bucket to store exported RDS logs from CloudWatch.
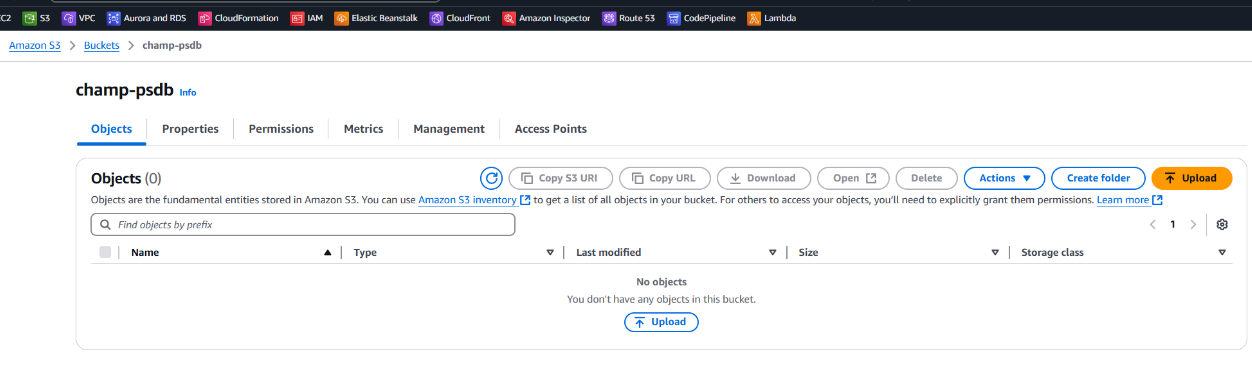
- Attach the appropriate bucket policy to allow CloudWatch Logs to write data to the S3 bucket.
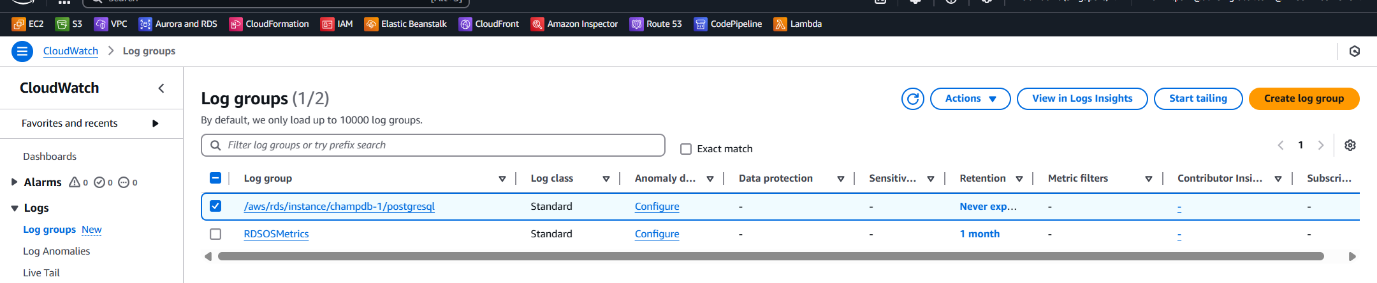
Steps to Export RDS Logs from CloudWatch to Amazon S3:
- Go to CloudWatch > Logs > Log groups
/aws/rds/instance/champdb-1/postgresql
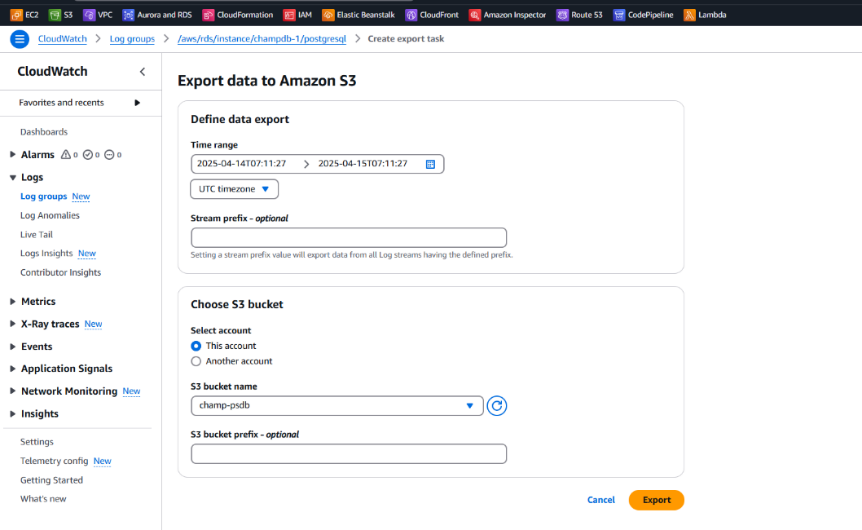
Create an Export Task from CloudWatch:
- Go to the slowquery log group
- Click “Actions” → Export Data to Amazon S3
Choose:
- Time range (based on requirement)
- Target S3 bucket and prefix (folder)
- Start export
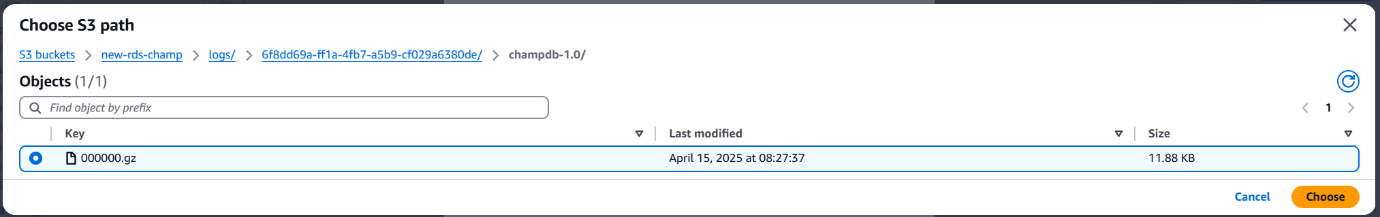
- It will create a folder in your S3 like:
Transforming RDS Logs with AWS Glue ETL for Structured Analysis
*AWS Glue *
Amazon Glue is a fully managed ETL (Extract, Transform, Load)
service that helps prepare and transform data for analytics. It
integrates with S3, Athena, and the Glue Data Catalog, making it easy to automate data pipelines and query structured data.
** Problem:**
After exporting RDS logs from CloudWatch Logs to Amazon S3, the files are in .gz compressed text format.
AWS Glue Crawlers do not support parsing .gz plain text files directly for schema inference.
AWS Glue supports formats like JSON, CSV, Parquet, Avro, and ORC etc.
This limits our ability to use Glue Data Catalog or Athena for querying logs efficiently.
Solution:
- We created an AWS Glue ETL Job to transform .gz log files into structured JSON format.
- JSON format is fully supported by Glue, allowing schema detection and query execution in Athena.
Benefits of Using Glue ETL:
- Automates the transformation of raw logs into readable formats.
- Enables seamless querying in Amazon Athena for log analysis.
- Mimics real-world operational use cases like monitoring slow queries, high CPUusage, or user access patterns.
- Supports building dashboards in tools like Amazon QuickSight using structured log data.
ETL Job Creation for Log Format Transformation
To convert exported .gz log files from CloudWatch into a JSON-compatible format that AWS Glue can process for querying in Athena.
Steps to Create ETL Job:
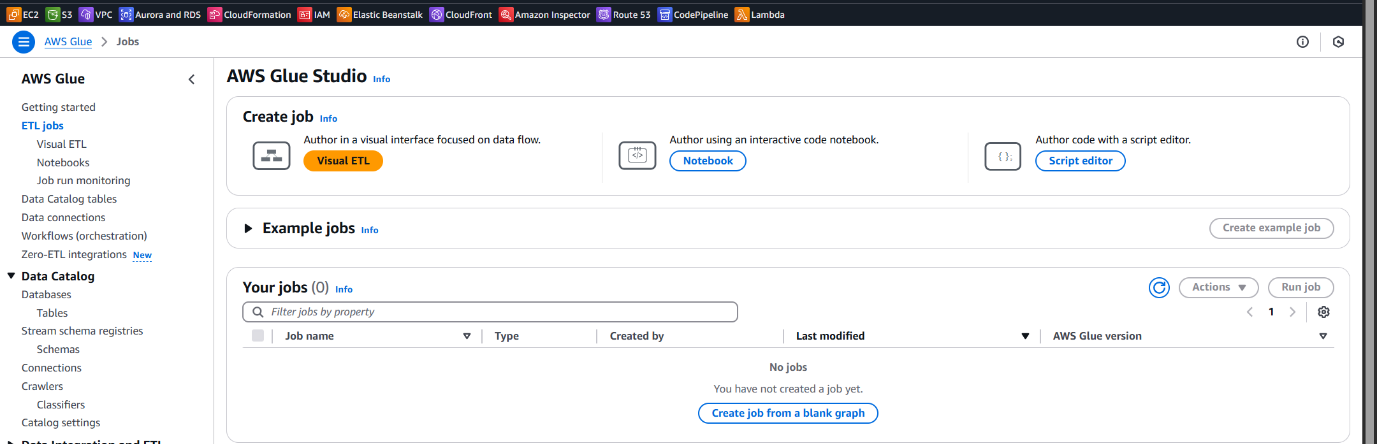
1.Go to AWS Console, search and open AWS Glue, then select "Jobs" under the ETL section.
2.Click “Add job” and choose “Script editor” to manually write the ETL script.
Other available options:
- Visual ETL – Drag-and-drop interface, ideal for quick workflows.
- Notebook – Use Jupyter-style interactive environment for advanced development.
In the script editor:
- Wrote and added a transformation script to parse .gz text logs to structured JSON.
- Gave a job title for identification.
- Selected Spark as the engine.
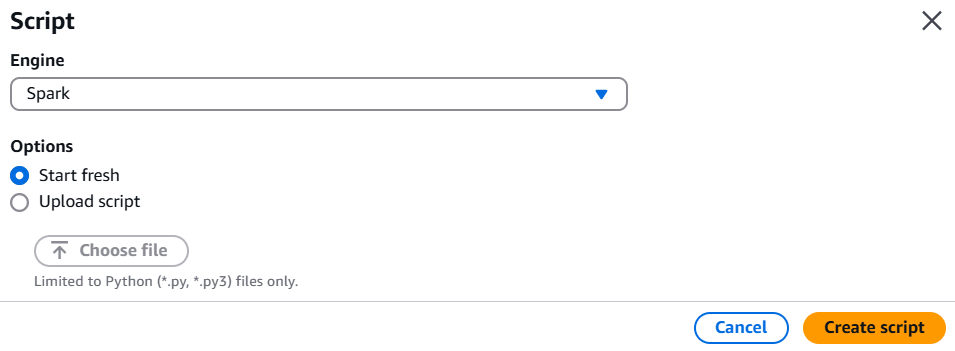
- Wrote and added a transformation script to parse .gz text logs to structured JSON.
import sys
import boto3
import gzip
import json
import re
from io import BytesIO
# Initialize the Glue context
from awsglue.context import GlueContext
from pyspark.context import SparkContext
sc = SparkContext()
glueContext = GlueContext(sc)
# S3 Bucket and Paths for Input and Output
input_s3_bucket = 'new-rds-champ'
input_s3_key = 'logs/6f8dd69a-ff1a-4fb7-a5b9-cf029a6380de/champdb-1.0/000000.gz'
output_s3_bucket = 'new-rds-champ'
output_s3_key = 'parsed_logs/output/'
# Read the .gz file from S3
def read_gz_file_from_s3(bucket, key):
 s3 = boto3.client('s3')
 obj = s3.get_object(Bucket=bucket, Key=key)
 gzipped_content = obj['Body'].read()
 with gzip.GzipFile(fileobj=BytesIO(gzipped_content), mode='rb') as f:
 return f.read().decode('utf-8')
# Parse the log line to extract timestamp, IP, log_level, and message using regex
def parse_log_line(log_line):
 # Example regex: Modify based on your log format
 log_pattern =
r'(?P\S+)\s+(?P\S+)\s+(?P\S+)\s+(?P.+)'
 match = re.match(log_pattern, log_line)

 if match:
 return match.groupdict()
 return None
# Read the gzipped file from S3
log_data = read_gz_file_from_s3(input_s3_bucket, input_s3_key)
# Split the data into lines and parse each line
parsed_logs = []
for log_line in log_data.splitlines():
 parsed_log = parse_log_line(log_line)
 if parsed_log:
 parsed_logs.append(parsed_log)
# Write the parsed logs to S3 as JSON
def write_parsed_logs_to_s3(bucket, key, parsed_logs):
 s3 = boto3.client('s3')
 json_data = json.dumps(parsed_logs)
 s3.put_object(Bucket=bucket, Key=key, Body=json_data)
# Output path for parsed logs
output_s3_path = f'{output_s3_key}parsed_logs.json'
write_parsed_logs_to_s3(output_s3_bucket, output_s3_path, parsed_logs)
print(f"Parsed logs successfully written to: s3://{output_s3_bucket}/{output_s3_path}")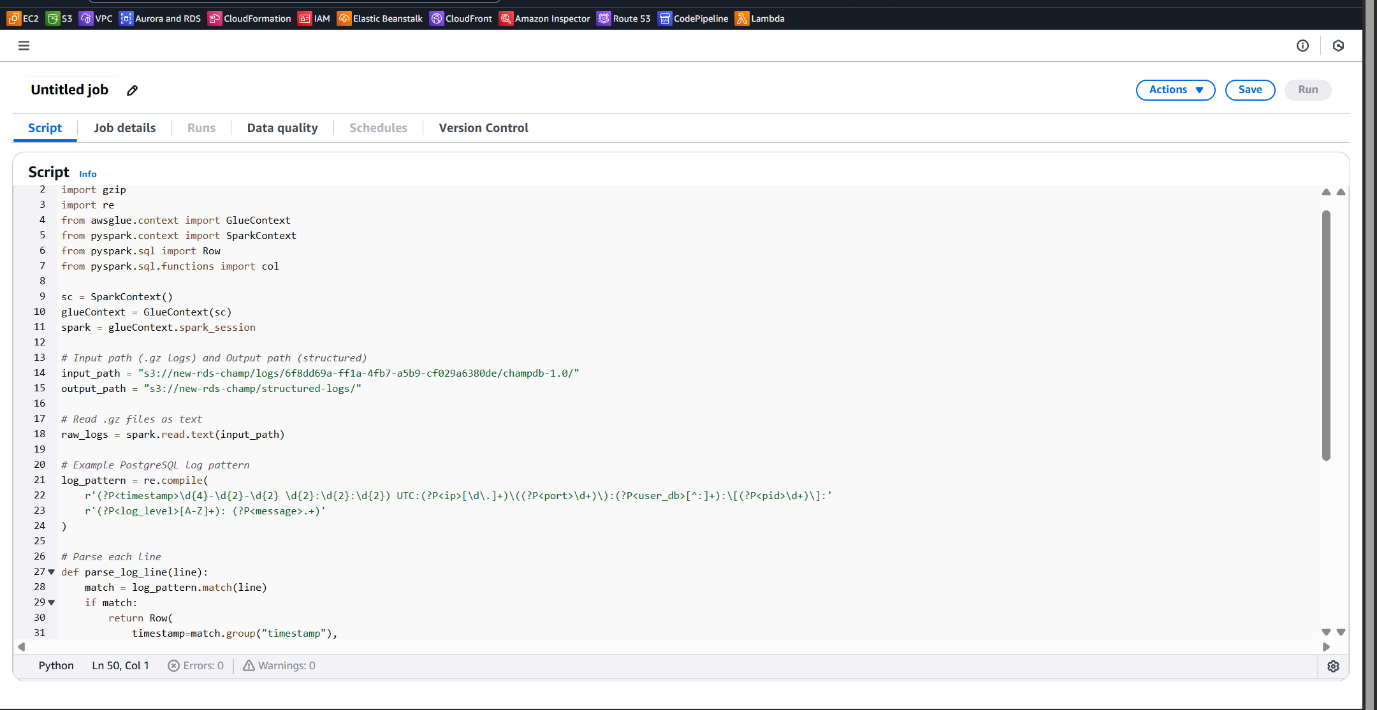
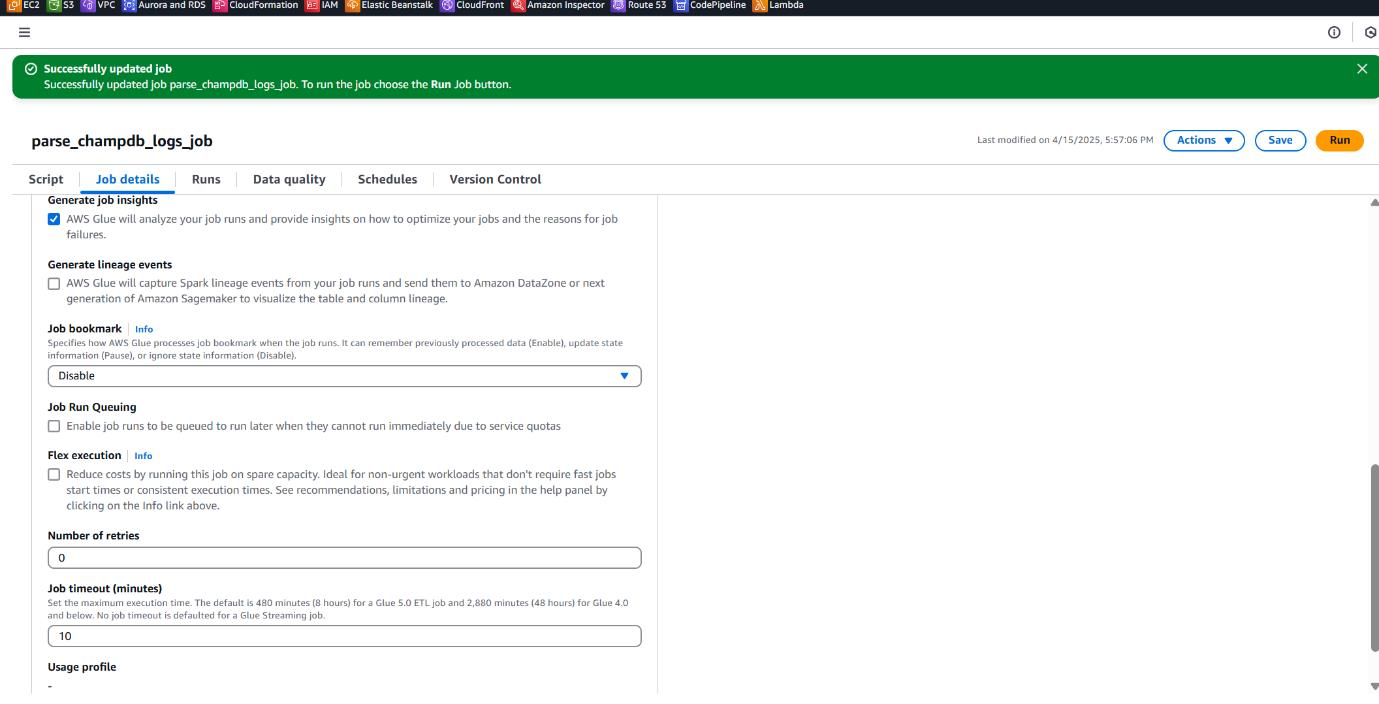
- Gave a job title for identification.
- Provided an appropriate IAM Role with access to S3 and Glue.
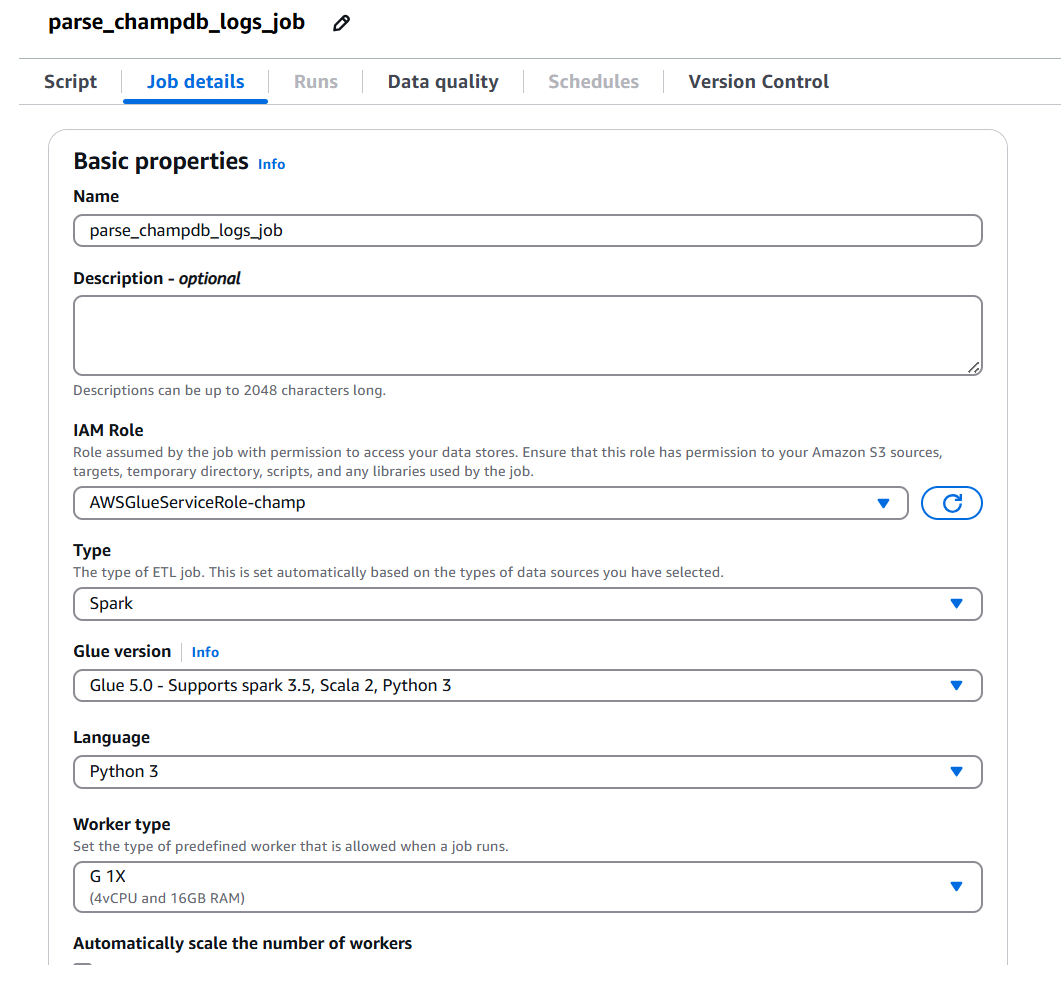
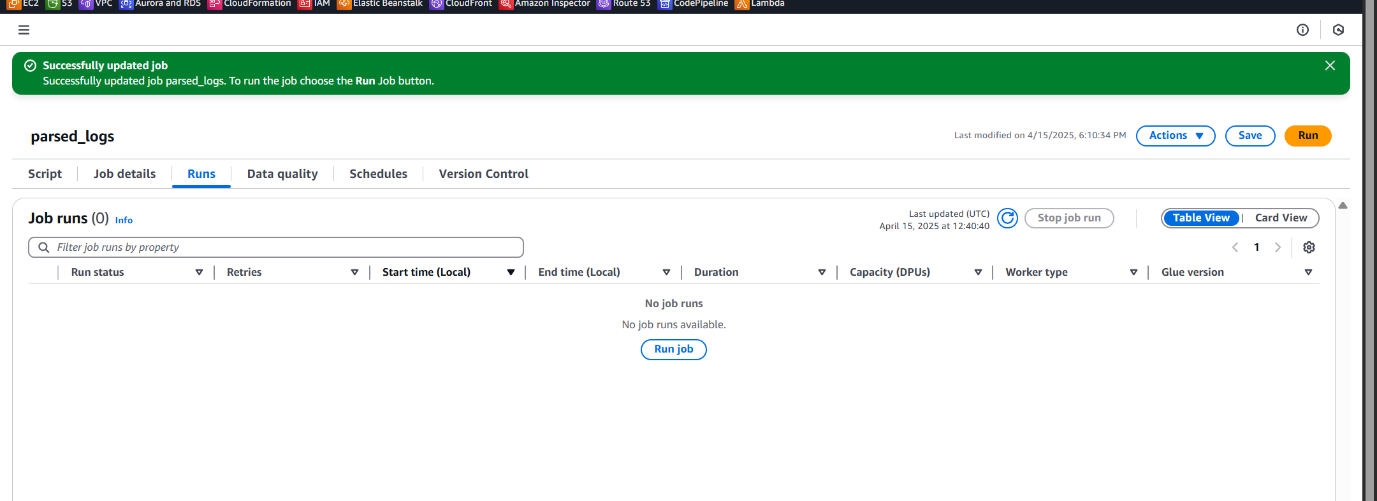
• Updated and ran the job successfully.
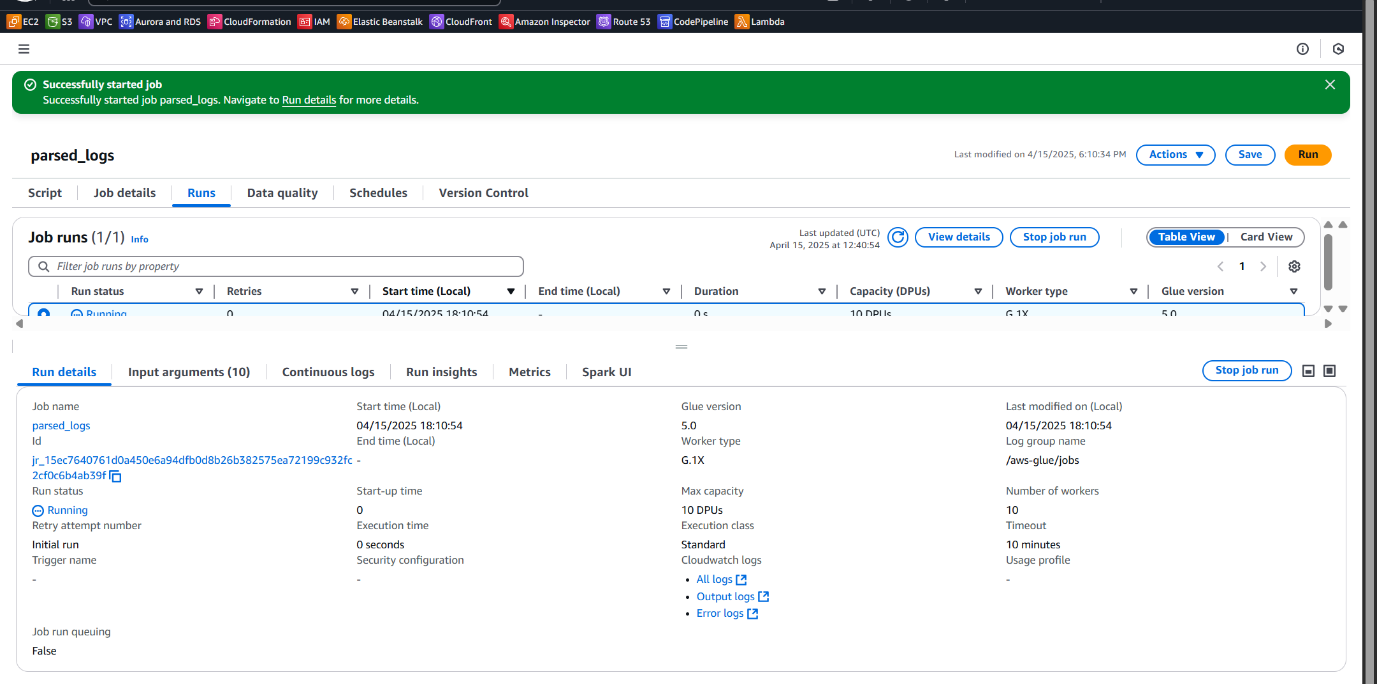
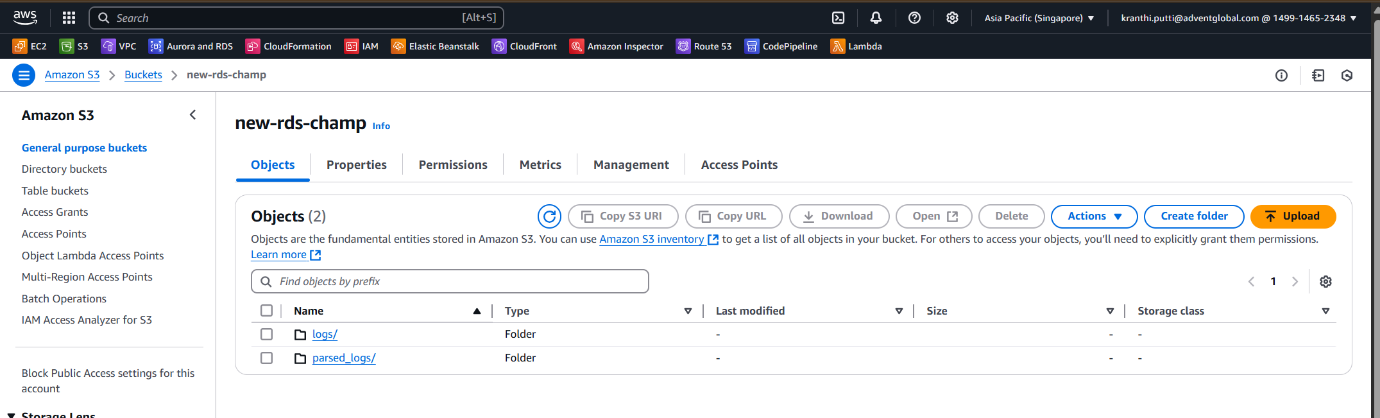
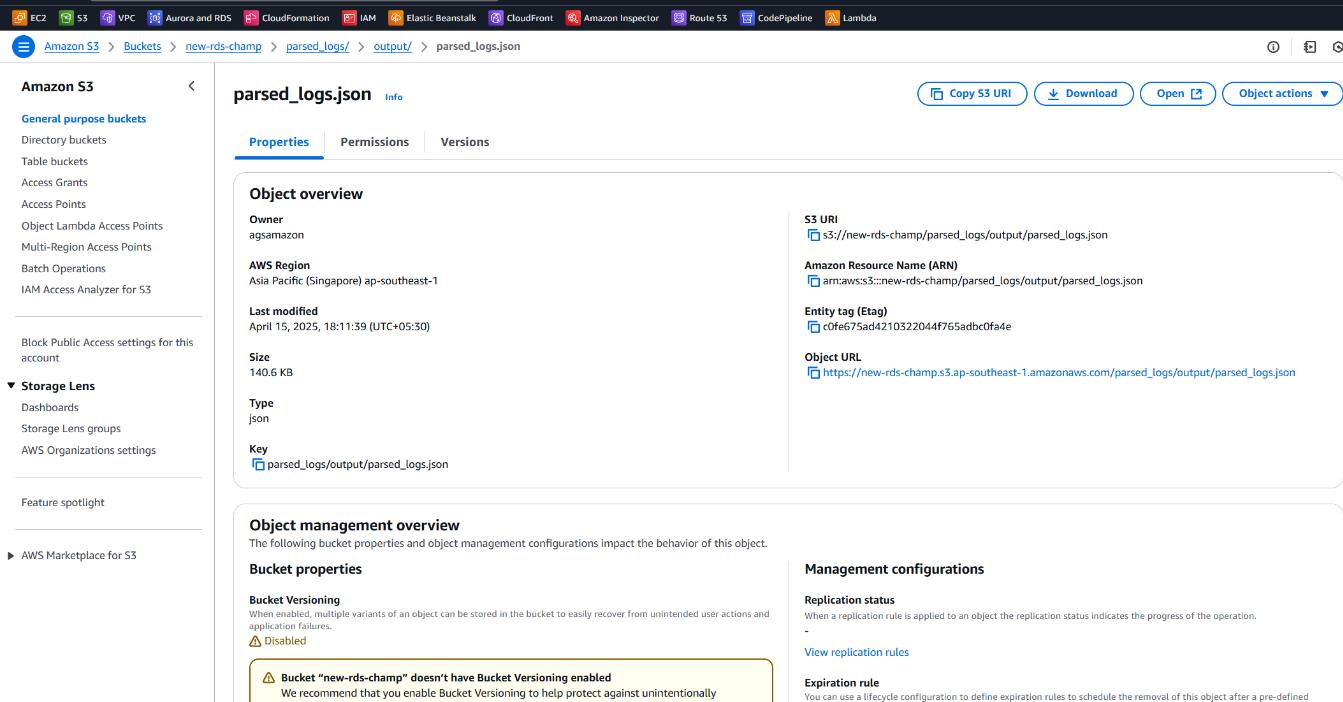
After completion:
A new folder was created in S3 (parsed_log/).
Inside that folder, parsed and structured log files were saved (parsed_logs.json).
Creating Glue Database for Athena Integration
Purpose:
To catalog and manage structured metadata from parsed S3 data, enabling Athena to run SQL queries on it.
- Go to AWS Console, search and open AWS Glue.
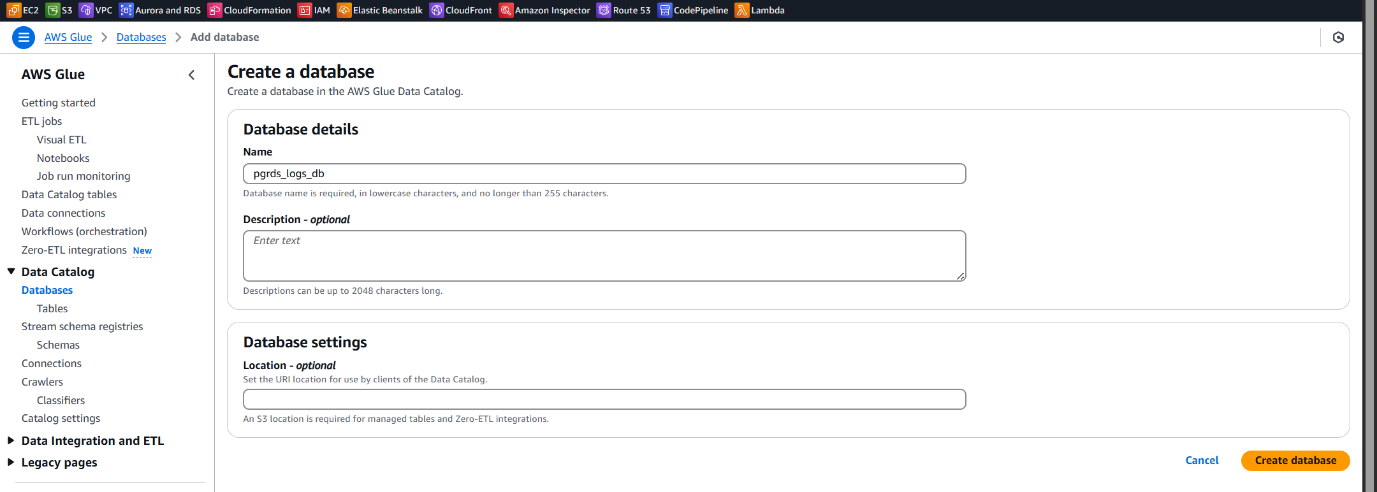
- In the Databases section, click “Add database”.
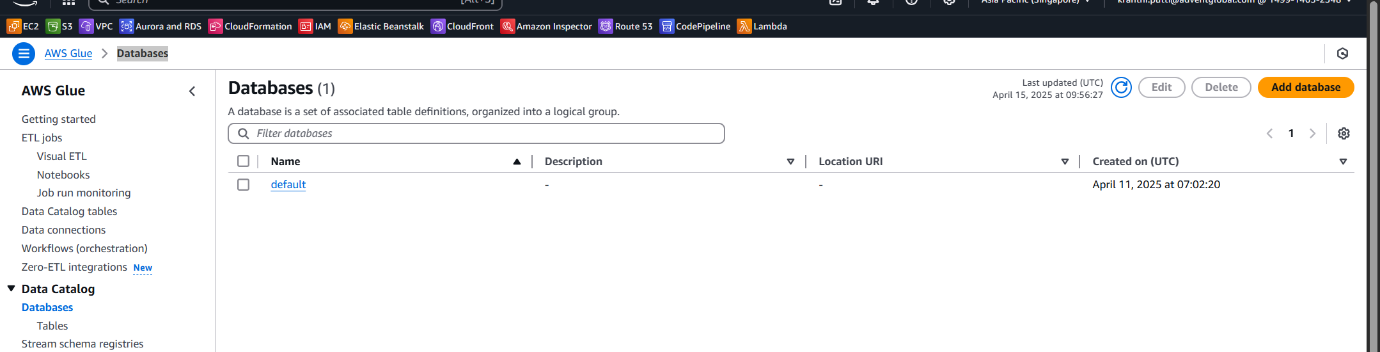
- Provide a name for the Glue database (e.g., rdslogdb) and click Create.
- This database will be used as the metadata catalog for Athena to reference and query the structured log data stored in S3.
Creating Glue Crawler to Catalog Parsed RDS Logs
Purpose:
To automatically scan the structured JSON files in S3 (created via ETL job), detect schema, and populate the Glue Data Catalog for Athena querying.
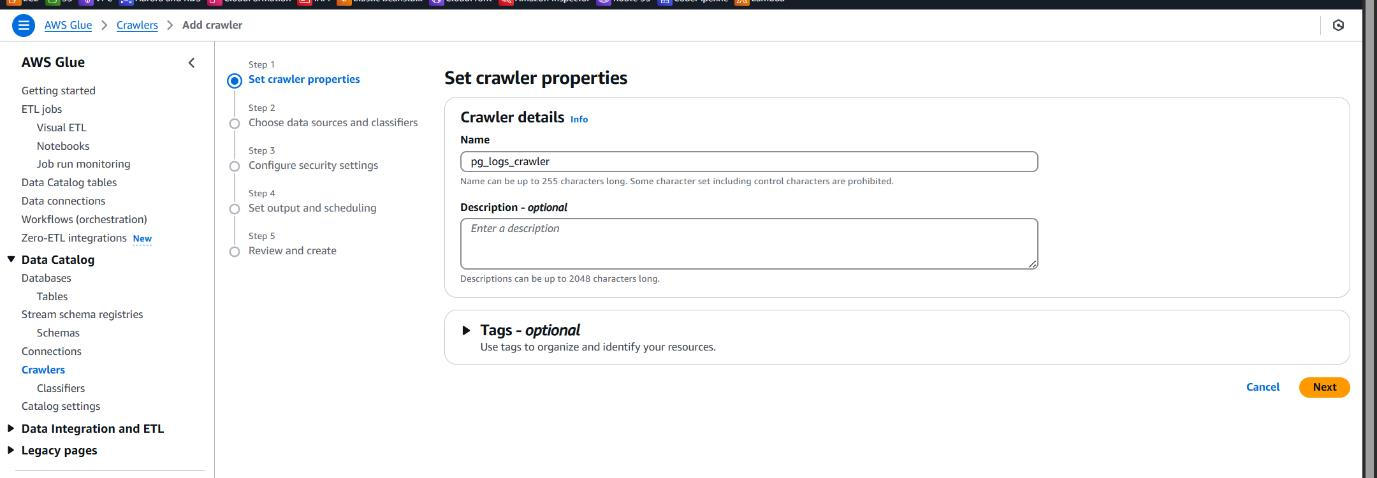
• Go to AWS Glue, select Crawlers, and click “Create crawler”.
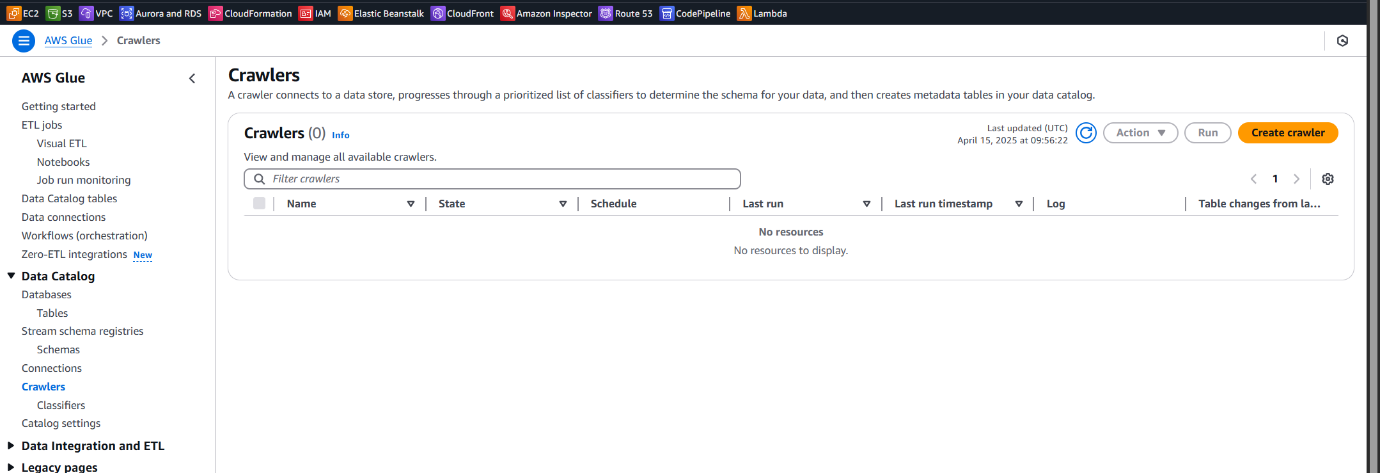
Crawler Properties: Provide a name for the crawler ( rds-log-crawler).
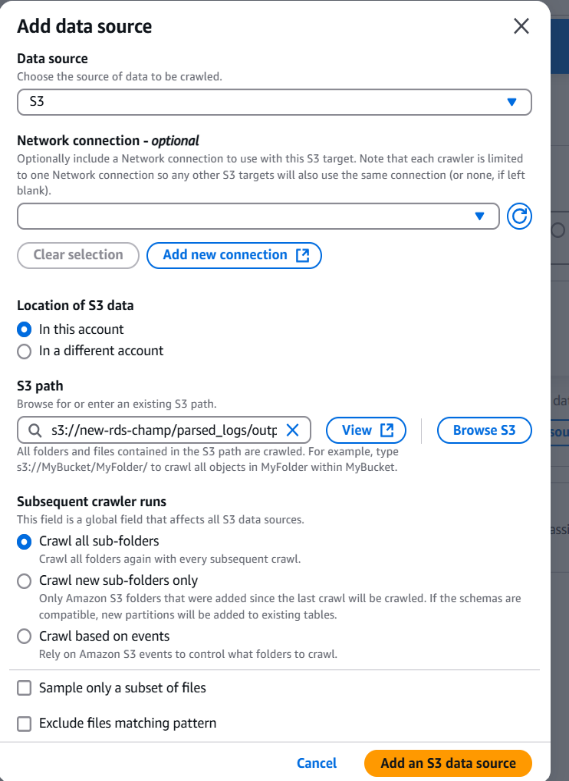
Choose Data Source:
• Select S3 as the data source and give the path to the parsed logs folder generated by the ETL job.
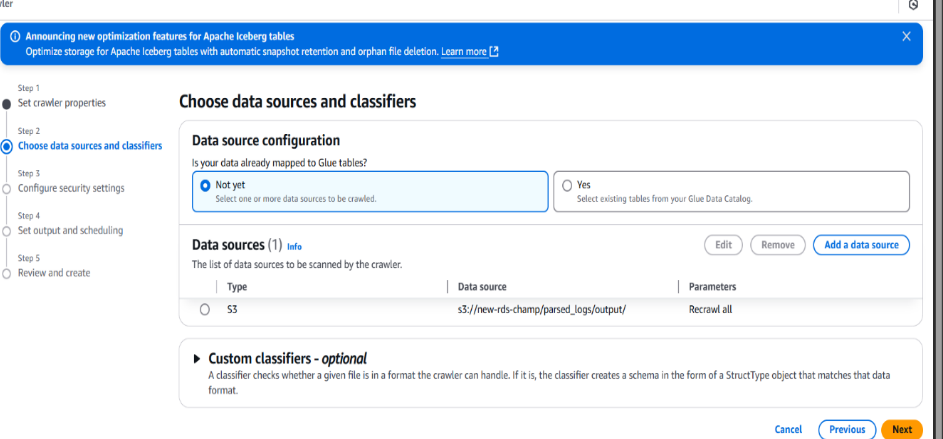
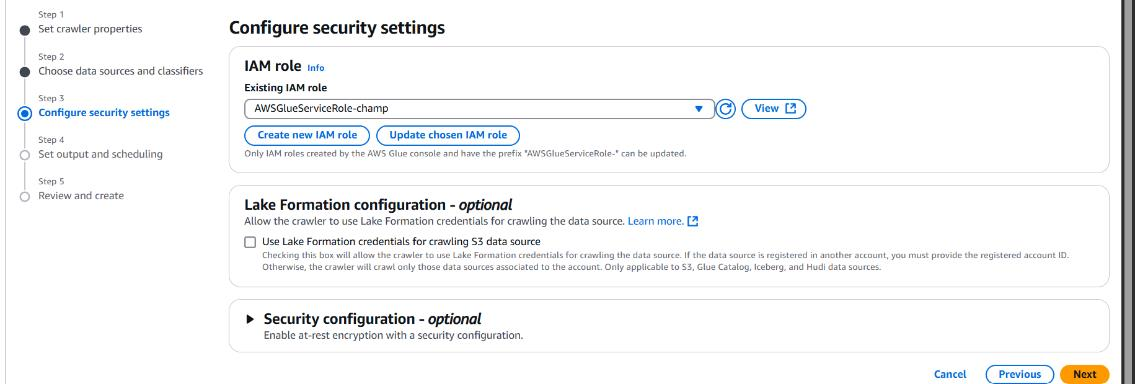
• Select the IAM role with necessary permissions.
Set Output and Scheduling:
• Choose the target database (e.g., rdslogdb) created earlier.
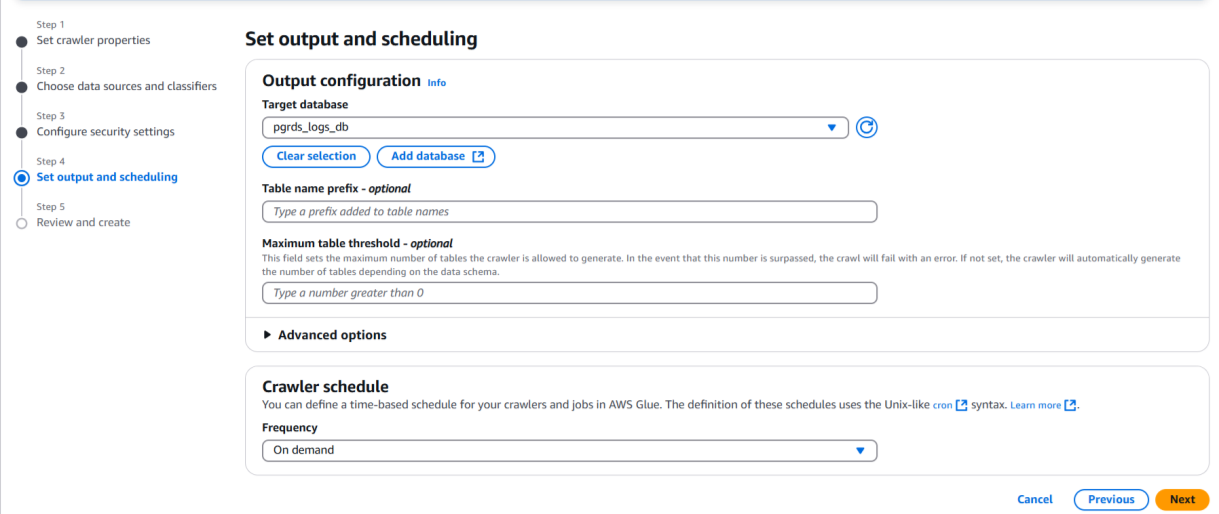
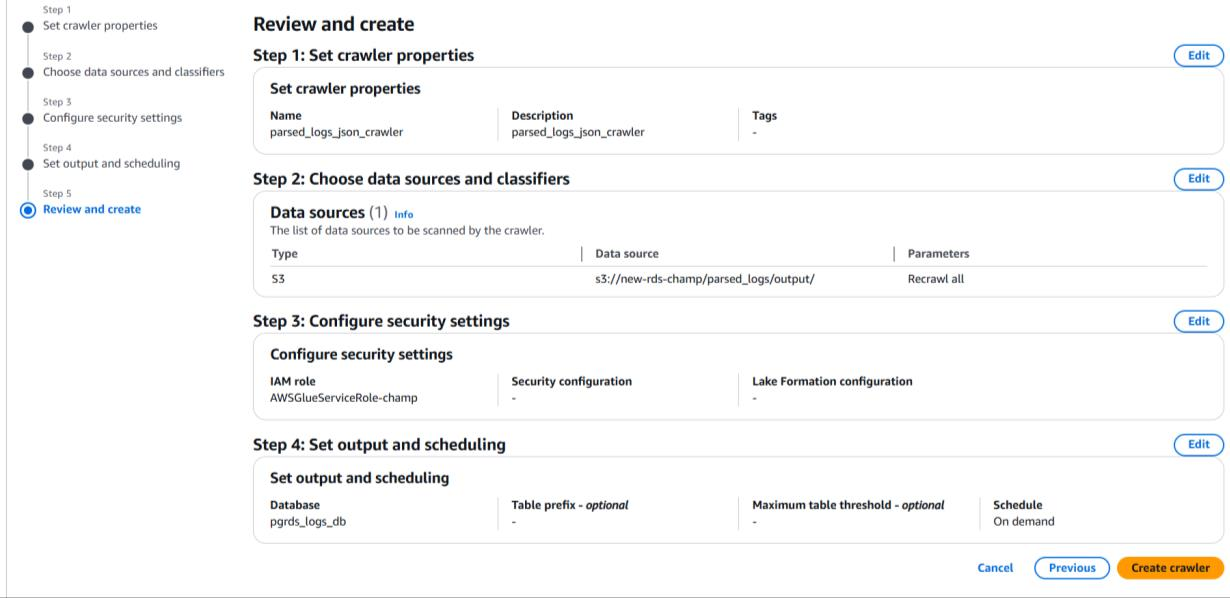
Review and Create:
• Confirm the details and click Create crawler
• After creating the crawler, select it from the list and click "Run crawler".
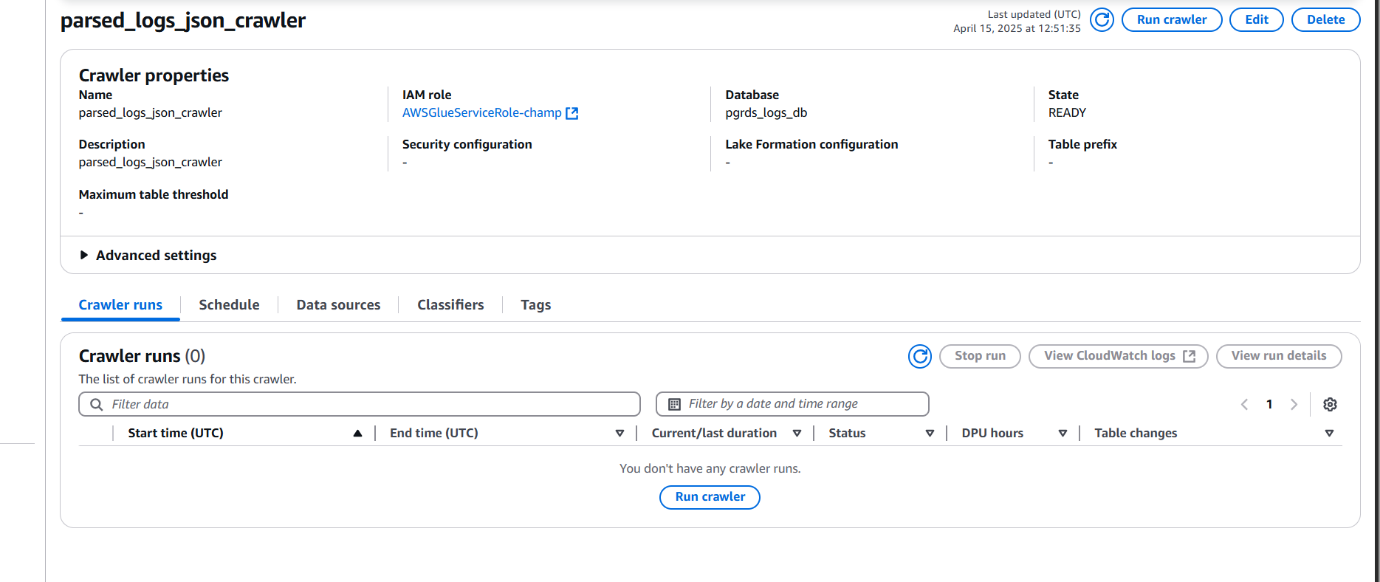
• Once the crawler finishes, it creates a table inside the selected Glue database by detecting the schema from the JSON files.
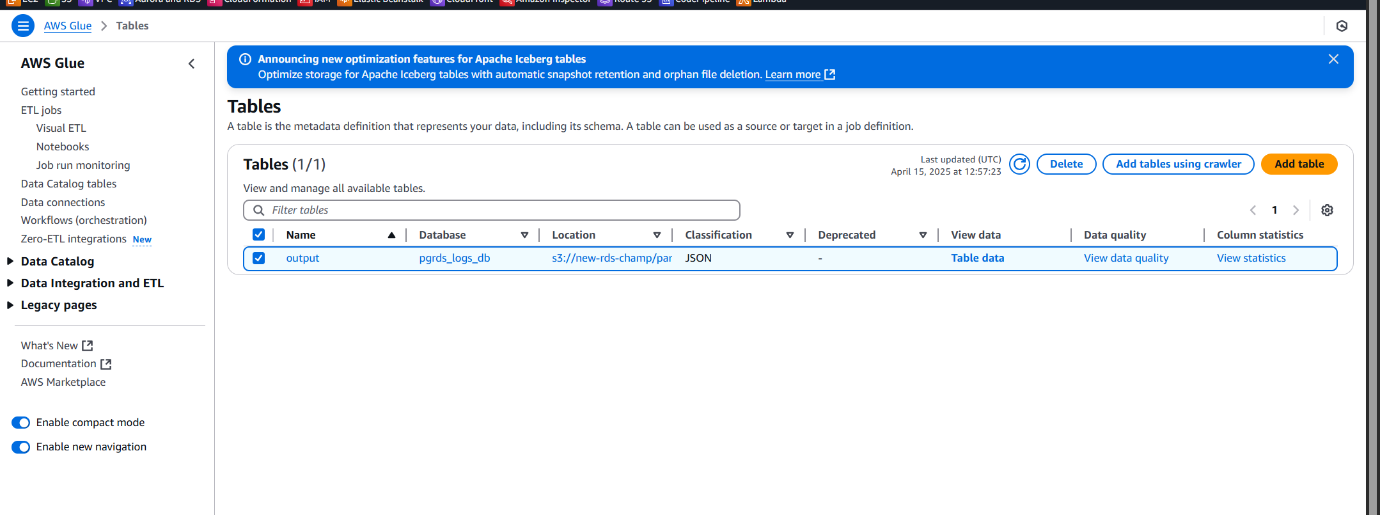
• This table can now be queried using Amazon Athena for insights into your RDS logs.
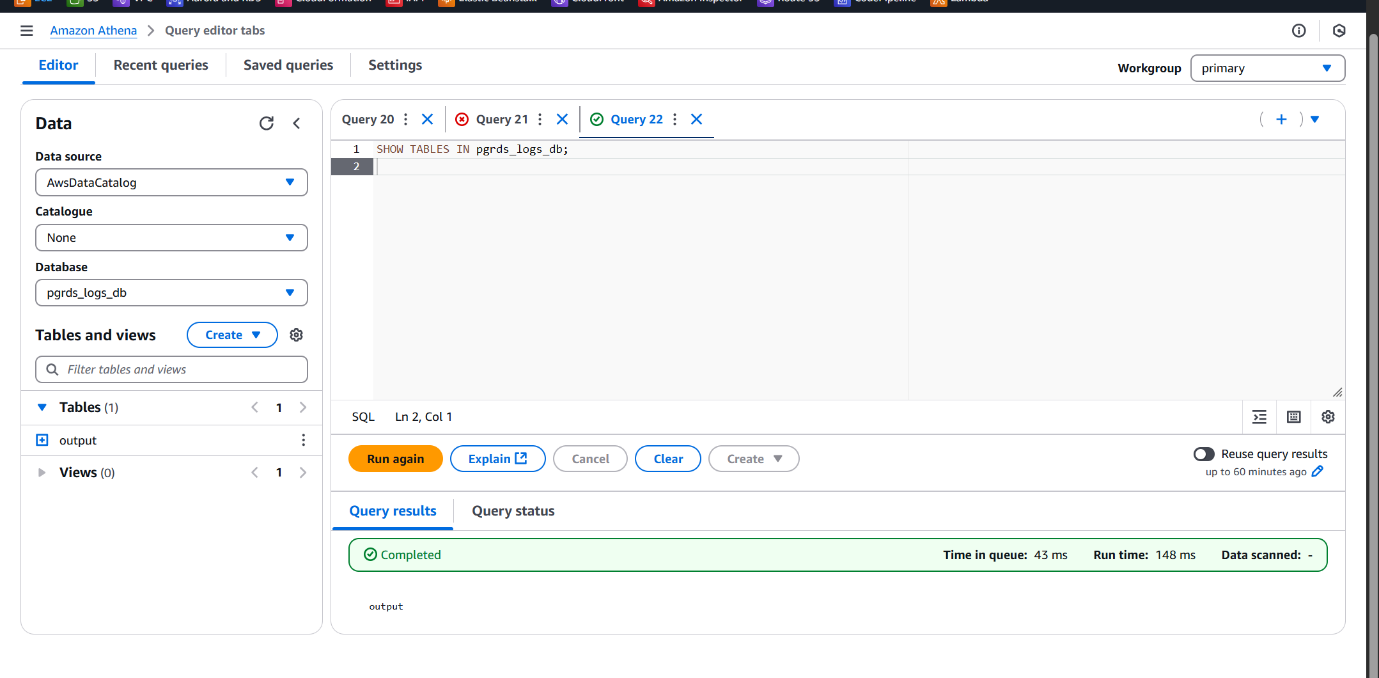
Direct Integration from S3 to Athena (Without Glue)
Purpose: Quickly query log files stored in S3 without creating a Glue ETL or Crawler
setup.
Use Case:
Best suited for ad-hoc analysis, lightweight querying, or temporary exploration when
you have structured data like JSON, CSV, or Parquet directly stored in S3.
Simply point Athena to the S3 path and define the table schema manually using DDL
statements.
Created an external table pgrds_logs in Athena, specifying the S3 bucket path where
the logs are stored and defining table properties including compression type as gzip.
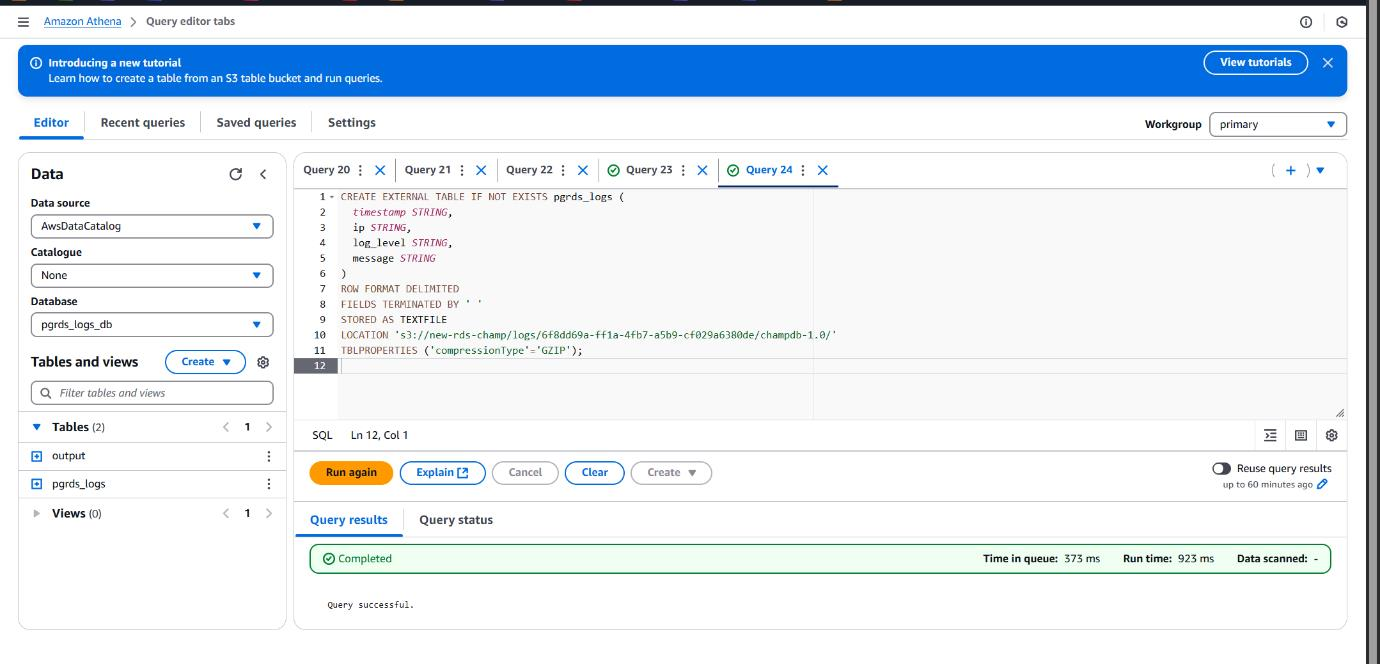
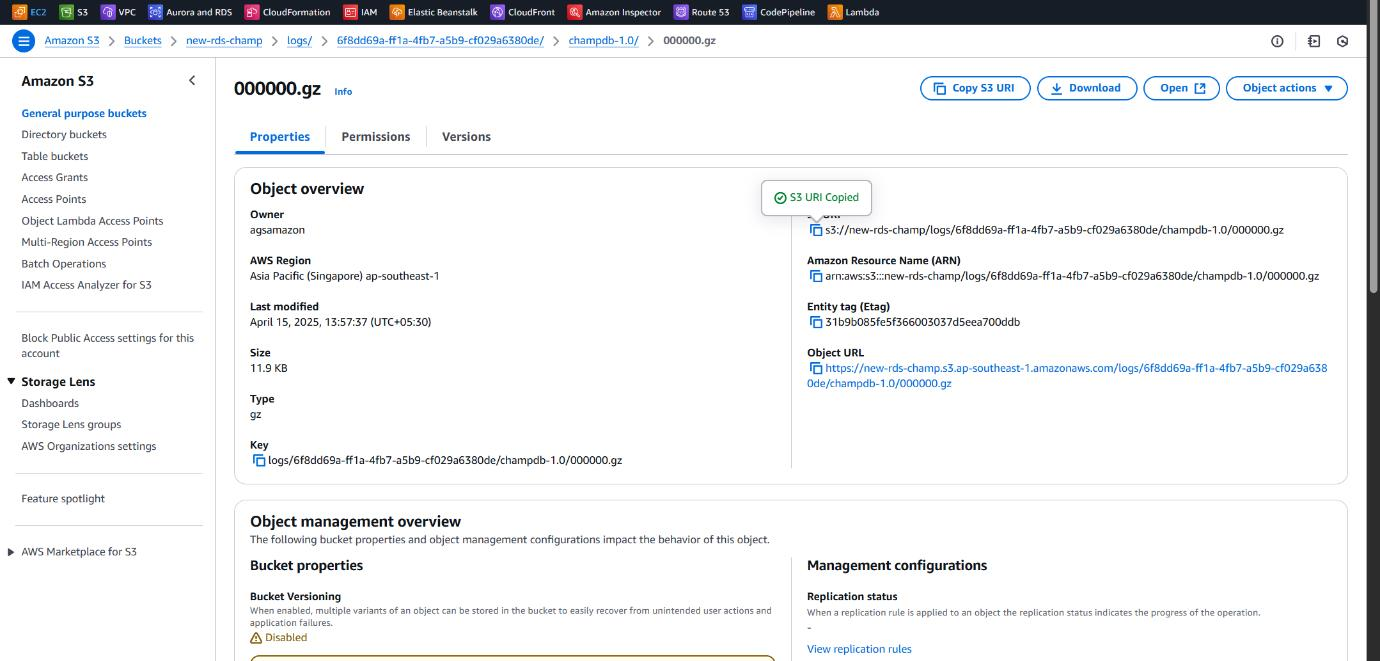
Specified the S3 bucket URI pointing to the .gz log files exported from CloudWatch, which serves as the data source for the Athena external table.
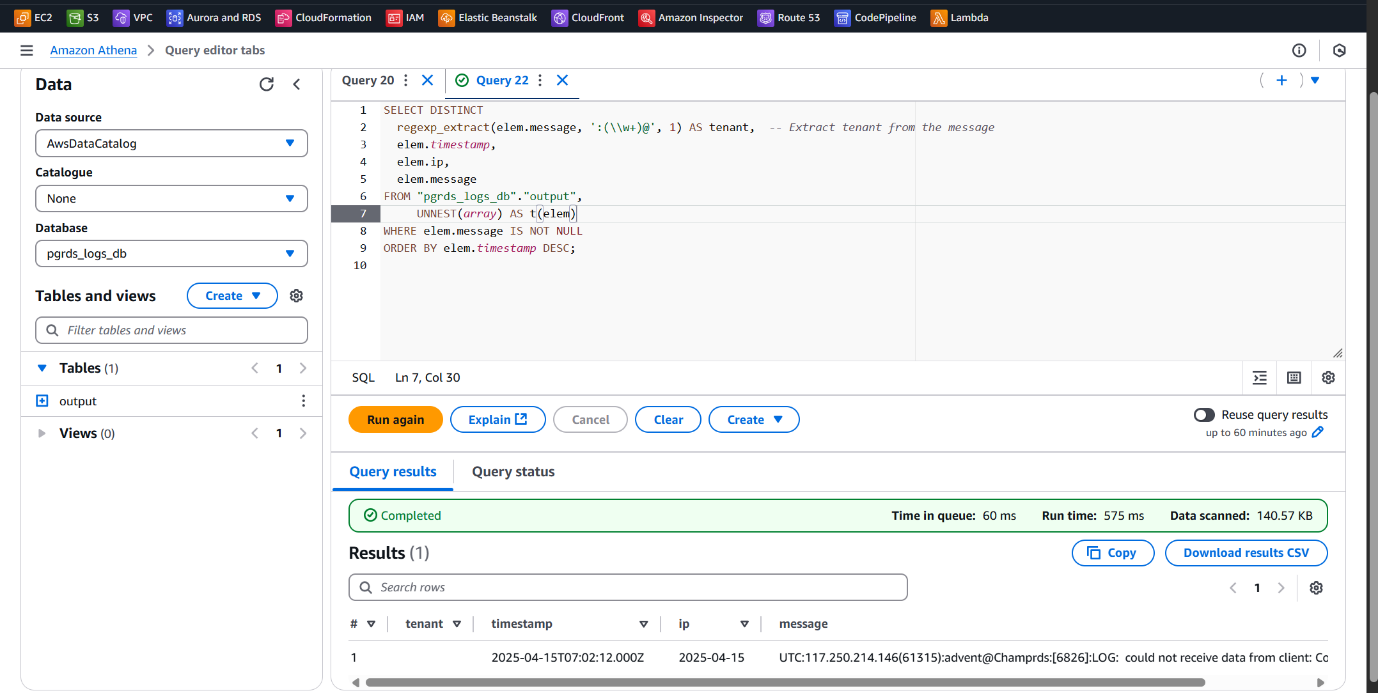
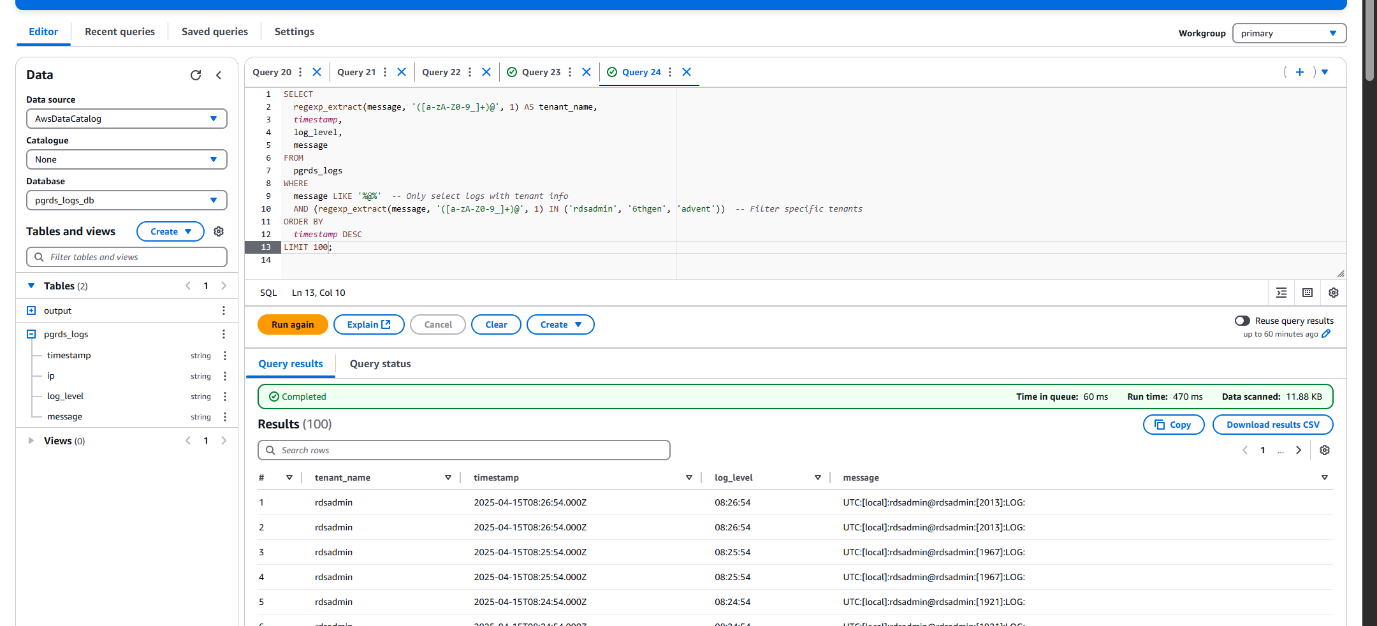
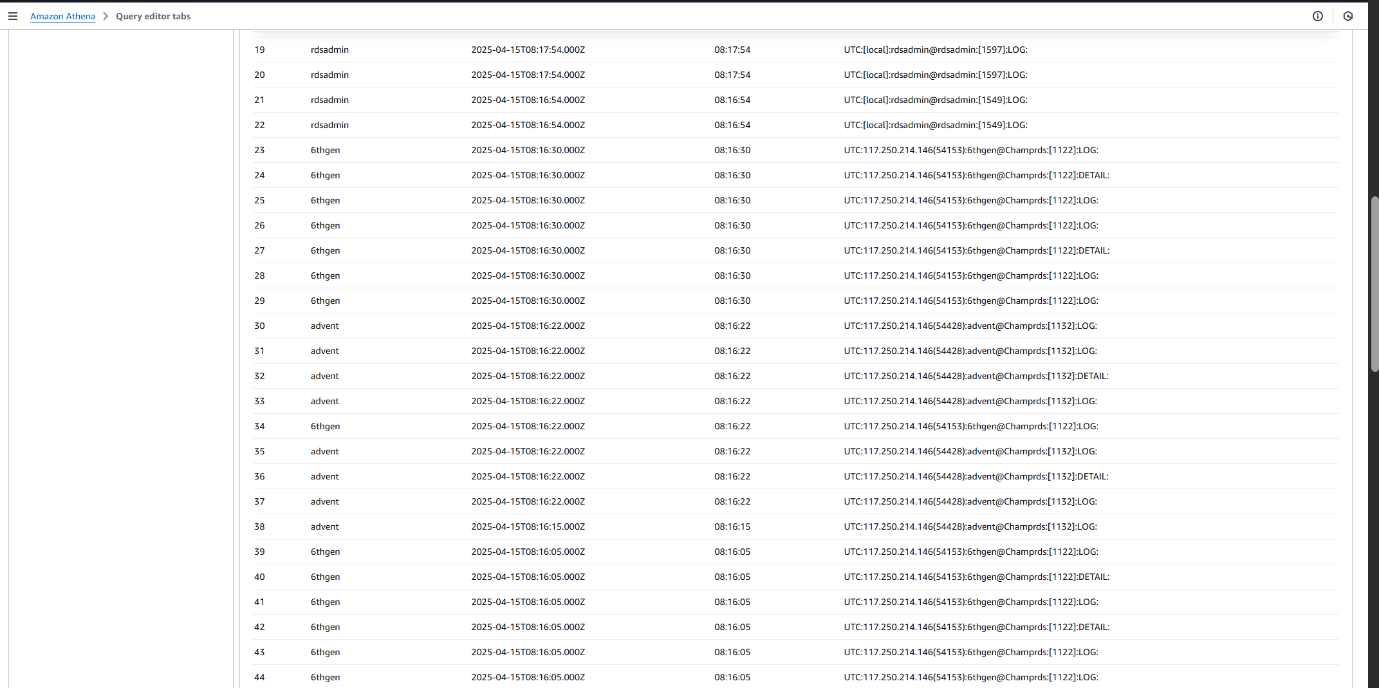
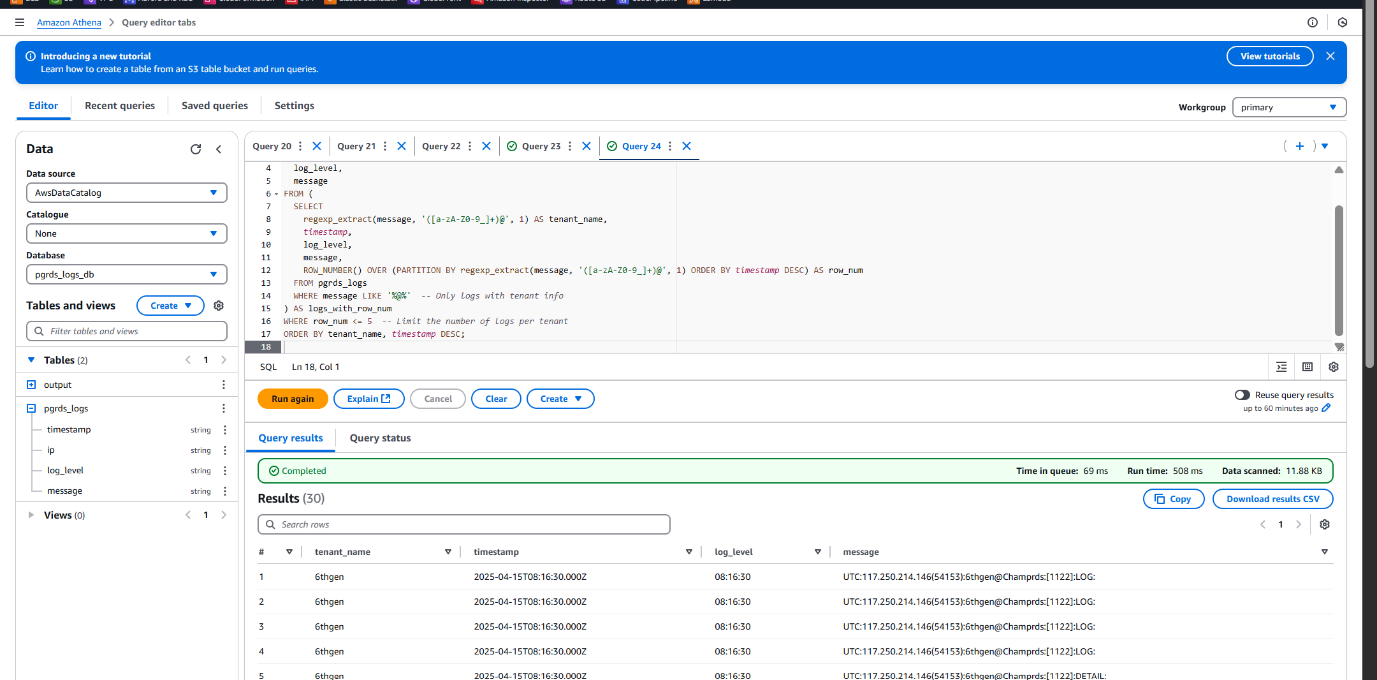
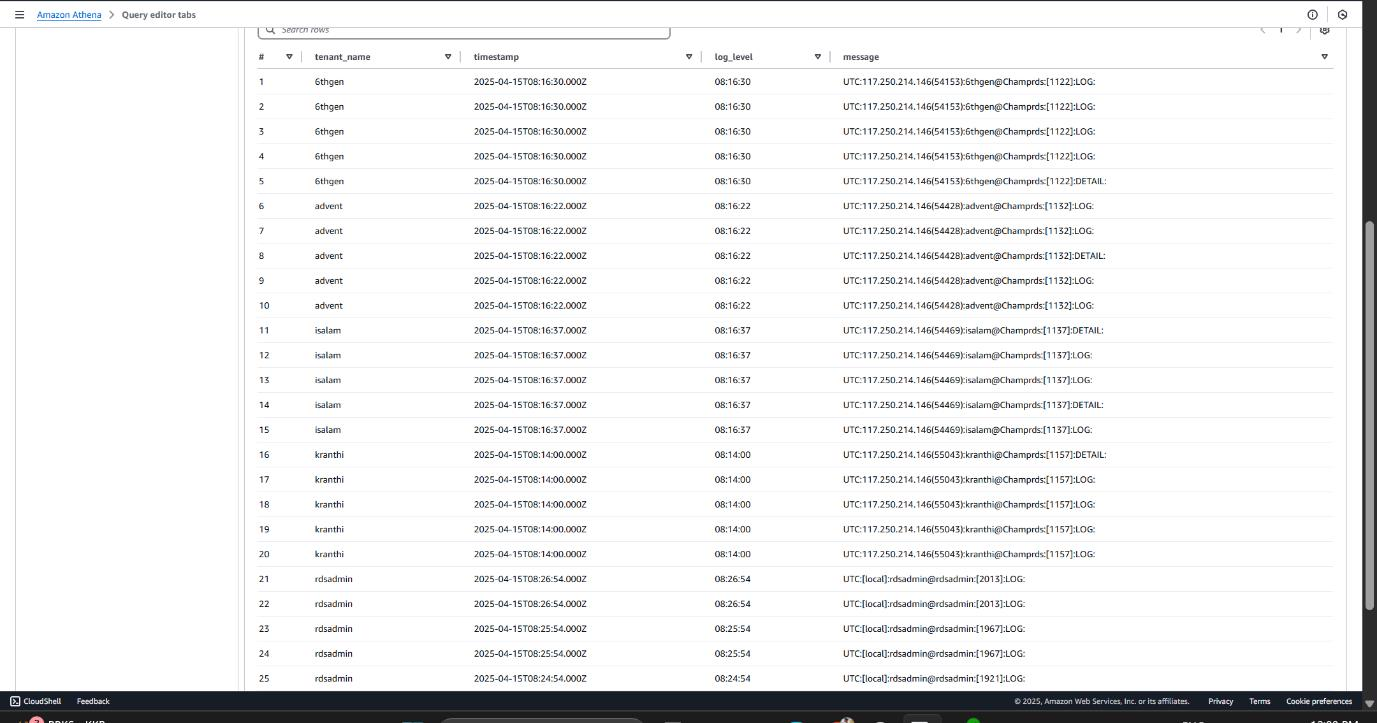
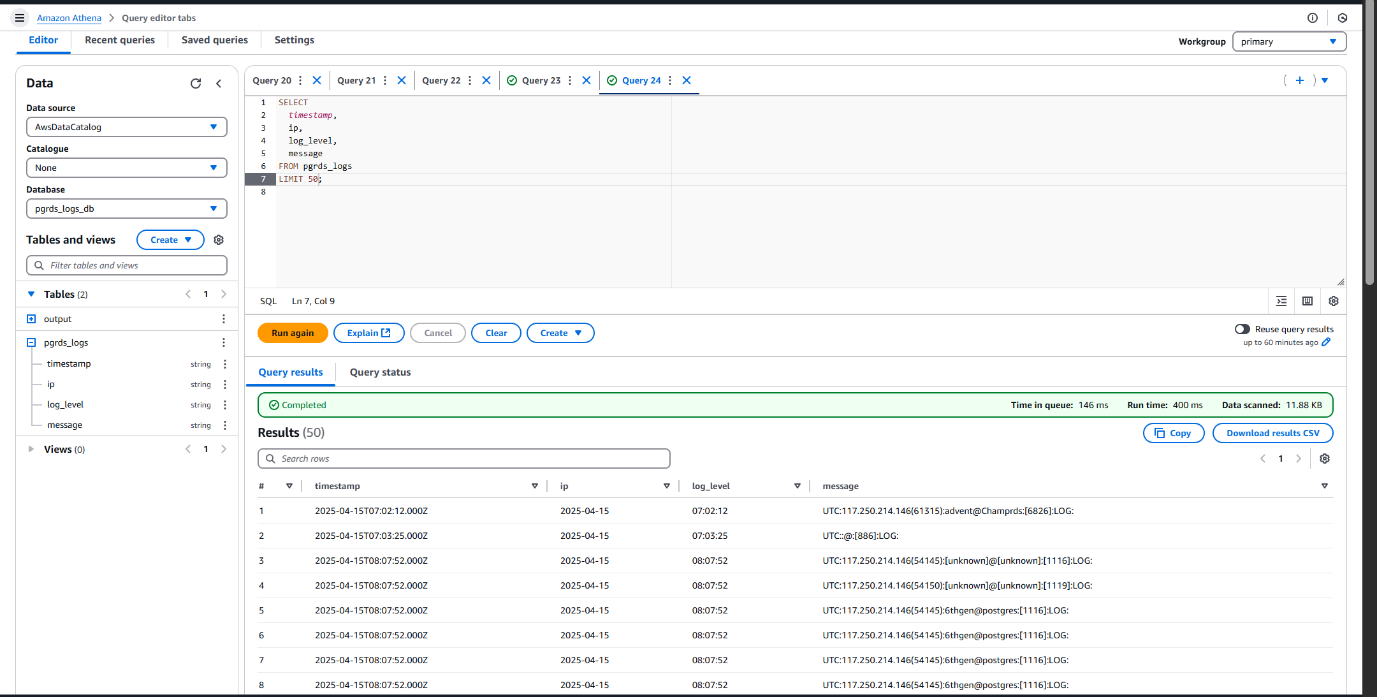
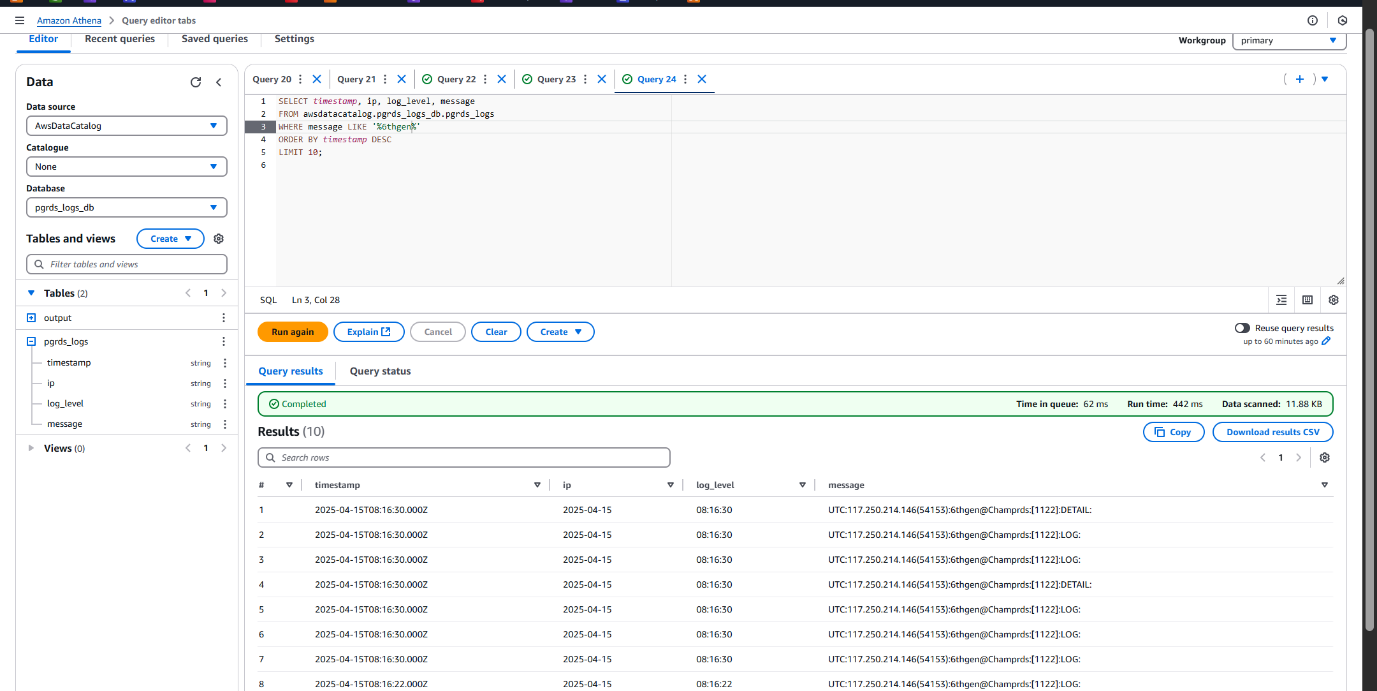
Extracting Valuable Insights with Athena Queries on RDS Logs
To analyze and monitor the PostgreSQL RDS usage across multiple tenants, we executed a series of Athena queries on the structured log data stored in Amazon S3. These queries returned critical details such as timestamps, tenant (user) activities, query patterns, and potential performance issues.
This approach enables:
• Granular visibility into individual tenant behavior
• Identification of slow or long-running queries
• Enhanced observability for resource optimization and cost management
• Support for proactive database performance tuning
These insights mimic real-world application usage and help drive informed decisions for multi-tenant architectures.
Sample Queries :
Conclusion & Key Takeaways
This PoC illustrates a comprehensive approach to managing and analyzing performance in a multi-tenant PostgreSQL database on Amazon RDS, with a focus on data-driven cost and performance insights.
Key Outcomes:
- Achieved efficient tenant isolation using PostgreSQL schemas.
Enabled real-time performance monitoring with RDS Performance Insights and CloudWatch.
Implemented log export automation to Amazon S3 for advanced analytics.
Leveraged Athena & AWS Glue for scalable, serverless log analysis.
The architecture is designed with security, observability, and scalability in mind, offering a solid framework for SaaS platforms or internal multi-tenant systems that require
detailed visibility into tenant behavior and system performance.
Presented by KRANTHI PUTTI https://www.linkedin.com/in/kranthi-putti/