🚀 Create PERT Charts Easily in React with react-pert
PERT (Program Evaluation and Review Technique) is a powerful method for project scheduling and task dependency visualization. I created react-pert from scratch to provide an easy way to implement PERT diagrams in React applications! 🎯
This open-source library lets you create, customize, and interact with PERT charts effortlessly.
✨ Features
- ✅ Interactive PERT diagram rendering
- ✅ Task dependencies & critical path calculation
- ✅ Customizable styles & layout
- ✅ Easy integration with React hooks
- ✅ Open-source and developer-friendly
📦 Installation
To get started, install react-pert using npm or yarn:
npm install react-pert
# or
yarn add react-pert
🚀 Getting Started
1️⃣ Import & Setup the Provider
Wrap your app with PertProvider to manage the PERT chart state.
import { PertProvider } from "react-pert";
const App = () => {
return (
);
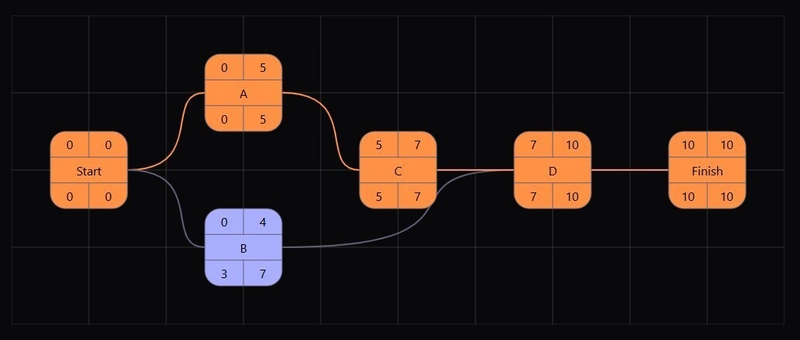
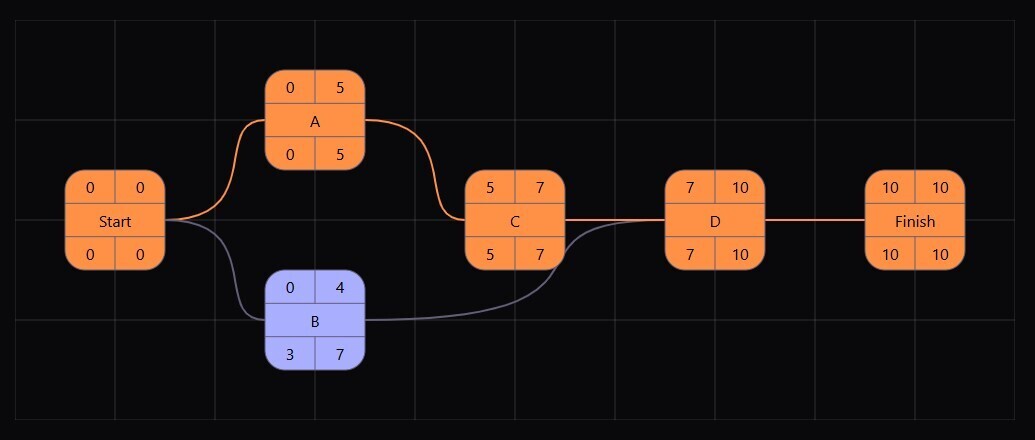
}2️⃣ Define Tasks & Render the PERT Chart
Create an array of tasks with dependencies and durations, then render Pert.
import { Pert, type TaskInput } from "react-pert";

const tasks: TaskInput[] = [
  { key: "1", duration: 5, text: "A" },
  { key: "2", duration: 4, text: "B" },
  { key: "3", duration: 2, text: "C", dependsOn: ["1"] },
  { key: "4", duration: 3, text: "D", dependsOn: ["2", "3"] },
];

const MyPERTChart = () => {
  return ;
}
🎉 Congratulations!
You've successfully created a PERT chart!
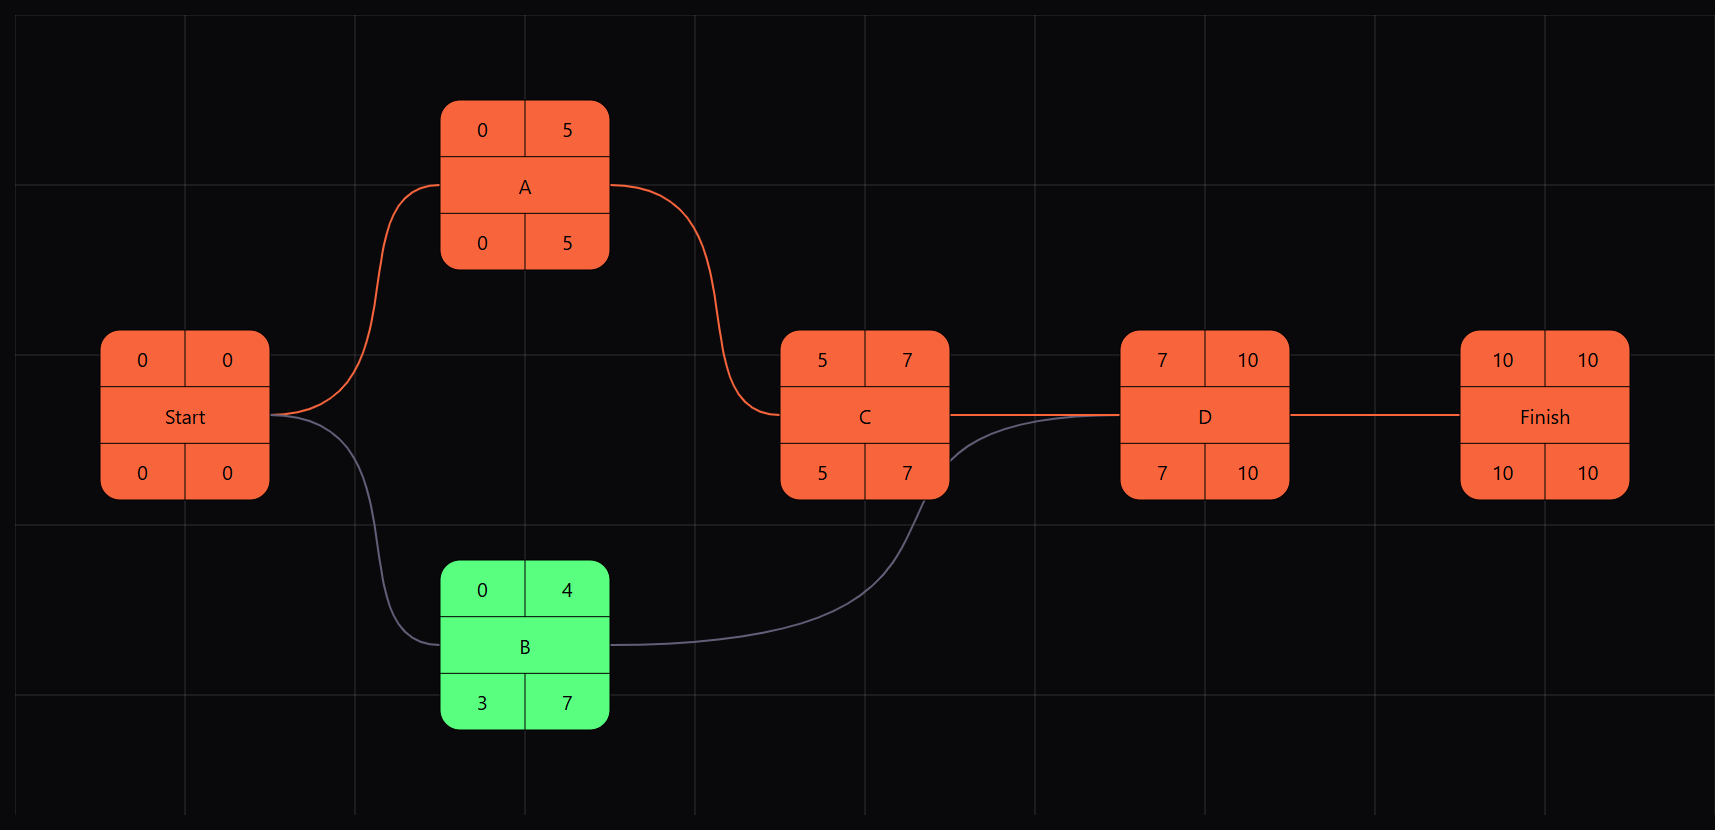
🖌️ Customizing Styles
You can use the online demo to customize the style: react-pert demo easily and copy the styles from it.
Add the styles to your code:
const styles: PertStyles = {
  disableGrid: false,
  taskSize: 170,
  fontFamily: "system-ui",
  fontSize: "lg",
  textColor: "#000000",
  chartBackground: "#ffffff00",
  taskBackground: "#59ff7f",
  gridColor: "#83838350",
  borderWidth: 1,
  selectedBorderWidth: 3,
  hoverBorderWidth: 2,
  borderColor: "#000000",
  selectedBorderColor: "#6868ff",
  criticalColor: "#f8653c",
  arrowColor: "#615f77",
  arrowWidth: 2,
  gap: {
    x: 120,
    y: 290,
  },
};

function MyPERTChart() {
  return ;
}
Read the docs for more details.
📌 Conclusion
react-pert makes it effortless to create interactive and customizable PERT charts in React. Whether you're managing complex workflows or just need a visual project planner, this library has you covered. 🙌
💡 Check it out on npm: react-pert
🛠️ Try the Online Demo: react-pert demo
⭐ Star the project on GitHub: react-pert repo
💬 What do you think? Let me know in the comments! 😊