According to the 2024 State of DevOps report, the best teams achieve lead times as low as 1 minute 29 seconds, and their incident recovery times average just 33.95 minutes. But how many organisations can reach those benchmarks? And more importantly, what does it take?
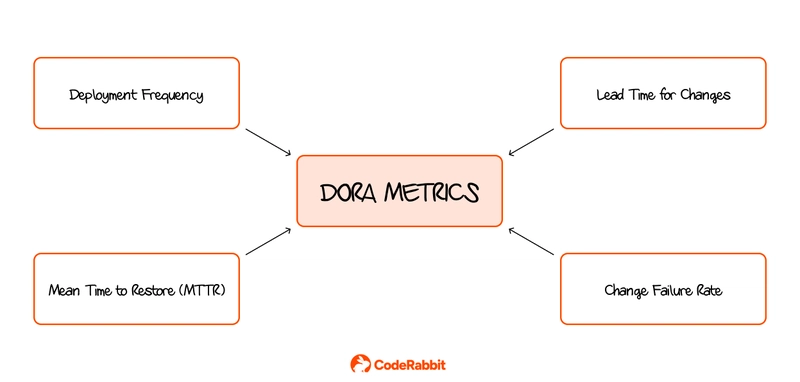
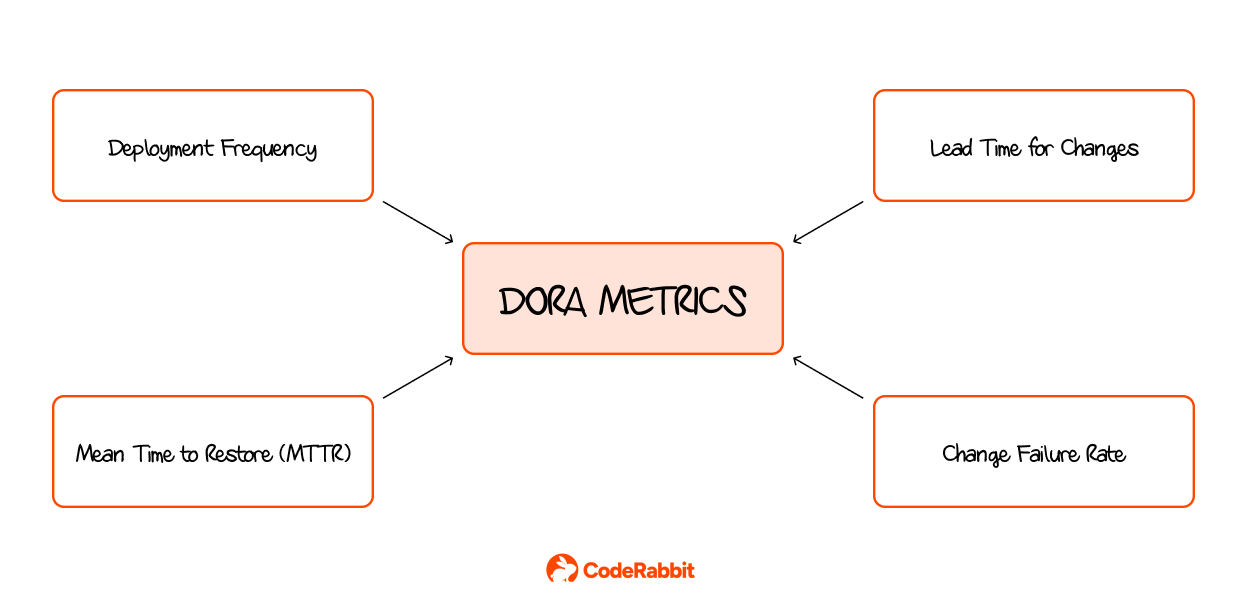
DORA (DevOps Research and Assessment) metrics exist to answer these questions. They zero in on core performance metrics such as deployment frequency, lead time for changes, mean time to restore (MTTR), and change failure rate.
The State of DevOps report has a dedicated section pointing out AI's impact on Developer Productivity. AI tools help teams build features faster, leading to better code reviews, real-time diagnostics, feedback cycles, and critical insights into workflows. These can positively affect your team's scores around each metric.
What Are DORA Metrics?
DORA metrics provide a quantitative method for measuring your software development and deployment cycle effectiveness. They try to give some answers to the question, “What makes the best-performing software engineering teams work?”
These are the four key metrics of DORA: deployment frequency, lead time for change, change failure rate, and mean time to restore;
The Deployment Frequency
Deployment frequency measures the number of times an organisation deploys code changes to production over a specific period. Having a high deployment frequency indicates a fast, efficient development process, while a low frequency can signal bottlenecks and inefficiencies in your continuous integration and delivery processes or pipeline.
Lead Time for Changes
Lead time for changes is another essential DORA metric, measuring the time it takes from committing code to deploying it to production. This metric can help the project teams set realistic deadlines based on the data obtained from these metrics.
Mean Time To Restore (MTTR)
Mean Time to Restore (MTTR) measures the average time it takes to recover from a production incident, such as an application failure or system outage. Understanding the MTTR metric is important for understanding how quickly your team can resolve issues that disrupt end users.
Change Failure Rate
The Change Failure Rate (CFR) measures the percentage of code changes that result in production failures, such as rollbacks or hotfixes. This metric is crucial for understanding the quality and reliability of code changes. A lower CFR indicates better testing, code reviews, and overall deployment practices, while a high CFR often points to insufficient reviews or inadequate testing processes.
Understanding DORA metrics and using automated code review tools like CodeRabbit can help you make data-driven improvements that benefit your team and users. Start by measuring your current metrics, applying your learning, and tracking your progress.
To know more about this topic and implementation, check out this article by CodeRabbit.