
Performance is a fundamental concern for any modern web application, and Meteor apps are no exception. Currently, one of our main focuses is optimizing the Meteor bundler, which can be a significant bottleneck in larger projects. Although Meteor already offers built-in tools for performance analysis, using native CPU profiling can provide much deeper insights into performance bottlenecks. In this article, we'll explore how to effectively use CPU profiling in Meteor, including the difference between Meteor's current profiling system and native profiling based on Node.js Inspector, with special emphasis on how this can help improve the bundling process.
What is CPU Profiling?
CPU profiling is a performance analysis technique that tracks exactly which functions are being executed by the CPU, for how long, and how frequently. This type of analysis allows you to identify precisely where your code is spending the most processing time.
Unlike simple time measurement techniques (like basic timers), CPU profiling creates a comprehensive view of code execution, including:
- Function call tree - shows which functions call other functions
- Execution time for each function
- Frequency of calls for each function
- Memory allocation (in some cases)
- Call stack visualization
Current Meteor Profiling vs Native CPU Profiling
Meteor's Built-in Profiling System
Meteor has a built-in profiling system that can be activated by setting the METEOR_PROFILE environment variable. This system uses a timer-based measurement approach:
METEOR_PROFILE=1 meteor <command>This profiler is designed specifically for the Meteor ecosystem and works through manual code instrumentation. The result is a report that shows the time spent on different Meteor operations, such as:
| (#1) Profiling: ProjectContext prepareProjectForBuild
| ProjectContext prepareProjectForBuild..........9,207 ms (1)
|    _initializeCatalog.............................24 ms (1)
|       files.readFile                               7 ms (2)
|       runJavaScript package.js                     2 ms (1)
|       files.rm_recursive                           4 ms (4)
|       other _initializeCatalog                    11 ms
|    _resolveConstraints.........................6,702 ms (1)
|       bundler.readJsImage.........................42 ms (1)
...
| (#1) Total: 9,544 ms (ProjectContext prepareProjectForBuild)
Native CPU Profiling with Node.js Inspector
Recent versions of Meteor have included support for native CPU profiling using Node.js's inspector module. This approach generates .cpuprofile files that provide much more detailed data and can be analyzed with advanced tools such as Chrome DevTools or cpupro.
To enable native CPU profiling:
METEOR_INSPECT=bundler.bundle,compiler.compile meteor <command>Advantages of Native CPU Profiling:
- Complete execution view: Captures all functions being executed, not just those manually instrumented
- Interactive analysis: Allows you to visually explore and filter performance data using graphical tools
- Hidden bottleneck discovery: Identifies problems in third-party libraries or Node.js code
- Superior precision: Uses CPU sampling directly, providing more accurate data about actual CPU usage
- Multiple metrics: Beyond time, can provide data on memory allocation and other aspects
How to Use Native CPU Profiling in Meteor
Basic Configuration
To generate a basic CPU profile, use the METEOR_INSPECT environment variable specifying which functions you want to profile:
# Profile a single function
METEOR_INSPECT=bundler.bundle meteor build ./output-build

# Profile multiple functions
METEOR_INSPECT=bundler.bundle,compiler.compile meteor build ./output-build
Available Functions for Profiling
Meteor supports profiling for several critical functions:
-
bundler.bundle- Application packaging process -
compiler.compile- General compilation -
Babel.compile- Babel-specific compilation -
_readProjectMetadata- Reading project metadata -
initializeCatalog- Package catalog initialization -
_downloadMissingPackages- Downloading missing packages -
_saveChangeMetadata- Saving change metadata -
_realpath- File path resolution -
package-client- Package client operations
Advanced Configuration Options
You can customize the profiling behavior with additional environment variables:
# Identifier for profile files
METEOR_INSPECT_CONTEXT=context_name

# Directory where .cpuprofile files will be saved (default: ./profiling)
METEOR_INSPECT_OUTPUT=/path/to/directory

# Sampling interval in ms - lower values = more details but uses more memory
METEOR_INSPECT_INTERVAL=500

# Maximum profile size in MB (default: 2000)
METEOR_INSPECT_MAX_SIZE=1000
For Large Applications
Larger applications may require more memory for profiling. To avoid out-of-memory (OOM) errors:
NODE_OPTIONS="--max-old-space-size=4096" METEOR_INSPECT=bundler.bundle meteor <command>Analyzing CPU Profiling Results
With Chrome DevTools
- Open Chrome DevTools
- Go to the "Performance" or "Profiler" tab
- Click "Load Profile" and select the generated .cpuprofile file
With cpupro (Open-Source Visualizer)
For more advanced analysis, you can use cpupro:
- Visit https://discoveryjs.github.io/cpupro/ in your browser
- Drag and drop your .cpuprofile file onto the interface
- Use the interactive visualization to explore your profile data
cpupro offers several advantages over Chrome DevTools:
- Better handling of large profiles
- More flexible filtering options
- Advanced search capabilities
- Multiple visualization modes
- Ability to compare different profiles
Practical Use Cases
Identifying Bottlenecks in Template Compilation
If your Meteor application is taking a long time to restart after template changes, you can use:
METEOR_INSPECT=compiler.compile meteor runAnalyze the resulting profile to identify which templates are causing the most overhead.
Diagnosing Slow Build Problems
For apps with slow builds:
METEOR_INSPECT=bundler.bundle meteor build ./outputLook in the profile for functions that are consuming excessive time, such as CSS processing, code transpilation, or minification.
Optimizing Package Loading
If you suspect packages are affecting performance:
METEOR_INSPECT=_downloadMissingPackages,package-client meteor updateWhen to Use Each Type of Profiling
Use Meteor's Built-in Profiling (METEOR_PROFILE) when:
- You need a quick and general overview of Meteor tool performance
- You're analyzing specific issues in Meteor operations
- You prefer simple text-based reports
- You have limited system resources (less memory usage)
Use Native CPU Profiling (METEOR_INSPECT) when:
- You need more detailed analysis than the standard profiler provides
- You're investigating complex performance issues
- You want to identify specific bottlenecks in heavy functions like bundler or compiler
- You need interactive visualization and in-depth analysis
- You're looking to understand issues in third-party libraries or Node.js runtime
Real life demo
When using CPU profiling in real Meteor applications, we can identify specific bottlenecks that significantly impact performance. Let's analyze two practical examples:
Case 1: Babel as the main CPU consumer
When examining a Meteor CPU profile, we can clearly observe that Babel is the module consuming most of the processing time, both in self time (time spent within the function itself) and total time (time including calls to other functions):
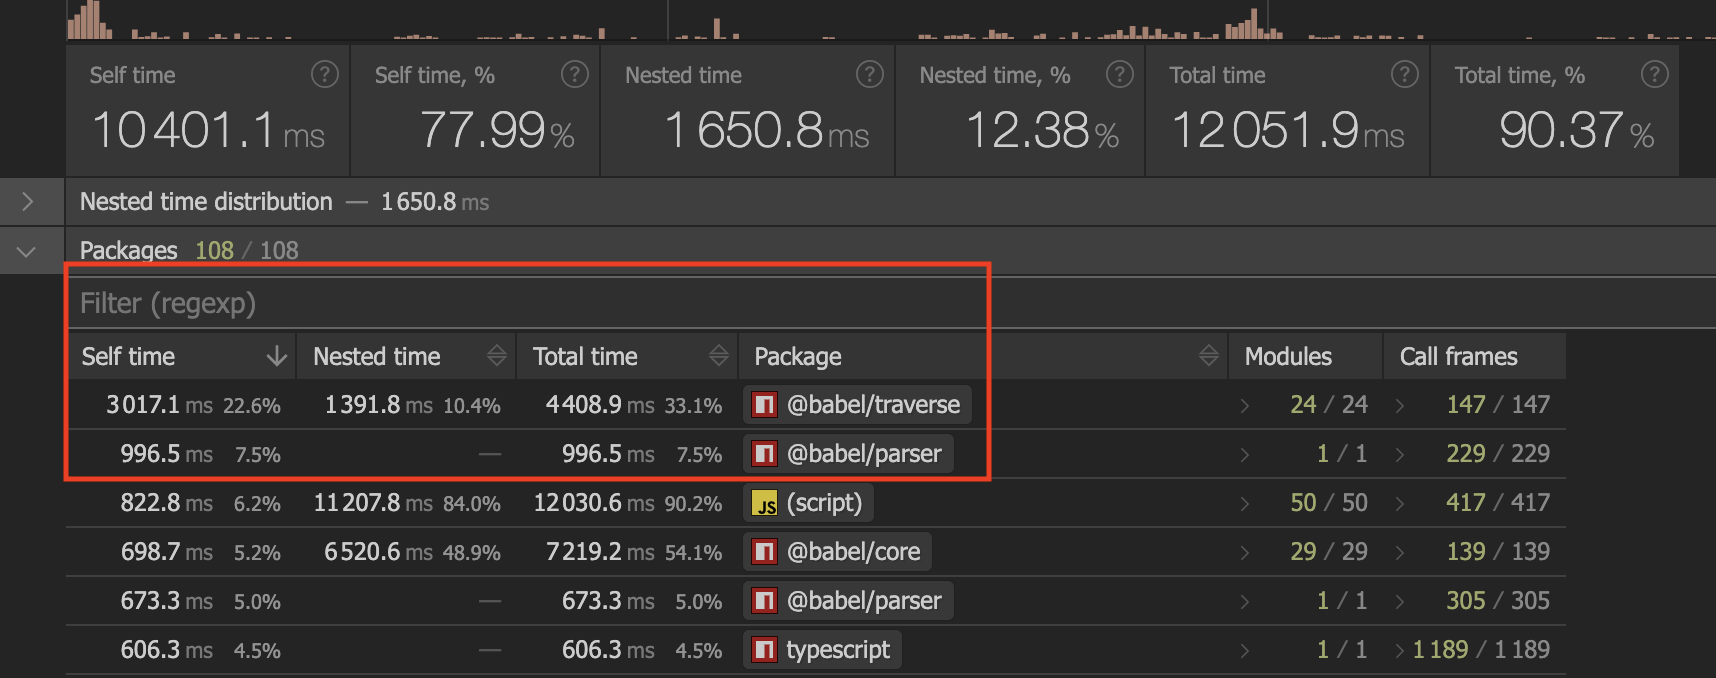
This is a known issue in the Meteor community and fortunately it's already being addressed by PRs #13675 and #13674, which aim to replace Babel with SWC, a much faster transpiler written in Rust.
PR #13675, in particular, implements a smart approach: it uses SWC for initial transpilation, but preserves reify to maintain Meteor-specific features, such as reify modules, nested imports, and top-level await support. This allows gaining speed without losing important functionalities of the Meteor ecosystem.
Case 2: Analyzing by Self Time - The bottleneck in compiler-plugin
When sorting the same profile by "self time", we find the "script" module appearing as the one consuming the most processing time.
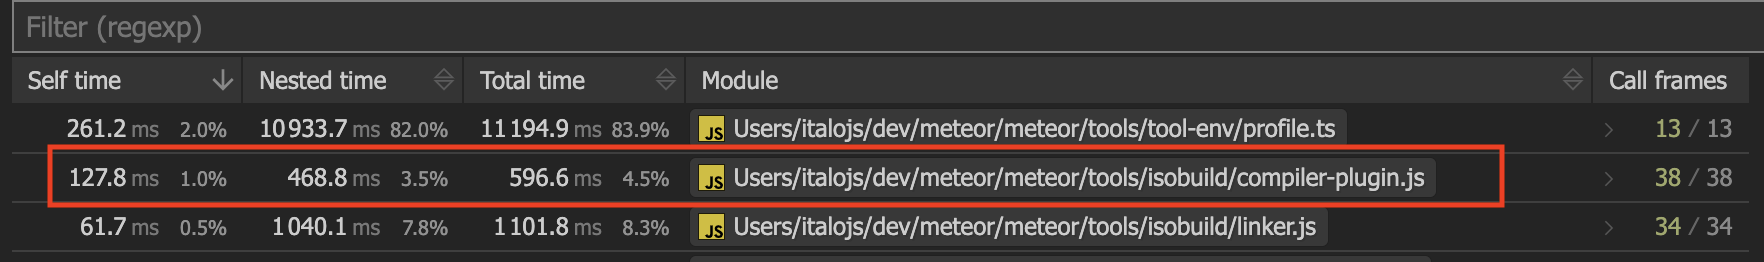
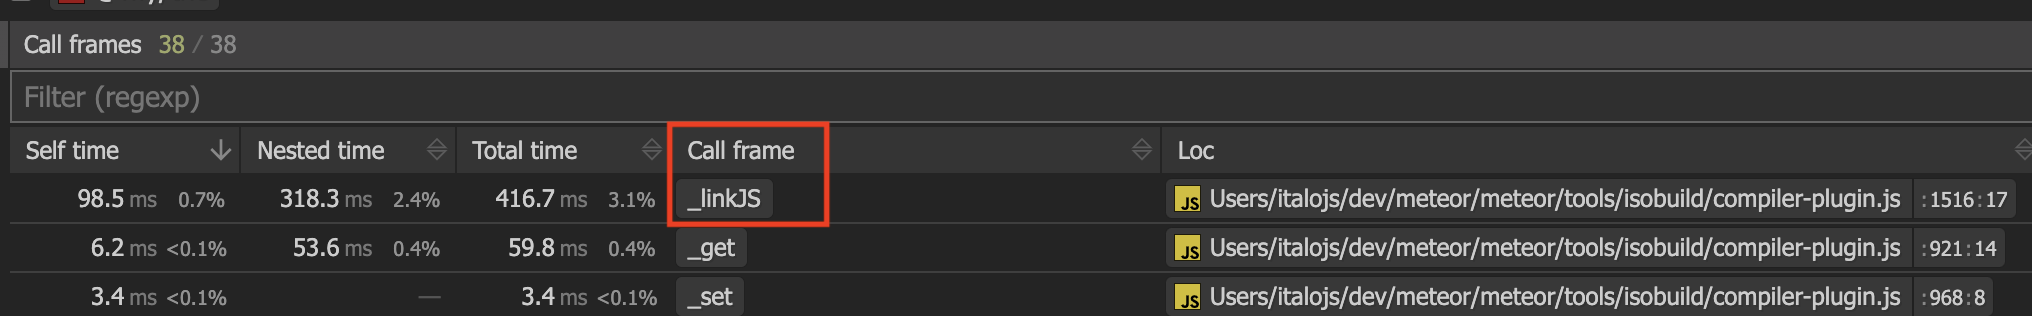
Digging deeper, we see that the compiler-plugin.js file is responsible for much of this consumption. And digging even deeper, the _linkJS function stands out as the most expensive of all.
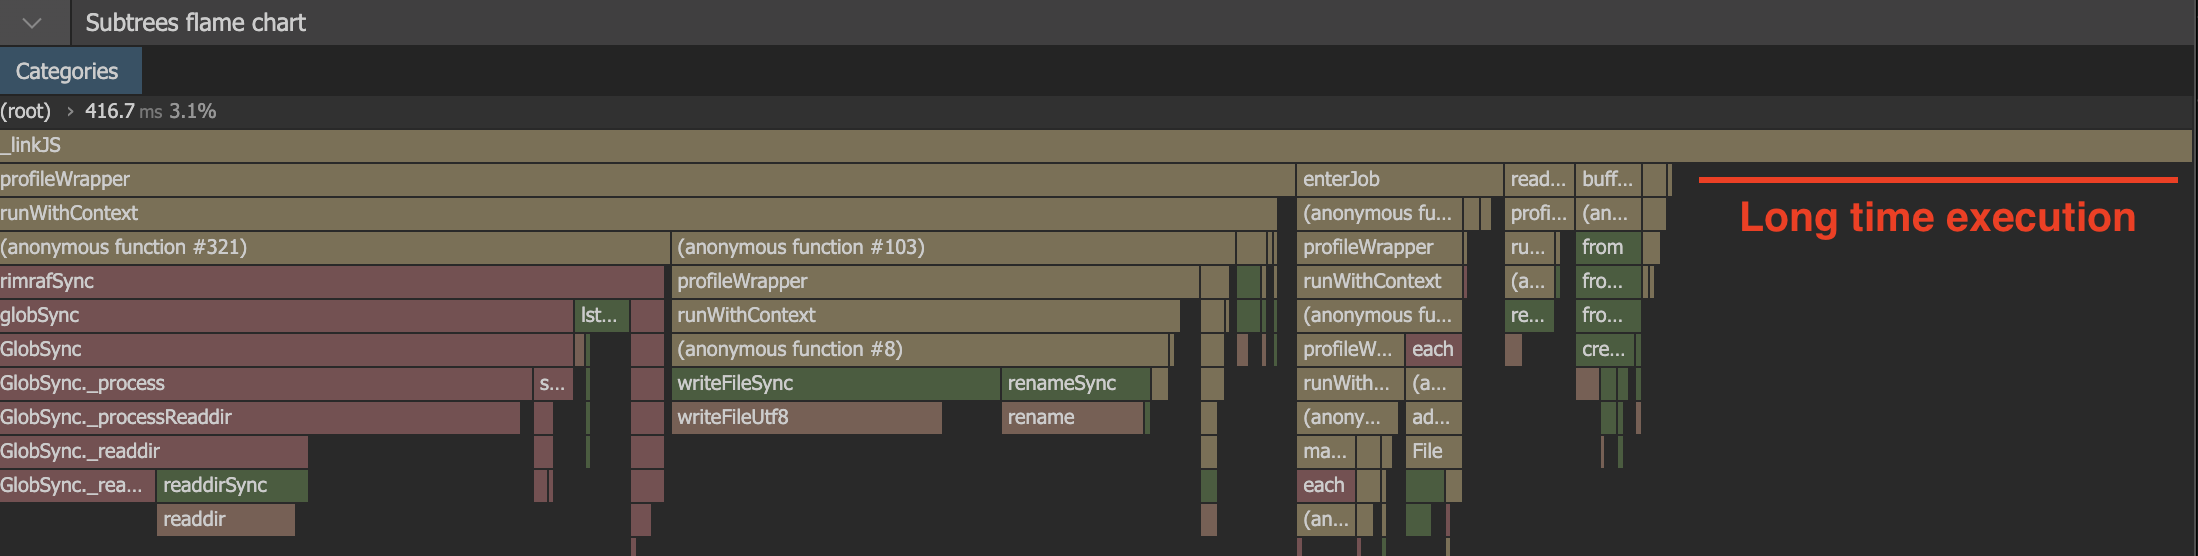
Examining the flame graph of this function, we can see that there is especially intensive processing in the generation of hashes for the cache system:
const cacheKeyPrefix = sha1(JSON.stringify({
  linkerOptions,
  files: await Promise.all(
    jsResources.map(async (inputFile) => {
      fileHashes.push(await inputFile.hash);
      return {
        meteorInstallOptions: inputFile.meteorInstallOptions,
        absModuleId: inputFile.absModuleId,
        sourceMap: !!(await inputFile.sourceMap),
        mainModule: inputFile.mainModule,
        imported: inputFile.imported,
        alias: inputFile.alias,
        lazy: inputFile.lazy,
        bare: inputFile.bare,
      };
    })
  )
}));
const cacheKeySuffix = sha1(JSON.stringify({
  LINKER_CACHE_SALT,
  fileHashes
}));
This snippet shows that for each JavaScript file processed, the function executes:
- Multiple
awaitoperations to access properties likehashandsourceMap - Conversions to JSON (via
JSON.stringify) - Multiple SHA-1 hash calculations
- Promise operations that occur for each file individually
The impact of this code is significant because it is executed for each JavaScript file in each module/package, becoming a serious bottleneck in larger applications with many files. Each call of this function processes all files again to generate cache keys, even when most files haven't changed.
This is an area where focused optimization could bring significant benefits.
Conclusion
While Meteor's built-in profiling system offers a more practical solution for performance analysis, native CPU profiling based on Node.js Inspector provides deeper and more detailed insights into your application's build performance. By combining both approaches, Meteor developers can identify and solve performance problems with unprecedented precision.
Try these techniques in your next performance debugging session and see how CPU profiling can transform your approach to optimizing Meteor applications.