Users in present times demand quick and responsive features within Web Applications. Google research indicates that 53% of mobile site visitors leave pages which require more than three seconds to load. The existing performance requirements put intense pressure on development teams who provide extraordinary delivery performance to avoid user loss and revenue decline. The performance problems arise from various sources that include inefficient code, unoptimized assets and server configuration problems and third-party dependencies. Modern web infrastructure complexity creates significant difficulties for development teams when they attempt to identify performance bottleneck problems.
This complete guide helps developers and teams to detect and solve performance problems that emerge in their web applications. These tested methods will support developers in codebase optimization and product owners in understanding technical obstacles faced by their teams to deliver user-friendly experiences.
Understanding the Impact of Slow Web Applications
We need to understand the business effects of poor performance before moving forward with debugging approaches. According to Akamai, just a 100-millisecond delay in website load time can hurt conversion rates by 7%. Poor performance of web application leads to-
- Decreased user satisfaction and engagement
- Users tend to leave pages more frequently and stop interacting with websites
- Website performance affects search engine rankings because Google uses page speed as a ranking factor for website positions.
- Reduced brand perception and trust
Essential Tools for Debugging Slow Web Applications
You must gain visibility into your application operations before starting any optimization process. These tools will help you to detect wherever performance issues occur -
Browser Developer Tools
Developers can access complete performance information through Chrome DevTools alongside Firefox Developer Tools and a range of browser-based debugging tools -
Network Panel: Through the Network Panel users can examine request timing along with size information and dependencies.
Performance Tab: The Performance Tab enables users to both monitor runtime behavior alongside performance management analysis.
Memory Panel: Identify memory leaks and excessive DOM size
Lighthouse: Lighthouse serves as an automated system to audit performance alongside accessibility features and best practices implementation.
Backend Monitoring Tools
For server-side performance issues:
- Application Performance Monitoring (APM) solutions such as New Relic and Datadog and AppDynamics enable users to monitor complete stack performance through request tracking mechanisms.
- Profilers - application needs specific profiler tools based on its backend programming language such as Node.js Profiler and Python cProfile.
- Database query analyzers - Applications should use database query analyzers which identify slow queries.
Common Causes of Web App Performance Issues
1. Excessive Network Requests
Modern web applications need dozens or hundreds of network requests to display a single web page. Each request incurs latency and overhead. HTTP Archive reports that typical web pages need between 69 to 74 requests to complete loading.
How to debug: The Network panel from developer tools helps identify unnecessary API requests and multiple small resource requests that could be combined together and redundant data fetching.
Optimization techniques:
- API request batching combined with GraphQL implementation will lead to optimized data fetching performance.
- Bundle JavaScript and CSS files
- When dealing with small images one should use sprites or icon fonts as alternatives.
- The application should implement code splitting
2. Unoptimized Assets
HTTP Archive data shows webpages contain images and other media which make up more than 60% of their weight. Your application suffers from delayed performance because it contains oversized images as well as uncompressed videos and unoptimized fonts.
How to debug: To debug the system, run Lighthouse alongside browser dev tools to track down large assets and evaluate their effects on load time.
Optimization techniques:
- Optimize images by converting them to WebP format since it provides up to 35% better compression than JPEG
- Lazy loading techniques should be used for images that appear below the current page area
- Your application should use images that adapt to various screen sizes according to device requirements
- Apply font-display strategy and split your fonts to enhance performance.
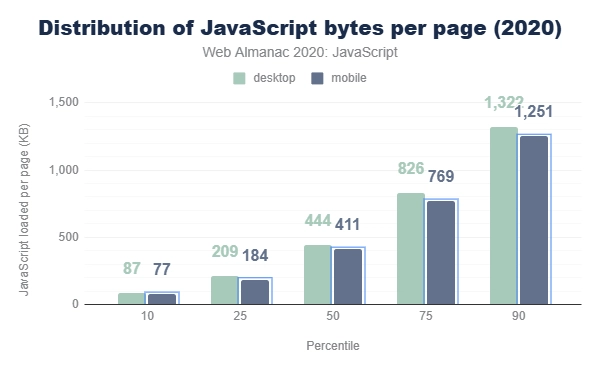
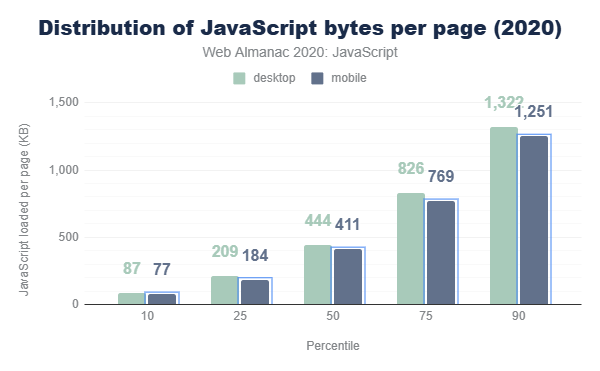
3. Inefficient JavaScript Execution
JavaScript execution requires a series of sequential operations from download to compilation to execution before it can affect system performance. The HTTP Archive conducted a 2020 study which showed that typical web pages utilize approximately 444 KB of JavaScript as their median content size.
How to debug: Use Performance panel recordings to detect which JavaScript operations take too long while tracking heavy main thread operations.
Optimization techniques:
- Eliminate render-blocking scripts
- Web Workers should handle complex calculations in order to speed up performance.
- Virtualized rendering should be applied to handle long list data sets
- Event handlers should be optimized while frequent events need debounce implementation.
- Use requestAnimationFrame for animations
4. Memory Leaks
Memory leaks occur when an application fails to free up memory usage which results in declining performance until it crashes.
How to debug: DevTools Memory panel enables users to take heap snapshots that reveal which objects prevent garbage collection.
Optimization techniques:
- Components should remove all event listeners during unmount procedures
- Avoid closure-related leaks
- Establish proper methods to clean up timer and observer resources
- Monitor memory usage during development
5. Server-Side Performance Issues
The backend performance of your system directly affects frontend performance no matter how well you optimize your client-side code.
How to debug: APM tools enable you to monitor server response times and CPU usage and database query performance for debugging purposes.
Optimization techniques:
- Implement caching strategies (Redis, Memcached)
- Optimize database queries and indexes
- Serverless designs should be implemented because they help achieve better scalability capabilities.
- The implementation of CDN caching for static assets is necessary.
Step-by-Step Process to Debug Slow Web Applications
- Establish baselines and metrics - Your application needs baseline metrics along with "good performance" definitions through measurements including First Contentful Paint (FCP) and Largest Contentful Paint (LCP) and Time to Interactive (TTI) and Total Blocking Time (TBT).
- Reproduce performance issues consistently - The initial step requires finding specific user flows or conditions which consistently produce poor performance outcomes.
- Isolate the problem domain - Find the source of problems by determining if they occur on the client side or server side or through network connections.
- Collect performance data - Use proper tools to collect extensive performance metrics in situations where problems occur.
- Analyze and prioritize issues - Professional assessment should begin with identifying crucial problems that drive maximum performance results.
- Implement fixes incrementally- Each improvement should be implemented separately as individual changes require testing before moving onto the next step.
- Verify improvements Test your modifications by checking whether they lead to actual performance enhancement for end users.
Preventing Future Performance Issues
The most effective approach to web app performance is preventative:
- Performance budgets together with automated testing need to be implemented.
- Make performance a team-wide responsibility
- Review third-party dependencies regularly
- Real user metrics (RUM) help you detect performance degradations during early stages.
- Development team should receive performance optimization guidelines for optimization work.
Conclusion
Debugging and optimizing slow web applications requires a methodical approach and the right tools. Through systematic bottleneck detection combined with optimized implementations you can enhance user experience and achieve higher conversion rates while strengthening your digital brand footprint.
Performance optimization requires constant maintenance because it exists as a continuous process instead of a singular operation. Throughout your application development cycle you must monitor performance metrics regularly to prevent user impacts which arise from application issues.
Are you facing challenges with slow web applications that are affecting your business outcomes?
The team of experts at Syncrasy Technologies focuses on enhancing performance levels of intricate web and mobile applications. Our mobile app development expertise has enabled us to optimize digital experiences for several businesses across multiple performance-based projects.
Contact our team right now for a web application performance audit to learn about our solutions that will generate business results through optimized user experiences.