Introduction
In technical engineering projects, especially those involving software system designs, professional diagrams play a critical role in simplifying complexity and enhancing communication.
In this blog, I'll walk you through how I combine Claude AI with draw.io to create clean, structured, and visually appealing diagrams for complex codebases.
We’ll demonstrate using a slightly complex system:
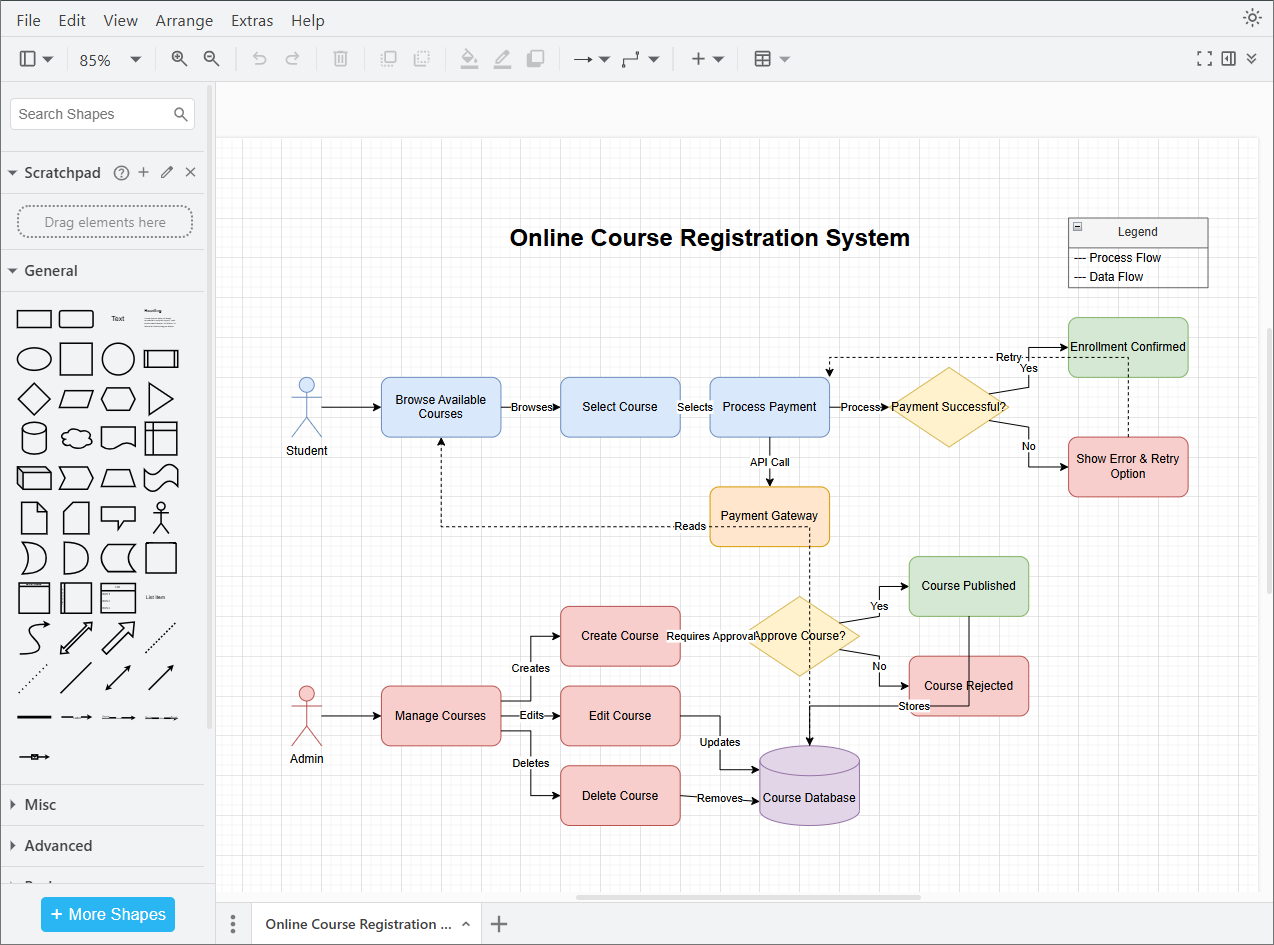
✅ Online Course Registration System (with Admin + Payment integration).
Why Visual Diagrams Are Essential for Engineers
- 📈 Improve project documentation quality
- 🧠 Clarify system architecture and workflows
- 🖼️ Impress during project evaluations, internships, and freelancing
- 🛠️ Save time during collaboration and debugging
Whether it’s API design, microservices, database flow, or user journey, good diagrams are crucial.
📋 Problem Statement
Design a backend flow for an Online Course Registration System.
Key Components:
- Student browses available courses
- Admin manages courses
- Student selects course → payment gateway integration → enrollment confirmation
- Admin can approve or reject course creation requests
- System should handle payment failure cases
🛤️ Step-by-Step Walkthrough
Step 1: Write a Detailed System Description
Before jumping into tools, clearly understand what you want to visualize. Draft a logical description of how the system components interact. This involves:
- Analyzing the source: For example, a source-code, pseudocode, or algorithm.
- Writing a short description: Explain the logic or flow in simple language.
- Identifying elements: Note down components like processes, inputs/outputs, functions, or actors that should be part of the diagram.
📌 Tip: This step can be manual or done in collaboration with AI by summarizing the core logic of your code/process.
Description Example:
- Student browses available courses.
- Student selects a course → proceeds to payment.
- System connects to Payment Gateway API.
- If payment is successful → student enrollment confirmed.
- If payment fails → show error and retry option.
- Admin manages course creation, edits, deletions.
- Admin can approve/reject newly created course entries.
Step 2: Ask Claude to Generate draw.io XML Code
Once you have the logical structure ready, use a detailed prompt to ask Claude AI to generate an XML-based diagram compatible with draw.io.
Claude AI is better at generating longer, cleaner code blocks compared to ChatGPT.
Example Claude Prompt:
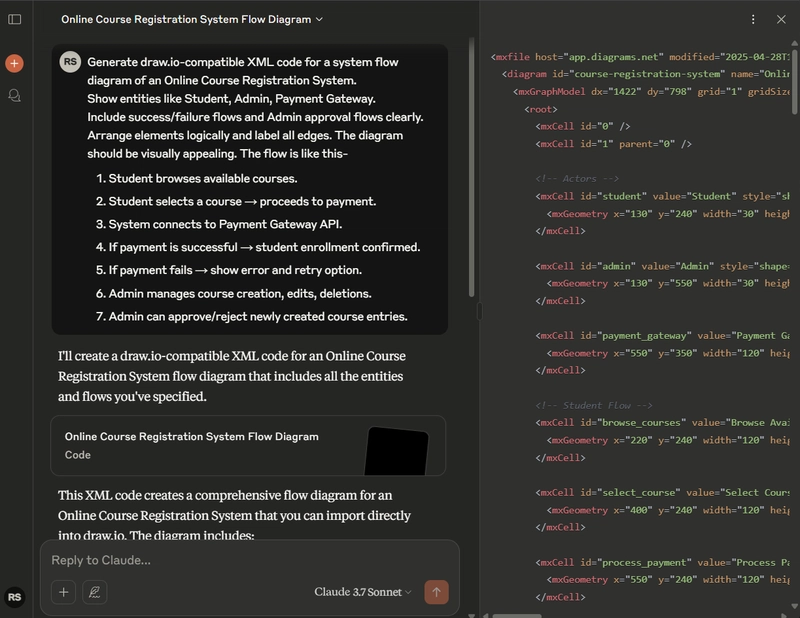
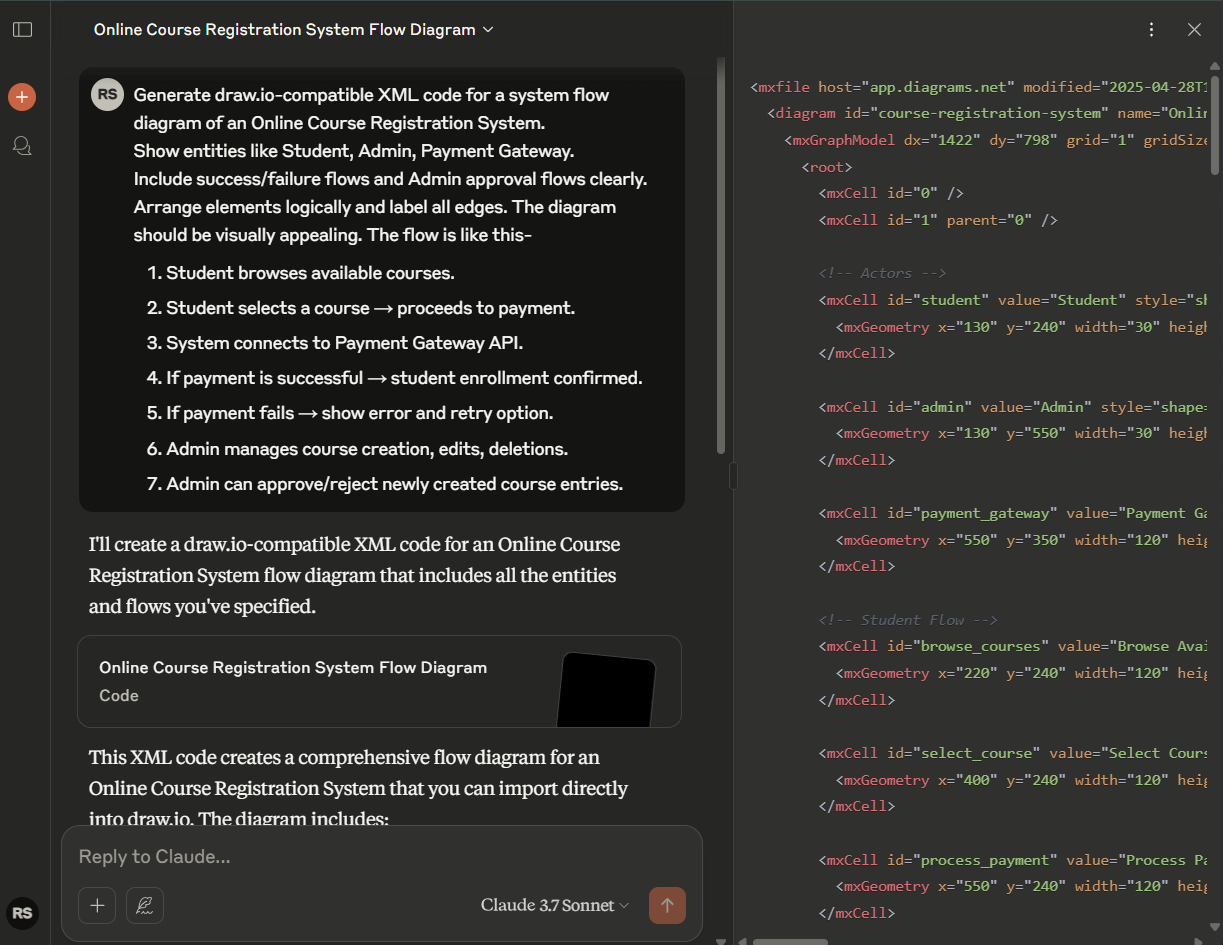
“Generate draw.io-compatible XML code for a system flow diagram of an Online Course Registration System.
Show entities like Student, Admin, Payment Gateway.
Include success/failure flows and Admin approval flows clearly.
Arrange elements logically and label all edges. The diagram should be visually appealing. The flow is like this-
- Student browses available courses.
- Student selects a course → proceeds to payment.
- System connects to Payment Gateway API.
- If payment is successful → student enrollment confirmed.
- If payment fails → show error and retry option.
- Admin manages course creation, edits, deletions.
- Admin can approve/reject newly created course entries.”
🎯 Claude responds with a complete XML.
📌 Tip: You can even provide entire source code, if it is single file. Claude will automatically figure out the flow of program.
Step 3: Create and Save the .drawio File
Steps:
- Copy the XML output.
- Open a text editor.
- Paste XML content.
- Save as:
📝
course_flow.drawio
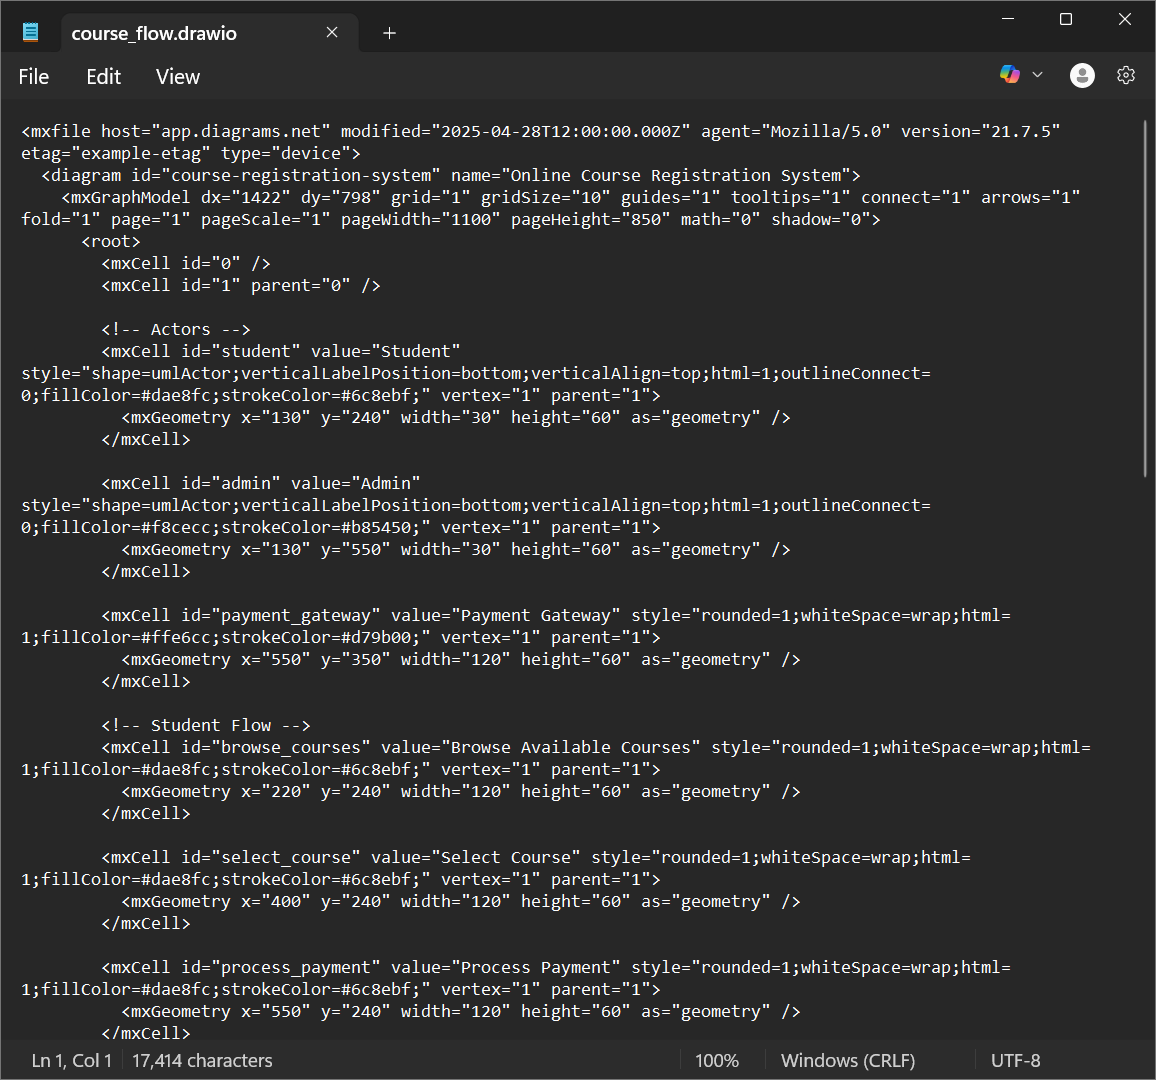
⚠️ Make sure to select All Files type when saving.
Step 4: Import into draw.io
There are two ways to do this:
1. Via Web App:
- Go to https://app.diagrams.net/
- Click Device → Open Existing Diagram.
- Select your
.drawiofile.
✅ Your system diagram should now appear automatically!
2. Via Desktop App: If you have the draw.io desktop application installed, simply open the file using it.
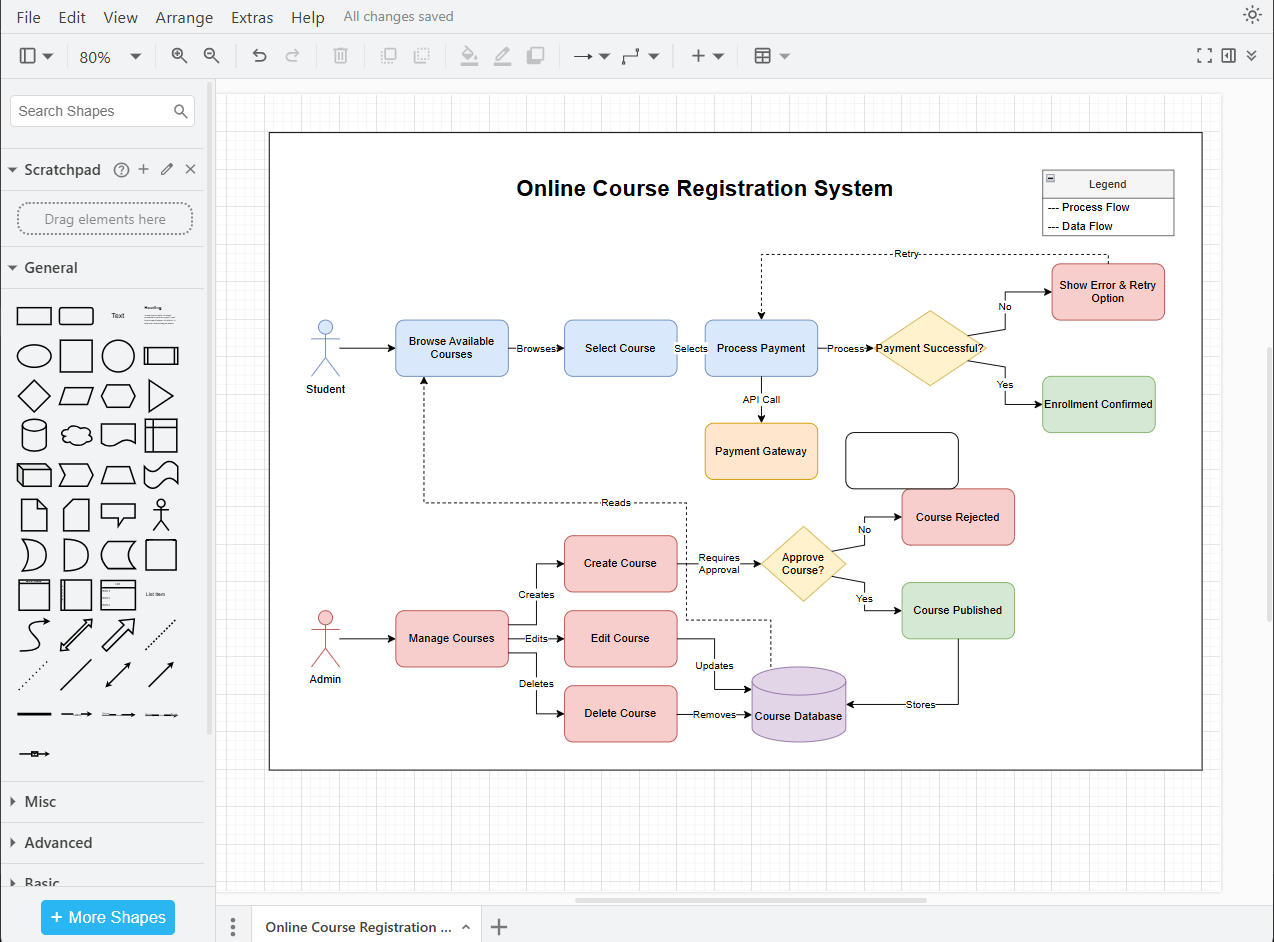
Step 5: Manual Adjustments for Visual Appeal
The imported diagram often needs cleanup for a professional look:
- Align boxes horizontally and vertically
- Color-code actors (Student, Admin, Payment Gateway)
- Label edges (e.g., "If Payment Fails", "Admin Approves")
- Use consistent shape sizing
🎨 Design Tips:
- Use different shapes for different entity types (rectangles for processes, diamonds for decisions).
- Stick to 2–3 soft colors (sky blue, light green, soft grey).
- Leave good spacing between elements.
- Add a plain rectangle as a background, to enable appropriate exporting of complete image(as png/jpg etc).
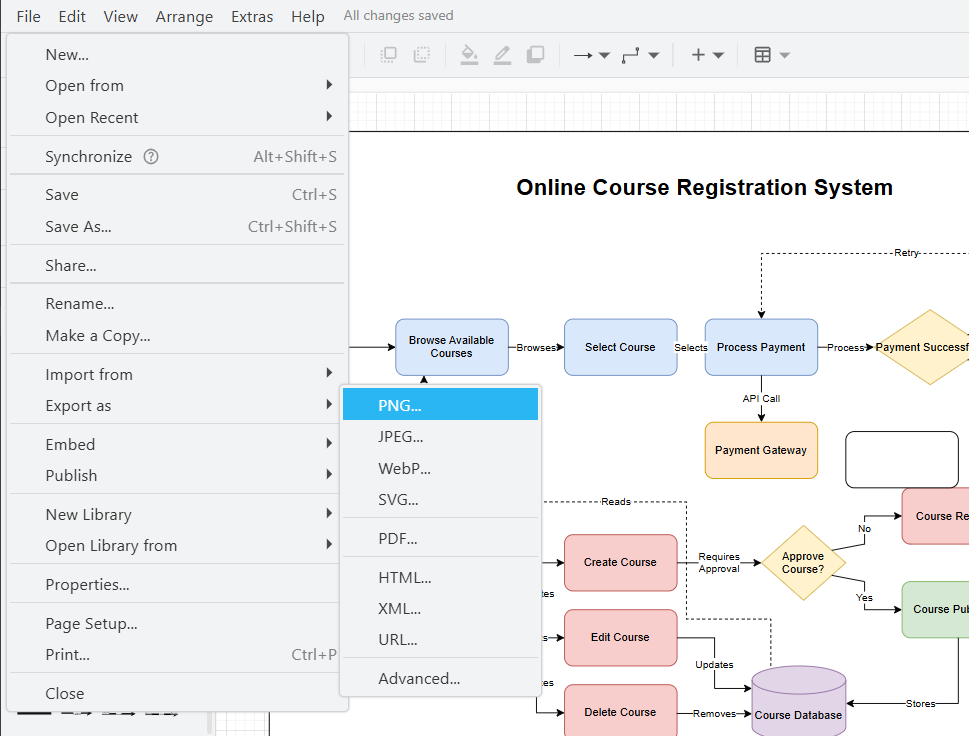
Step 6: Export the Final Diagram
Once finalized:
- File → Export As → PNG / PDF
- Enable "Include a copy of my diagram" for backup.
- Set high resolution for better quality.
🎯 Final Result
✅ A professional system diagram ready for:
- Project documentation
- Presentations
- Freelance portfolios
- Technical blogs
⚠️ Notes on AI Limitations
Code Length: ChatGPT has a limit on how much XML code it can generate. For complex or very large diagrams, consider alternatives like Claude AI, which can handle longer outputs.
Split Diagrams: For large systems, divide the diagram into smaller parts and generate/import them separately.
Verification: Always cross-check the logic and flow; AI may introduce small inconsistencies.
Extra Bonus Tip: What to Do Next?
- 💬 Add internal comments inside draw.io diagrams
- 🔄 Use this workflow for ER diagrams, UMLs, flowcharts, API flows